Abstract
We describe a novel 3D ultrasound technology, the Quantitative Transmission Ultrasound (QT Ultrasound® system and algorithm to image a pendent breast in a water bath. Quantitative accuracy is verified using phantoms. Morphological accuracy is verified using cadaveric breast and in vivo images, and spatial resolution is estimated. This paper generalizes an earlier 2D algorithm to a full 3D inversion algorithm and shows the importance of such a 3D algorithm for artifact suppression as compared with the 2D algorithm. The resultant high resolution ultrasound images, along with quantitative information regarding tissue speed-of-sound/stiffness, provide a more accurate depiction of the breast anatomy and lesions, contributing to improved breast care.
Keywords: Computational acoustic tomography, inverse scattering, imaging, acoustic, split step Fourier method, 2D, 3D
I. Introduction
HAND Held Ultrasound (HHUS) is the most common adjunctive modality used for diagnostic breast imaging. It is also used for secondary whole breast screening in certain indications and is routinely used for biopsy guidance. There are, however, several known limitations associated with HHUS. Obtaining and documenting images of the breast, whether in the diagnostic setting, or for adjunctive screening in patients with dense breasts or in high risk populations, i.e. gene mutation carriers, is time consuming and operator dependent. HHUS also has a small field of view and range, making it difficult to visualize and characterize posterior lesions especially in dense breast tissue[1]. The known specificity issues with HHUS leads to unnecessary biopsies and patient anxiety. Whole breast ultrasound such as the GE Invenia Automated Breast Ultrasound System (ABUS) or Siemens Acuson 2000 Automated Breast Volume Scanner (ABVS), have shown the value of standardizing whole breast ultrasound [2].
These systems and others, however, do not acquire true 3D data, and do not necessarily provide quantitative information regarding tissue stiffness. There has been extensive development of the 2D quantitative inverse scattering method over the past several decades[3],[4],[5],[6], as well as 3D methods that utilize methods of inversion that do not account for diffraction[7].
Other methods that do not employ a full wave inverse scattering solution have been investigated as well, [8],[9, 10]. Our inverse scattering method[11],[12, 13], provides a 3D volumetric image of the breast with quantitative information about tissue characteristics. This offers radiologists additional information regarding tissue elasticity as well as biomarkers that can be used in the evaluation of breast tissue as an aid in the characterization of breast lesions, ultimately improving specificity.
This is done by using a full 3D model that is incorporated into an inverse scattering based inversion of real world data, with diffraction and refraction accounted for in 3D. Other researchers have incorporated full wave effects, however only with 2D models[3], [4]
We build upon an earlier paper that describes 2D results [11] which shows 2D slices of the breast in the coronal plane, similar to a breast tomogram. However, as pointed out in that paper, it is difficult to constrain acoustic energy to a single plane, and thus artifacts are likely to occur when the true 3D nature of acoustic energy is not accounted for. These artifacts are discussed in this paper.
Acoustic/ultrasound inverse scattering, both obstacle and medium inversion, has been an area of intensive research over the past several decades[11], [1, 13-17]. However, it is well known that the computational complexity of performing even the forward problem in 3D wave propagation is tractable but time consuming, and the equivalent of several hundred forward problems have to be performed to carry out one inversion to produce an image. Consequently, without a very fast forward problem, the 3D inverse scattering solution is not a viable medical/clinical solution. The medical experts we have talked with (including the co-authors JK and EI) have estimated that a reconstruction time of less than 30 minutes is desired for clinical use. Thus, we show a fast forward method below.
Data collection methods vary in medical settings. In some cases, data are collected with a hand-held probe, which may be mechanically spatially registered. Alternatively, a water bath with an array or ring of transducers is utilized. [11, 18]
For HHUS and ABUS, categories of lesions have been established[19] based on the morphology, margin characteristics, orientation, presence or absence of posterior features e.g. shadowing, etc., which aid in diagnosis. However, the operator dependence and lack of standardization, time consuming scanning, reader variability and moderate specificity of HHUS have led to interest in tomographic methods[1, 18].
In this paper we will concentrate on the tomographic system being developed presently by QT Ultrasound Labs, and discussed in[11, 20].
Tomographic systems generally utilize either ray based techniques[15], which do not incorporate diffraction effects, wave based inverse scattering techniques, which incorporate all wave phenomena, or hybrid methods for the transmission mode images. An example of such hybrid and elegant methods to incorporate diffraction effects is [21]. However, the full inverse scattering approach is followed here. This approach is in effect a coefficient determination problem for partial differential equations (PDE) and thus computationally very expensive.
To make the method practical, we use frequency domain data, and utilize a parabolic (paraxial) approximation to the full Helmholtz equation[22]. This yields a very fast forward problem solver, concomitant Jacobian, and the required fast implementation of the adjoint of the Jacobian calculation, after some algebraic manipulation. See [11] and below, for details.
This is similar to the phase screen approach common in optics, oceanography, etc. which is based on an approximate factorization of the Helmholtz equation[23].
Furthermore, we compare the quantitative values from our Quantitative Transmission (QT) images of phantoms, with the speed of sound estimates obtained from methods in [24, 25], to validate our speed of sound estimates. We will also show some artifacts that can arise in 2D in vivo images of human breast that are ameliorated with the full 3D propagation model, and concomitant full 3D backpropagation.
The scientific hypotheses of our paper are 1) that we can obtain quantitative information of breast tissue at high resolution and accuracy, and 2) that the full 3D data acquisition (as opposed to 2D) and full 3D inverse scattering algorithm are required to give accurate high resolution speed of sound images. Indeed, we show that the 2D approximation can lead to artifacts in images of human breast tissue.
The quantitative resolution of our method is documented in[25], and below.
In section II we describe the water bath system used to collect the raw data, the inverse scattering algorithm, used to create the image, various phantoms used to verify quantitative accuracy, and the cadaveric breast to show morphological accuracy. We mention also, the in vivo images collected from volunteers under Institutional Review Board (IRB) protocols.
Section III analyzes the results of imaging various phantoms for quantitative accuracy. We also compare the cadaveric breast image to the MRI for morphological consistency. In vivo images are shown.
The resolution and other performance aspects of the system are discussed in [25]. Furthermore, we point out here the visibility of terminal ducto-lobular units (TDLUs), and the implications for resolution. We estimate the intrinsic resolution of the speed of sound image with a styrene rod phantom as well.
We also display some 3D renderings of an in vivo breast image and discuss the artifacts that arise when using a 2D algorithm (imaging in planes).
Section IV summarizes results and draws conclusions regarding the importance of 3D algorithms for quantitative accuracy, and the morphological accuracy of this scanner and algorithm.
II. MATERIALS AND METHODS
A. Data Acquisition and processing
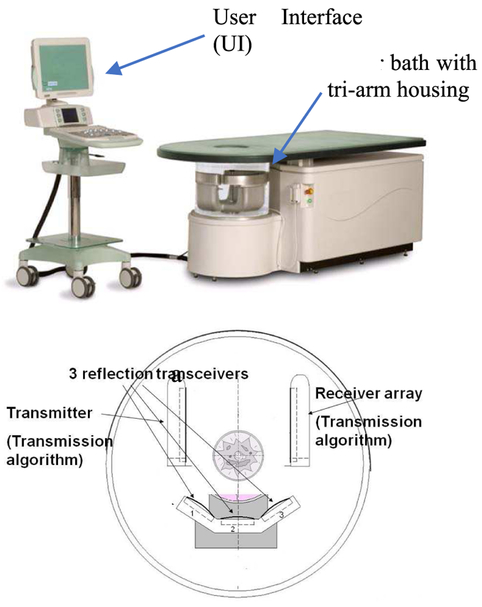
The QT Ultrasound®device consists of a transmitter, receiver, and three reflection arrays in a rotating housing within a water bath. The three sections of the array are seen in Fig. 1, as seen from above the water bath, with the table top extending to the right. They hold the transmitter and receiver array (8 rows by 192 columns = 1536 elements) – to collect transmission data – and three reflection arrays; 5 arrays in all. We do not discuss the reflection algorithm in this paper, however, see [20]. The transmission array is focused by a lens at 60 mm in an attempt to constrain the acoustic field vertically, with f-number = 3. In the horizontal direction, it resembles a plane wave.
Fig. 1.
(above) The QT Ultrasound® prototype, and the user interface (UI) cart, (below) the tri-arm containing the transmitter, the receiver array, and the three reflection arrays, seen from above.
However, as is well known, the physics of diffraction makes such constraint difficult.
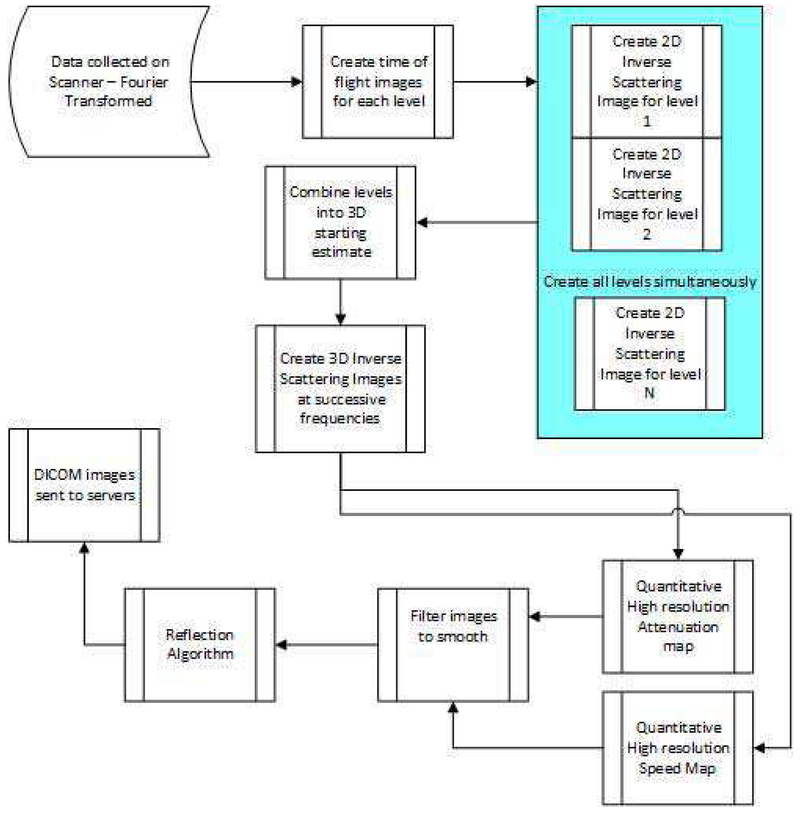
At a given level, the entire assembly rotates 360 degrees in total, shooting a chirp in the time domain, plane wave from the transmitter every 2 degrees that propagates through the water, into and through the breast, and ultimately impinges upon the receiver array. The whole assembly then moves up 2 mm, and rotates 360 degrees in the opposite direction. The resulting transmission data is multiplexed to A/D cards, and transferred to a separate processor, which applies the inverse scattering algorithm to compute attenuation and speed of sound (SOS). The sampling rate is 33 MHz, bit depth is 14 bits, and we record for approximately 50 μ secs. The reflection data is acquired through an independent beam-former and compounded as described in [16]. The water is heated to 31 deg. C and monitored/maintained at that temperature. The data is Fourier transformed to the frequency domain and stored. At each frequency, the data consists of 180 views, each consisting of 1536 complex values corresponding to the elements of the receiver array. We use a subset of these frequencies, generally equally spaced from 0.3 to 1.3 MHz, at intervals of 0.1 MHz, (~11 frequencies) to create the final image at 1.3 MHz, although the step size in frequency is still a matter of research. We create successive images at incrementally higher frequencies as we step through the bandwidth. As shown in the flowchart in Figure 2, we create 2D images for all levels at these frequencies, then we create 3D images starting from the concatenated 2D images, beginning at ~0.8 MHz. The number of frequencies used in the reconstruction is Nf req. Using too few frequencies and iterating too long at one frequency leads to over convergence and artifacts. However, using too many frequencies and not iterating enough at each, leads to under-converged images at the highest frequency. Using too many frequencies and iterations leads to unacceptably long (from a clinical perspective) reconstruction times. As mentioned above, a typical inversion will use ~11 frequencies. However, we emphasize this is breast dependent, and a full parameter study is outside of the scope of this paper. See Figure 20.
Fig. 2.
Overall flowchart of inverse scattering: data acquisition and reconstruction algorithm.
Fig. 20.
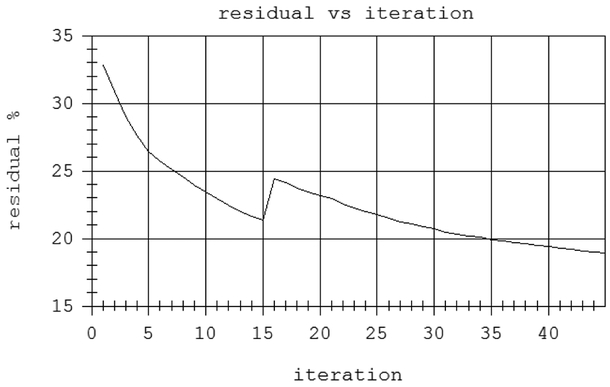
residual vs iteration count for two highest frequencies. The residual is normalized by the magnitude of the data. The frequency changed to 1.3 MHz at iteration 15.
B. Inverse Scattering Algorithm at a fixed frequency
The frequency data represents the total ultrasound field that has impinged upon the receiver array. This data has interacted with the breast tissue before reaching the array, and thus encapsulates information about the tissue structure in it. The process of inferring the tissue characteristics from this data is known as an inverse scattering problem. Our inversion algorithm at a particular frequency is based on a minimization procedure, using the L2 norm for the residual vectors defined by:
| (1) |
Here , and are complex vectors of size NR = 1536, the number of receiver elements in the array. represents the (Fourier transformed) predicted data for all 1536 elements at a particular frequencyωj, azimuthal direction θ, and level l. This predicted data depends on γ, the ‘object function’ defined as:
| (2) |
Where k (x) is the complex wavenumber, incorporating speed and attenuation as k (x) ≡ ω/c (x) + i α (x). ko ≡ ω/co, is the wave-number in water at frequency ω = 2π f, c (x)is speed of sound (m/s), and α is the attenuation coefficient in Np/m. The 1536-component complex vectors represent the residual between the predicted field, , and the measured field, , at each receiver position, for each transmitter position, θ, level l, and at the fixed frequency ω. Our 3D algorithm usesωj ≡ 2πfj, j=1,…,Nf req with fj ranging from 0.3 to 1.3 MHz, i.e. Nfreq = total number of frequencies utilized in the reconstruction. Unlike [11] the forward, Jacobian and adjoint of the Jacobian operators, are all fully 3D operators in this paper. The functional to be minimized at each frequency is therefore:
| (3) |
The minimization is carried out using a Ribiere-Polak (RP) version of the nonlinear conjugate gradients algorithm[11].
The algorithm in [20] is 2D, however, the generalization here is 3D and involves simultaneous minimization over all levels of the object function (breast), as well as propagation in 3D. We proceed from low frequencies to high frequencies, forming images at each frequency. The pixel size for the 3D algorithm is 0.65 by 0.65 mm by 1 mm tall. Only the highest frequency image is saved[20].
Thus, at a single frequency the functional Fωj (γ (x)) minimizes over all views, and all levels simultaneously, that is, it is a true 3D reconstruction. Note that the function does not have a regularizing term in the sense of Tikhonov. We rely on the natural tendency of the nonlinear conjugate gradient algorithm to move in the direction corresponding to the highest singular values for regularization. Thus, the noise will tend to be introduced only in the higher iterations. Our algorithm performs a predetermined fixed number of iterations at each frequency. These numbers are based on our experience in imaging and are breast dependent. Thus, we can’t give a single set of numbers for all breasts. However, see above discussion.
C. Forward Problem Operator
We require a fast solution to the forward problem at each frequency. To achieve this, we start with the Helmholtz equation (4):
| (4) |
Where f is the pressure at x ∈ Ω, Ω is the volume of the water bath. We use the parabolic approximation to equation (4), wherein the acoustic energy is presumed to propagate primarily in the x direction[11].
This parabolic approximation to the full Helmholtz equation governing wave propagation in inhomogeneous tissue, and the recursion in the direction of propagation, x, can be summarized as pj ≈ [tj] Apj−1, where pj ≡ p (xj, y, z) is the total field at propagation distance xj and y and z are the transverse coordinates[11]. The [tj] ≡ t (xj, x⊥) ≡ tj (y, z) is a multiplicative operator incorporating the object function γ. propagates the field through water, where F denotes the Fast Fourier Transform (FFT), F−1, the inverse FFT, and is the propagator through water in the Fourier domain, described in the Appendix.
D. Gradient of Function F: Jacobian and its Adjoint
The Polak-Ribiere version of the nonlinear conjugate gradient algorithm requires the gradient of the functional F in eqn (6),[11]:
| (5) |
Where is the Jacobian at circular frequency ωj, which is simply obtained by a perturbation argument on the forward problem recursion. This is a linear operator, so it is straightforward to determine the (Hermitian) adjoint operation, as in [11]. is the Hermitian conjugate of the Jacobian Jωj and is complex conjugate of γ.
E. Step length Calculation for Ribiere-Polak conjugate gradients
The step length at the nth iteration is , where dn is the Rp descent direction. gn is the nth gradient of the functional Fωj, and is the associated Jacobian. The action of the Jacobian on the descent direction is given by
Where: Jn ≡ (Jωj)n, the Jacobian at the nth iteration, dn, is the descent direction, , are the perturbations in the predicted data resulting from the perturbations in the object function, and δγ(x, y, z), at each data level l, and angle θ. See Appendix and [26]for more details.
Since the gradient and descent directions are derived from the forward model, the accuracy of the forward model is critical. We refer to[22], and references therein for a discussion of the accuracy of the solutions using the parabolic approximation as compared with the full Helmholtz equation in the forward problem. However, the quantitative accuracy in this paper and the spatial resolution shown in[25], argue for its accuracy.
The computational complexity of our forward problem is O (Nx Ny Nz log (Ny Nz)), due to the FFT’s. There are the equivalent of 5 forward problems in one iteration of CG. It is generally agreed that the parabolic approximation is ~3 orders of magnitude faster than the integral equation approach[22].
F. Phantom Studies
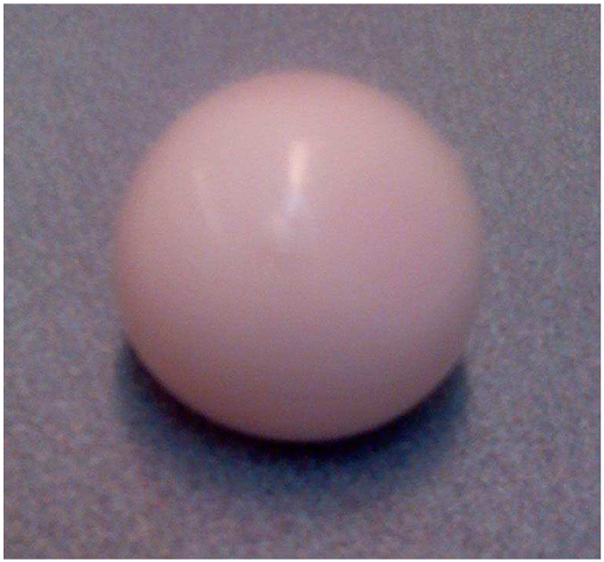
we utilize several quantitative phantoms to validate the speed of sound measurement. The first is a zerdine sphere 3.25 cm in diameter (Fig. 3) (CIRS, Inc., Norfolk, VA), to represent a true 3D object.
Fig. 3.
Zerdine™ sphere (CIRS)
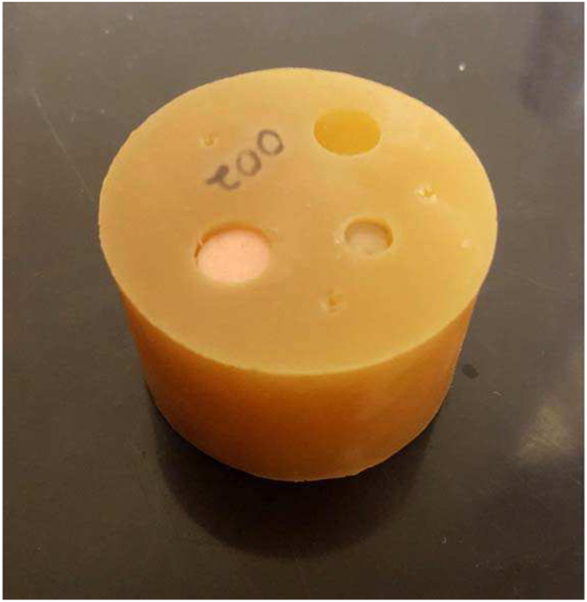
The second is a cylindrical polyurethane phantom (Yezitronix, Inc., Montreal, Canada) consisting of a 1.6 inch polyurethane background cylinder with several vertical holes drilled into it, some of which have been filled with polyurethane samples (Fig. 4.).
Fig. 4.
Phantom constructed from materials from Yezitronix, Inc., Canada, and polyurethane.
This phantom represents a more complex 2D phantom. The third is a gelatin based tapered cylinder phantom filled with a Laponite core (not shown). we also imaged 6 polyurethane cylinder phantoms, each 3-inches in diameter, and 2 inches tall, (Conversion Technology, Inc., CO, USA. - not shown).
we also imaged an additional shorter, very low speed Conversion Technology Cylinder (approximating fat). The cylinders were designed to test the quantitative accuracy and stability of our algorithm, and were chosen to represent a broad spectrum of speeds relevant to human breast. An additional 3” tall, 3” dia., sphere-filled cylindrical phantom of polyurethane was procured from Conversion Technology. There were 3 layers of spheres. Each layer contained 6 1-cm radius spheres, uniformly distributed in angle in the cylinder. This was used to compare 2D and 3D quantitative values.
In order to obtain quantitative estimates of speed of sound, the QT Ultrasound®images were manually segmented using a VTK/ITK implementation, based on speed of sound. The average and standard deviation were obtained from the segmented volume.
G. Cadaver Breast
A dense human breast from International Biologics (Scottsdale, AZ) was fixed in formalin solution and refrigerated until imaged in our device. This same cadaveric breast was imaged at the U. of Utah Center for Advanced Imaging Research (UCAIR) with 3 Tesla MR using a 3D Rapid Acquisition Gradient Echo (RAGE) sequence. The MR image served as ground truth to validate the 3D ultrasound tomography image.
H. In vivo images
Several examples from over 500 breast images from our scanner are shown and validated by experienced breast imagers (Radiologists), to establish the morphological accuracy of our images, and the visibility of the TDLUs.
III. Results and Discussion
A. Phantom Studies – Quantitative accuracy
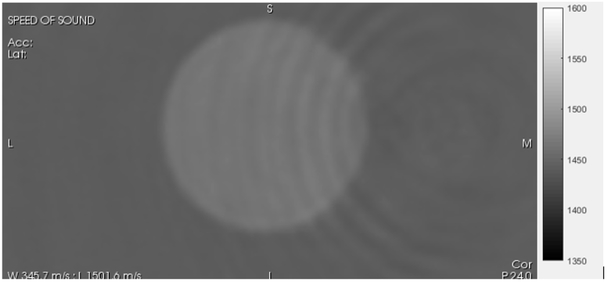
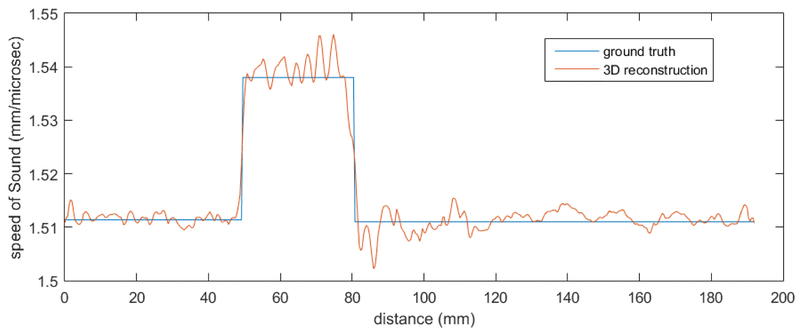
The QT image of the Zerdine™sphere (Figs. 6 and 7) yields an average speed of sound of 1537 m/s with a standard error of 8.9 m/s (See Table 2).
Fig. 6.
QT image of Zerdine™ sphere (Fig. 4) Grayscale varies from slow speed (1350 m/s –dark) to fast speed (1600 m/s – light).
Fig. 7.
Cross-section through Zerdine Sphere
TABLE II.
Comparison of QT measured values with independently determined values.
| MATERIAL | Avg | Std Dev |
Independent Value |
|---|---|---|---|
| SPHERE-ATTENUATION (dB/m/MHz) | 63.2 | 13.4 | 65 |
| SPHERE-SPEED (m/s) | 1537 | 8.9 | 1536 |
The ripples visible in both Fig. 6 and 7 are frequency dependent. There are various methods for the amelioration of these artifacts, including the use of the total variation (TV) norm. However, we have carried out in house studies and noted that radiologists have preferred very sharp images with artifacts over regularized images that may have less ripples but have smoothed areas as well.
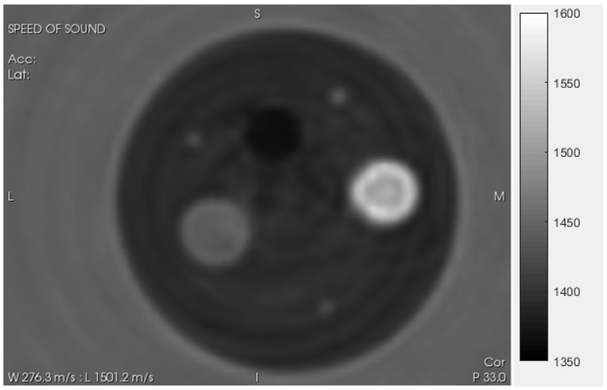
For the cylindrical phantom with inclusions (QT image in Fig. 5) the ground truth (accepted value) for the inclusions and the material comprising the phantom itself are shown in Table 1 and were obtained from larger samples that were obtained from the manufacturer (Yezitronix, Inc. Montreal, Canada), using dual piston methods as discussed in [25],[24].
Fig. 5.
QT SOS image of standard phantom from Figure 5, used to verify quantitative accuracy of our system. The grayscale varies from slow speed (1350 m/s- black) to fast speed (1600 m/s white). Values shown in Table 1. The large outside cylinder is 1.6 inches in diameter.
TABLE I.
Comparison of values for standard speed phantom.
| MATERIAL | Avg (m/s) | Std Dev | Percentage | Accepted Value (m/s) |
#Std Devs |
|---|---|---|---|---|---|
| BACKGROUND | 1448 | 5 | 0.35% | 1445 | 0.6 |
| HIGH SPEED | 1567 | 20.6 | 1.31% | 1566 | 0.0485 |
| LOW SPEED | 1409 | 8.3 | 0.59% | 1406 | 0.3614 |
| WATER | 1511.4 | 2.4 | 0.16% | 1511.9 | -0.2083 |
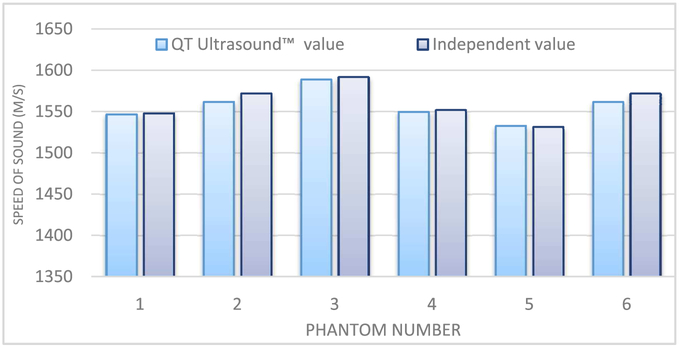
The results for 6 cylindrical phantoms from Conversion Technology, Inc., USA using the QT Ultrasound®device are shown in Fig. 8. The speeds of these uniform cylindrical phantoms were also measured using dual piston methods described in[24, 25].
Fig. 8.
comparison of the 6 QT Ultrasound™ derived SOS values versus independently measured values using[24].
The values for the 7th cylindrical phantom (only 1 inch tall) from Conversion Tech. was imaged and segmented. Also the water bath itself was segmented and produced a value that was uniformly close to the formula for speed of sound determined by Del Grosso and Mader [27]. The result is shown in Table 4.
TABLE IV.
Comparison of speeds of sound for short cylinder with lower speed of sound (~fat values).
| Phantom | Speed of Sound (m/s) |
Std dev (m/s) |
Independent measure (m/s) |
|---|---|---|---|
| T2039-6634 | 1469.8 | 3.7 | 1473 |
The relative error (no units) for the Conversion Technology cylindrical phantoms averaged over 6 cases was: (QT value – Independent value)/Independent value = −0.00217 or 0.22 %
The QT value for speed-of-sound was thus slightly lower than the independent value by approximately 2.2 parts in 1000.
Note also the ring artifacts in Fig. 6. These geometric artifacts are centered at the image center and are frequency dependent. These and similar contour-following rings could possibly be addressed with suitable regularizing terms, such as the total variation constraint. [28]. However, in our experience the radiologists prefer to see detail even if it is contaminated slightly by some artifacts. Hence we have avoided regularizing terms in this paper. This is an area of future research.
B. Cadaver Images
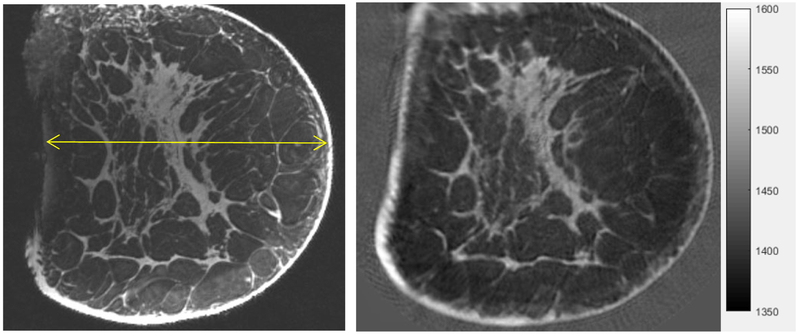
The Cadaver MRI image compares remarkably well with the QT SOS image as shown in Figure 11 as validated by the radiologist E. Iuanow, MD and J. Klock, MD. Their validation indicates that what we image is true breast tissue morphology, at high resolution, even in cadaveric breasts, which are of course, much more complex than the phantoms. We do note that fixing tissue can indeed alter the speed of sound. We have compared the SOS for various tissues in fixed and unfixed states. It is known that (formalin) fixing tissue increases its stiffness (through cross-linkage of protein), and thus its SOS. In particular, we observed that for fat tissue, fixation resulted in an increase in the SOS by 0.4%, and for fibroglandular tissue, fixation resulted in 0.1 % increase. The non-parametric Mann-Whitney test showed the difference to be insignificant for p > 0.05, n = 10.
Fig. 11.
Comparison of MRI (MP RAGE, 3T, UCAIR, U of Utah, SLC - left) with Coronal speed of sound image from our device (right). Standard grey scale applies: low speed = dark gray, high speed = light gray. Note the detailed agreement of the structure of the fibroglandular tissue between the QT Ultrasound® image (right) and the MRI (left). The yellow line is 130 mm long.
The speed of sound of skin tissue was observed to decrease by 0.3 % (also insignificant for n=10, p > 0.0.5). This contrary result is due, we believe, to volume averaging. In particular, fixing also causes tissue shrinkage (again related to protein cross-linkage). For the skin, which is a thin tissue type, this exacerbates the volume averaging problem, since it is surrounded by slower regions (water on one side, and fat on the other). Volume averaging in conjunction with the fixation induced tissue shrinkage results in the observed decrease in SOS.
Therefore, we believe the comparison of the cadaver tissue in the MR mode vs the 3D ultrasound tomography is appropriate.
C. In Vivo Breast Images – TDLU
We have also imaged ~500 breasts using these methods under IRB approved clinical study protocols. Typical images are shown in Figures 9 and 10. The fibroglandular tissue has a lighter appearance in the grayscale, whereas the fat has a darker appearance, i.e. a lower speed of sound. The grayscale varies from 1350 to 1600 (m/s) with a center level at 1475 m/s[12], as in Fig. 6. These images are of dense breasts, which are of particular importance in clinical evaluation.
Fig. 9.
Left: Coronal view, Middle: Axial view, Right: Sagittal view. A reconstruction showing fibroglandular tissue (lighter grayscale) and fatty tissue (darker grayscale) and 3D nature of reconstruction. Speed ranges from ~1430 (fat) to 1600 (lesions). The stippled appearance of the fibroglandular tissue is due to the ability of the algorithm to differentiate between glandular and ductal tissue. The yellow line diameter in the coronal image is 93 mm.
Fig. 10.
A dense breast showing fibroglandular (light gray) and fatty tissue (dark), and fibroadenoma (arrows). It is known that these structures are difficult to see in dense breasts in mammography. The two fibroadenomas are visible in the coronal view (arrows). The red cross is centered on one of the fibroadenomas in all three views. The breast is 91.0 mm in cross-section in the coronal view (yellow line).
Note in particular, the stippled appearance of the fibroglandular tissue (the lighter grayscale). We believe this is due to the ability of our algorithm to differentiate between glandular elements (speed values 1517-1567 m/s) from ductal tissue elements (speed values 1560 – 1612 m/s) as verified in [29] by histology. These TDLUs are ~1 – 4 mm in size. We recognize that the stippling may be a stochastic realization of subwavelength scatterers. See below for a full discussion.
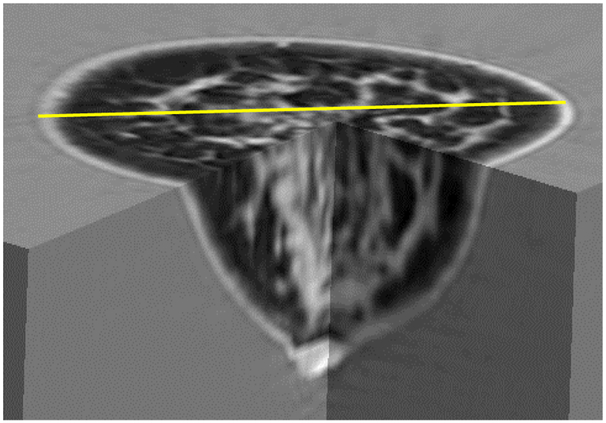
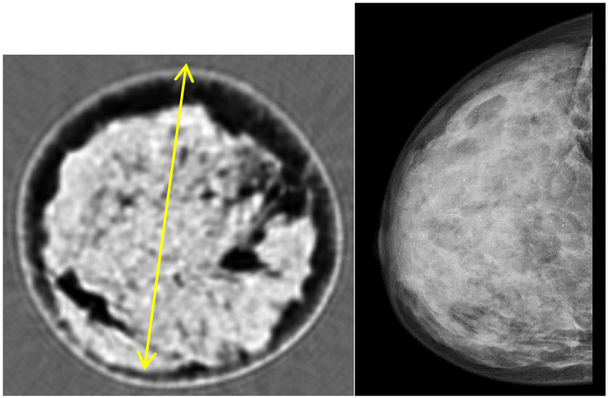
The 3D nature of our image is seen in Figure 12. Further evidence of our ability to image dense breast tissue is seen in Figure 13, (below) which also shows the corresponding mammogram to validate the dense nature of the breast.
Fig. 12.
3D representation of QT Ultrasound® image showing true 3D nature of image. Grayscale: light=high speed. The fibroglandular tissue and skin are light gray. The diameter shown in yellow is 106 mm.
Fig. 13.
Coronal view of QT Ultrasound(R) image of dense breast (left), XRM (X ray Mammogram) of same breast, validating the dense nature of the breast. The stippled appearance on the left is due to the presence of TDLUs [29] and ‘summary discussion below. As in Fig. 9, diameter of coronal breast image is ~93 mm.
A further example of the 3D nature of our algorithm is seen in the movie (Online Version Only). The movie represents what a radiologist would see if she/he were to scroll through the breast in the coronal view. The gray scale in the movie is as in Fig. 9. Note especially the smoothly varying nature of the fibro-glandular tissue in contrast to the abrupt appearance and disappearance of the lesion, indicative of suspect breast tissue. The high speed (light gray) lesion eventually appears and disappears within the red-circle.
D. Resolution
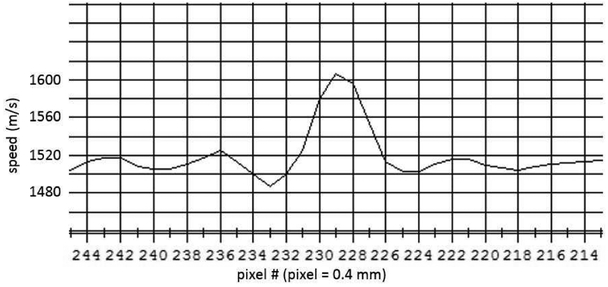
The ability to see the TDLUs indicates a resolving capability of ~1 mm. This is verified by our imaging of a styrene rod 0.5 mm in diameter. We used the sum of squares approach to evaluate the square step response and remove the step width as described in[25].
The measured FWHM, Rmeas, is from a line plot in the y direction, that is the convolution of the true width Sobj of the test object with the intrinsic response of the system, Rint. Assuming that the responses can be approximated by Gaussians, then,
The full width at half max (FWHM) is estimated to be ~1.4 mm, which gives, by the above formula, using Sobj = 0.5 mm, Rint = 1.308 mm. The same calculation using the line plot in the x direction, gives Rint = 1.520 mm. The average intrinsic resolution is then, Rint = 1.414 mm in the horizontal plane. The slice thickness in the vertical direction is given as 2 mm in [30]
E. 2D artifacts
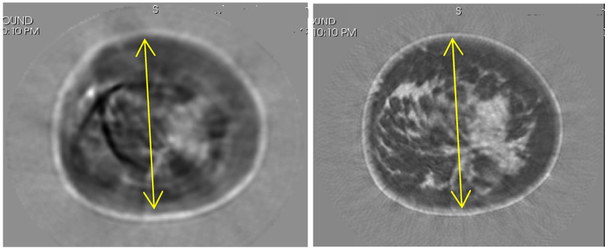
We have observed that using the 2D model to invert for each level separately, then combining these 2D images after the manner of CT, yields artifacts in both speed and attenuation images. The attenuation images are also susceptible to artifacts since the 2D algorithm has no way of interpreting energy that is scattered out of plane, and thus must interpret it as attenuation, whereas the 3D algorithm can account for this[11]. Unlike X-rays, ultrasound energy experiences a great deal of out-of-plane scattering, even with vertical focusing.
One artifact that can occur in the 2D reconstruction procedure is that a high-speed area will appear as very low speed, i.e. lower than fat.
In one of our cases, the skin line, which had a speed of sound of 1533-1550 m/s in the 3D image (similar to ~500 3D images reconstructed to date) in the 2D reconstruction had a speed of sound value of ~1386 m/s. In other cases, we had observed that a low speed artifact of this type occurred internally as well, as shown in Figure 15. This anomalous speed value is substantially below even that of fat, and is problematic, since we have observed that solid lesions are characteristically higher speed (1570 m/s and higher) than fat, ductal, glandular tissue and complex or simple cysts[29]. Also, the attenuation in this 2D image was as high as 24 dB/cm/MHz. Worse, the attenuation would continue to rise (seemingly without limit) at some pixel values, when the 2D algorithm was allowed to iterate. On the other hand, the 3D algorithm attenuation values tend to converge to reasonable values. In this situation, the speed of sound from the 2D image has an uncharacteristically low value in the middle of the breast at this particular level. (Fig. 15)
Fig. 15.
Comparison of a volunteer 2D vs 3D reconstruction for a given level, indicative of artifacts that can occur. Left panel shows the 2D algorithm image with artifacts. Right panel shows the 3D algorithm reconstruction with correct anatomical features. Grayscale varies from 1350 m/s (black) to 1600 m/s (white). Yellow lines are 125 mm for reference.
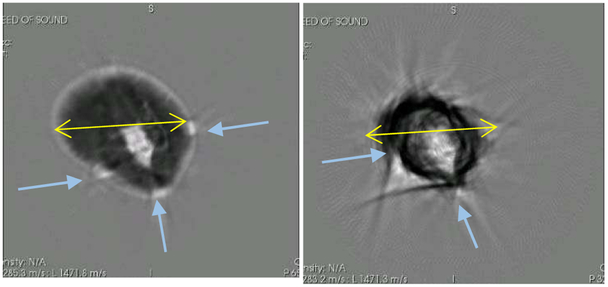
Another instructive example is shown in Figure 16. Here, the volunteer was scanned and the data was imaged with the 3D algorithm and the 2D algorithm for comparison. Figure 16 shows the image that results at one particular level. The right panel shows the reconstruction when the 3D algorithm was used to invert the data, and the left panel shows the reconstruction resulting when the 2D algorithm was used to invert the data. Both algorithms were inverted at 1.3 MHz and with the same number of iterations to achieve convergence. We note in particular, that the 2D reconstructed image is missing a substantial portion of breast tissue, there are substantial artifacts in the breast tissue, and the skin line is missing. We believe this is partially due to the presence of the tape used to secure the breast to a movable rod below the breast for stabilization. The 3D algorithm, however, has correctly reconstructed the tape itself.
Fig. 16.
An instructive example of the inadequate reconstruction of the breast tissue by the 2D algorithm. Left shows the Coronal view as reconstructed with the 3D algorithm. Right panel shows the reconstruction of the same breast at the same level with the 2D algorithm. The retention tape has caused bright artifacts (high speed) in the 2D image. Arrows show position of tape (left) and associated artifacts (right). For reference, the yellow lines are 90 mm.
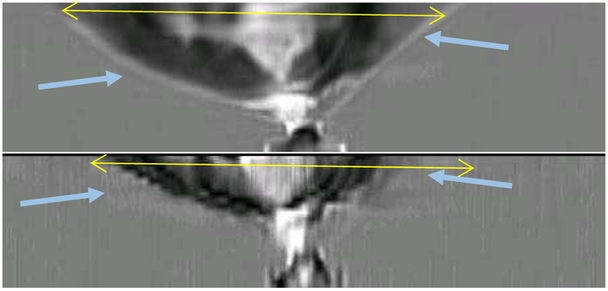
The failure of the 2D algorithm to adequately reconstruct the breast tissue is furthermore seen in the axial images of the same breast, as seen in Figure 17. The top part of the image is reconstructed using the 3D algorithm, but is completely missed by the 2D algorithm. The top 1 cm in the 3D image is reconstructed solely by the 3D algorithm naturally utilizing the thickness of the ultrasound beam. Even where the 2D algorithm has attempted to reconstruct the breast, it has failed to reconstruct relevant parts of the breast at all, and the skin line in particular.
Fig. 17.
Axial views. The top shows the 3D algorithm reconstruction; the bottom shows the 2D reconstructions concatenated together. Note that the vertical resolution of the 2D algorithm is extremely poor, and parts of the breast have not been reconstructed at all, while other volumes show severe artifacts due to the securing tape. Furthermore, the top 1 cm of the breast is not reconstructed by the 2D algorithm at all. The yellow lines in each frame are 98 mm, for reference.
It is important to note that these are not atypical artifacts, but failures of the 2D algorithm. Simply stated, creating a series of 2D slices and putting them together to form a 3D image fails for ultrasound when the breast is not close to ‘cylindrical’ in shape and internal structure. The ultrasound energy is not constrained to a single plane and 2D methods cannot by their very nature account for this. 3D methods not only account for the out-of-plane energy, but use it to produce more accurate images.
Not surprisingly, the 2D images are reasonable where the breast is almost cylindrical. However, the pendent breast in water certainly is cylindrical only in certain special cases, and then, only at certain levels of the breast, and the fibro-glandular tissue may not be at all. Therefore, artifacts can easily occur that lead to incorrect speed of sound and attenuation values. These and other artifacts are avoided with full 3D modeling.
It is also certainly true that if the object is ‘cylindrical’ or cylindrical-like, that the 2D algorithm will give reasonable results and the 2D form factor can be partially compensated by the methods shown in[31],[32]. These elegant results however are validated using the Born approximation (weak scattering approximation), which is not applicable in our case. However, it is true that the formulas may still be applicable in other situations not found here.
The greater difficulty is that even in those situations where one might suppose that the 2D approximation might work, there is no guarantee that artifacts may not arise in the nonlinear inversion. The weak scattering approximation is a linear approximation that does not take into account multiple scattering in any meaningful way. This is problematic for the contrasts encountered in breast tissue. In fact, we have documented that there are severe artifacts in some cases, and there are artifacts that occur even in an approximately 2D body.
F. 2D – 3D comparisons of spheres.
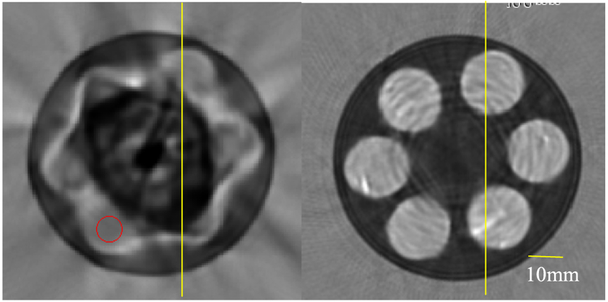
Finally, we compare the reconstructions of spherical inclusions within a cylinder with 2D and 3D code. This sphere filled phantom is 3 inches in diameter and 3 inches tall, filled with 3 layers of 2 cm dia. spheres. Each layer contains 6 spheres.
The 2D reconstruction fell into a local minimum at an early stage in the algorithm and the speed of sound using an ROI tool was 1489 m/s with standard deviation (sd) of 4.2. The 3D algorithm reconstruction had a speed of sound of 1533.6 m/s with an sd of 9.9 m/s.
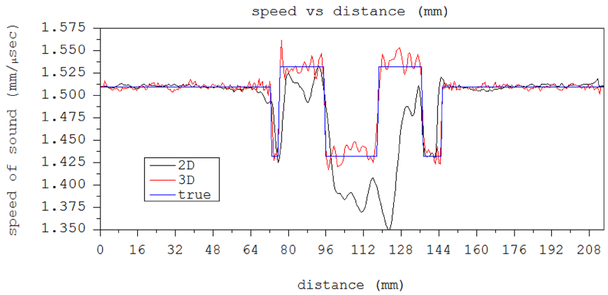
Figure 18 shows the 2D vs the 3D reconstruction of one level of the spheres-in-polyurethane phantom. The speed reconstruction shows that the 2D has fallen into a local minimum solution. Both were imaged at 1.3 MHz. The red circle shows the ROI chosen to calculate the sphere’s speed of sound for the 2D algorithm image.
Fig. 18.
Left shows 2D algorithm reconstruction at a level containing 6 spheres. The yellow line is 10.0 mm long. Red circle shows ROI corresponding to position of sphere, in which SOS is calculated. 2D algorithm has fallen into local minimum. It cannot deal correctly with the close proximity of the spherical objects. Right shows 3D algorithm reconstruction. Cylinder is 3” in diameter.
Note that the estimated speeds for the spheres differ dramatically between the 2D and 3D algorithm images, whereas the speeds for the background are the same.
IV. Summary discussion
We have used the 3D phase screen/Fourier split step[23] approach to approximate the Helmholtz equation, in our 3D inverse scattering algorithm. We then established its quantitative and spatial accuracy a posteriori by phantom, cadaveric and in vivo studies carried out on the QT Ultrasound®device[25].
The values of speed represented a good cross section of tissue appropriate values, ranging from fat at ~1410 m/s to cysts (1530 m/s) to solid lesions at 1590+ m/s. See Figs. 6, 7, and 8, and Tables 1 and 2.
Fig. 8 establishes the accuracy of our speed of sound measurement over a range of values from 1530 to 1590 m/s. These represent typical speeds encountered in fibroglandular tissue.
Table 3 establishes the accuracy of our method for high speeds (1570) and speeds lower than the 1530 m/s reconstructed above, but higher than fat.
TABLE III.
Speed-of-Sound values for gelatin and Laponite compared to independently measured values.
| MATERIAL | QT derived SOS value (m/s) |
Std dev (m/s) |
Independent SOS value (m/s) |
|---|---|---|---|
| GELATIN | 1571 | 17.1 | 1555 |
| LAPONITE | 1510.7 | 16.9 | 1502.5 |
Also, the cylinder in Table 4 shows accuracy of reconstruction for speeds in the 1470 range. Thus, at speeds approximately 1410, 1450, 1470, 1510, 1530, 1537, 1548, 1550, 1560, 1570 and 1590 m/s we have verified quantitative results. These speeds represent a fair sampling of tissue in normal breast. For the 6 cylinders the relative error averaged out to approximately 0.22%, indicating a good degree of accuracy.
We have also shown that the speed of sound image produced by the QT Ultrasound®system is self-consistent (low relative standard deviation) and accurate for the phantoms shown when compared against other measurement methods.
We have estimated the intrinsic spatial resolution, using methods from[25], at ~1.414 mm, which agrees with the fact that we are able to see TDLUs in our SOS image, which are 1-4 mm in size
Since the speed of sound of the tissue has been shown to be correlated highly with bulk modulus[33], or stiffness of the tissue, this allows comparison with methods that measure other moduli – shear modulus, for example. We note that shear modulus changes more dramatically from normal tissue to solid lesions, however our tomographic full 3D image (of bulk moduli) gives a volumetric perspective more difficult to obtain than with standard elastography measuring devices.
Computing the attenuation image is a more challenging (severely ill-conditioned numerically) part of the problem than the speed of sound image, and requires further work to validate, to be clinically useful. Thus, no attenuation images are included in this analysis.
We have avoided the use of regularization for the reasons enumerated above. Our method of minimization is a standard Ribiere-Polak nonlinear conjugate gradient method. The convergence characteristics for the two highest frequencies are seen in Figure 20. The residual plotted there is normalized by the L2 norm of the data: i.e. where is the sum over all angles and all data levels at frequency ω = ωj. We have also considered Quasi-Newton type methods (such as L-BFGS), but the efficiency of the RP conjugate has led to its adoption in this paper. Our algorithm performs a fixed number of iterations at each frequency at the present time.
Another issue is the morphological accuracy of our images. This is clearly required for clinical utility of our device. This was established in two independent ways. First a cadaveric breast was imaged with both an MRI and our device. The comparison in Figure 11 shows clearly the close correspondence between the MR image and ours. There are some differences due to the slight mis-registration between the two images which means that the planes shown are not absolutely co-registered. Also, there is some relative deformation since the MRI is obtained in air, whereas the QT image is obtained in water.
Secondly, Figures 9, 10, 12 and 13 show the QT images of human breast in vivo. Here the breast fibroglandular tissue is shown in light gray. The complex 3D nature of the fibroglandular tissue is evident from these images. The morphological accuracy of these images was verified by a radiologist (E. Iuanow, MD) and an oncologist specializing in breast anatomy (J. Klock, MD). In fact, as established in[29], there is a strong correlation between the cross-sectional anatomy of the breast and the QT Ultrasound ®images.
Note also that Figures 9, 10 and 13 are of dense breasts, which are of particular importance in that the risk for breast cancer is substantially increased in dense breasts. Furthermore, they show clearly the TDLUs, indicating resolution of ~1 mm. It can be argued that this pattern is “speckle-like”. However, we believe it is a deterministic representation of the tissue characteristics for several reasons given in [34]. Furthermore, recall that the speckle that is associated with B-mode images is the result of scattering from sub-wavelength scatterers presumed to be randomly distributed throughout the tissue being imaged. Their reflected signals are added destructively or constructively depending on their phase. The strength (amplitude) of the reflected signal is itself presumed to be random. One method that has been historically used to decrease the speckle has been the compounding of several images. We do this compounding explicitly in our refraction corrected reflection images, with the result that these images are speckle free. The SOS inversion is model based and the compounding is carried out within the operation of the algorithm rather than after the fact. The observed variation in the speed of sound between the glandular tissue and the ductal tissue is approximately 1542 vs 1586 m/s [34]. Furthermore, the standard deviations are 25 and 26 m/s respectively, so the spread in speed of sound can be much higher. Due to the small physical size of the variations, there is some volume averaging taking place, so it is reasonable to take the larger spread in speed of sound as representative, thus the average difference is at least 44 m/s between the glandular and ductal tissues. The variations in the fat tissue on the other hand are over a larger spatial area and the standard deviation of fat in our images is only 9 m/s. This fact, in addition to the observations of Klock et al. [34] and the presence of compounding give evidence that there is little speckle in the speed of sound images: i.e. that we are seeing true tissue variation. Further experiments will be carried out to further substantiate this claim. See also [34]
We provided evidence that the 2D algorithm is substantially faster, but inadequate to account for inter-planar scattering and the vertical extent of the acoustic incident field, which led to unpredictable artifacts in the final image. While such artifacts may be negligible in ‘cylindrical’ regions of the breast, their unpredictability is problematic in the clinical setting. Clearly there will be regions of the breast where a 2D algorithm will suffice. Furthermore, other 2D algorithms than ours may be more successful in imaging the 3D breast. However, the failures that we have documented would indicate that any 2D algorithm would have to be validated extensively before being trusted in a clinical setting, where accurate diagnoses are important. Further investigation is required on this point to state categorically that 2D images are inadequate.
V. CONCLUSION
After 40+ years of research, ultrasound tomography has reached the point of being close to clinically relevant. We believe the reconstruction times do not prohibit the use of the device in a clinical setting. The data acquisition requires approximately 11 seconds/level (2mm/level), and reconstruction requires approximately 40 seconds per level. This results in a typical scan time of approximately 7 minutes per breast and approximately 35 minutes to reconstruct. Remarkably, even other 2D model inversions that incorporate diffraction (beyond the Born/Rytov approximation) and refraction, can take reportedly similar reconstruction times[4],[3].
No ionizing radiation is involved, and therefore this device is amenable to continued follow-up of likely benign lesions, even in pregnant, or young, women. In all, this makes for a practical, clinically relevant device. We have imaged over 500 breasts in real world situations, of various sizes and densities, with results similar to those shown in Figures 9, 10 and 13.
The high resolution, high image quality, suppression of artifacts, computational efficiency, full 3D modeling, and quantitative accuracy all make for a powerful argument for the clinical relevance of 3D quantitative transmission ultrasound. This paper describes the QT Ultrasound®system and algorithm for imaging a pendent breast with transmission ultrasound for quantitative characterization of breast tissue. We believe that using ultrasound tomography will provide better accuracy in characterizing breast tissue and lesions identified in the clinical setting, ultimately improving patient care. Having established the quantitative and morphological accuracy, more research is needed to build on the foundation laid here
We are currently involved in or have completed several clinical studies to ascertain the clinical value of our device, e.g. [35], [36].
Supplementary Material
Fig. 14.
A section of the line plot through the reconstructed 0.5 mm styrene rod. The pixels are 0.4 mm wide. The vertical increments are 20 m/s, with a max at 1605 m/s.
Fig. 19.
Line plots from Figure 18 through the vertical yellow line in both left (2D image) and right (3D image) panels. The 2D algorithm has failed due to the 3D nature of the spheres.
TABLE V.
SPEEDS OF SOUND FOR SPHERE/CYLINDER PHANTOMS (STD DEV)
| OBJECT | 2D ALGORITHM (M/S) |
3D (m/s) | Independent (M/S) |
|---|---|---|---|
| SPHERE IN POLYURETHANE CYLINDER |
1489 (4.2) | 1533.6 (9.9) | 1532 (3.4) |
| BACKGROUND (POLYURETHANE) |
1438 (3.3) | 1438 (8.5) | 1432 |
Acknowledgements
We thank QT Ultrasound Labs employees, CIRS, Yez-itronix, Inc., Dr. Matthew Lewis (University of Texas, Southwestern), Dr. Bilal Malik, and Stephen Darrouzet, for phantom work, and acknowledge support from the National Cancer Institute: NIH grant R01-CA138536.
This research is supported by NIH – NCI Grant R01-CA138536. J. Wiskin, (james.wiskin@qtultrasound.com), M. Lenox, (mark.lenox@qtultrasound.com), E. Iuanow, (elaine.Iuanow@qtultrasound.com) and J. Klock john.klock@qtultrasound.com) and D. Borup are with QT Ultrasound Labs, Novato, CA, 94949.
Appendix
A. Forward problem calculation
The parabolic approximation to (4) leads to the following recursion acting on the initial field at to give the total field for j = 0, …, N – 1:
| (6) |
The ∘ indicates element-wise multiplication of two matrices: i.e. if Aλμ, are components of 2D matrices, , i.e. it is Hadamard, or Schur, multiplication. Findicates Fourier Transform. is the 2D matrix with elements, , ε is step length in x, Δk is step length in transform space: ky, kz. and is the “phase mask” element-wise multiplication operator. γ is the object function defined as above.
This forward problem is a parabolic approximation to the full Helmholtz equation governing wave propagation in inhomogeneous tissue, and the recursion in the direction of propagation, x, can be summarized as pj ≈ [tj] Apj−1, where pj ≡ p (xj, y, z) is the total field at propagation distance xj and y and z are the transverse coordinates. It is also necessary to incorporate the receiver element characteristics in the model if the wave model is to accurately mimic the real data, and make the residual vector meaningful[11]. The operator[tj] ≡ t (xj, x⊥) ≡ tj (y, z) is a multiplicative operator incorporating the object function γ. Note that propagates the field through water.
B. Gradient of Functional Fω: Jacobian and its Adjoint
The Polak-Ribiere version of the nonlinear conjugate gradient algorithm requires the gradient of the functional Fω in eqn (6), see also [11]:
| (7) |
Where is the Jacobian at some fixed frequency ω, which is simply obtained by a perturbation argument on the forward problem recursion, as shown below. This is a linear operator, so it is straightforward to determine the (Hermitian) adjoint operator This is carried out as in [11]. is the Hermitian conjugate of the Jacobian Jω and is complex conjugate of γ.
C. Step length Calculation for Ribiere-Polak conjugate gradient algorithm
The step length , where dn is the RP descent direction. gn is the gradient of the functional Fω, and is the associated Jacobian at the nth iteration. The action of the Jacobian on the descent direction is given by
Where:
δpj = Apj−1 ∘ δtj + t (xj, x⊥) ∘ A (δpj−1), j=1,…N, operator, so that δpN is the perturbed field closest to the arrays, and T is the translation operator to the receivers and is the perturbed data on the receiver array resulting from a perturbation of the γ, given by dn ≡ δγ, propagates a field a distance ε through water, and δtj (x⊥) ≡ −iεk0tj (y, z) δγ (xj, y, z) from the definition of the phase mask tj.
REFERENCES
- [1].Andre M, Janee H, Otto G, Martin P, Spivey B, and Palmer D, "High speed data acquisition in a diffraction tomography system employing large-scale toroidal arrays," Int. J. Imaging Syst. Technol, pp. 137–147, 1997. [Google Scholar]
- [2]."Invenia ABUS system by GE," ed. [Google Scholar]
- [3].Wang K, Matthews T, Anis F, Li C, Duric N, and Anastasio MA, "Waveform Inversion With Source Encoding for Breast Sound Speed Reconstruction in Ultrasound Computed Tomography," IEEE Transactions on Ultrasonics, Ferroelectrics and Frequency Control, vol. 62, pp. 475–493, 2015. [DOI] [PMC free article] [PubMed] [Google Scholar]
- [4].Sandhu GY, Li C, Roy O, Schmidt S, and Duric N, "Frequency domain ultrasound waveform tomography: breast imaging using a ring transducer," Phys. Med. Biol, vol. 60, pp. 5381–5398, 2015. [DOI] [PMC free article] [PubMed] [Google Scholar]
- [5].Natterer F and Wubbeling F, "A Propagation-Backpropagation Method for ultrasound tomography," Inverse Problems, vol. 11, pp. 1225–1232, 1995. [Google Scholar]
- [6].Waag R, Lin F, Varslot T, and Astheimer J, "An Eigenfunction Method for Reconstruction of Large-Scale and High-Contrast Objects," IEEE Transactions on Ultrasonics, Ferroelectrics, and Frequency Control, vol. 54, pp. 1316–1332, 2007. [DOI] [PubMed] [Google Scholar]
- [7].Jirik R, Peterlik I, Ruiter N, Fousek J, Dapp R, Zapf M, et al. , "Sound-Speed Image Reconstruction in Sparse-Aperture 3-D Ultrasound Transmission Tomography," IEEE Transactions on Ultrasonics, Ferroelectrics and Freq. Control, vol. 59, pp. 254–264, 2012. [DOI] [PubMed] [Google Scholar]
- [8].Marmarelis VZ, Kim T-S, and Shehada R, E. N., "High-resolution ultrasound transmission tomography," in SPIE 5035, Medical Imaging 2003: Ultrasonic Imaging and Signal Processing, 33, San Diego, CA, 2003. [Google Scholar]
- [9].Lavarello R and Oelze M, "A Study on the Reconstruction of Moderate Contrast Targets Using the Distorted Born Iterative Method," Trans. Ultrasonics Ferroelectrics and Freq. Control, vol. 55, pp. 112–124, 2007. [DOI] [PubMed] [Google Scholar]
- [10].Fatemi M and Greenleaf JF, "Vibro-acoustography: An imaging modality based on ultrasound-stimulated acoustic emission," Proc. Natl. Acad. Sci., U.S.A., pp. 6603–6608, 1999. [DOI] [PMC free article] [PubMed] [Google Scholar]
- [11].Wiskin J, Borup DT, Johnson SA, and Berggren M, "Non-linear inverse scattering: High resolution quantitative breast tissue tomography," J. Acoust. Soc. Am, pp. 3802–3813, 2012. [DOI] [PMC free article] [PubMed] [Google Scholar]
- [12].Wiskin J, Borup D, Callahan K, Parisky Y, Smith J, Andre M, et al. , "Inverse Scattering Results," in Acoustical Imaging 30, ed Dordrecht, Heidelberg, London, New York,: Springer, 2011, pp. 61–68. [Google Scholar]
- [13].Wiskin J, Borup D, Andre M, Johnson SA, Greenleaf J, Parisky Y, et al. , "Nonlinear inverse scattering in 3D: quantitative transmission algorithms, refraction corrected reflection, scanner design and clinical results," Journal of the Acoustical Society of America, vol. 133, p. 3229 2013. [Google Scholar]
- [14].Carson PL, Meyer C, Scherzinger A, and Oughton T, "Breast imaging in coronal planes with simultanious pulse echo and transmission ultrasound," Science, pp. 1141–1143, 1981. [DOI] [PubMed] [Google Scholar]
- [15].Li C, Duric N, Littrup P, and Huang L, "In Vivo Breast sound-speed imaging with ultrasound tomography," Ultrasound. Med. Biol, pp. 1615–1628, 2009. [DOI] [PMC free article] [PubMed] [Google Scholar]
- [16].Haddadin O and Ebbini E, "Imaging Strongly scattering media using a multiple frequency distorted Born iterative method," IEEE Trans. Ultrason., Ferroelct., Freq. Contr,, vol. 45, pp. 1485–1496, 1998. [DOI] [PubMed] [Google Scholar]
- [17].Wiskin J, Borup DT, Johnson SA, and Berggren M, "Non-linear inverse scattering: high resolution quantitative breast tissue tomography," J Acoust Soc Am, vol. 131, pp. 3802–13, May 2012. [DOI] [PMC free article] [PubMed] [Google Scholar]
- [18].Duric ND, Li C, Littrup P, Huang L, Glide-Hurst CK, Ramsa O, et al. , "Detection and characterization of breast masses with ultrasound tomography: clinical results," in SPIE 72651G, 2009, pp. 72651G_1–72651G_8. [Google Scholar]
- [19].Stavros T, Rapp CL, and Parker SH, Breast Ultrasound. Philadelphia, PA: Lippincott Williams and Wilkins, 2004. [Google Scholar]
- [20].Wiskin J, Borup D, and Johnson S, "Inverse Scattering Theory," in Acoustical Imaging 30, ed New York, Dordrecht, Heidelberg, London: Springer, 2011, pp. 54–59. [Google Scholar]
- [21].Huthwaite P and Simonetti F, "High-resolution imaging without iteration: A fast and robust method for breast ultrasound tomography," Journal of the Acoustical Society of America, vol. 130, pp. 1721–1734, 2011. [DOI] [PubMed] [Google Scholar]
- [22].Trefethen LN and Halpern L, "Wide-angle one way wave equations," J. Acoustical Society of America, vol. 84, pp. 1397–1404, 1988. [DOI] [PubMed] [Google Scholar]
- [23].Tappert FD, "The parabolic equation method," in Wave propagation and underwater acoustics, Lecture Notes in Physics 70, ed New York: Springer-Verlag, 1977. [Google Scholar]
- [24].Bamber JC, "Ultrasonic Properties of tissues," inUltrasound in Medcine, ed Bristol and Philadelphia: Institute of Physics Publishing, 1998, pp. 57–88. [Google Scholar]
- [25].Lenox M, Wiskin J, Lewis M, Darrouzet S, Borup D, and Hsieh S, "Imaging Performance of Quantitative Transmission Ultrasound," International Journal of Biomedical Imaging, vol. 2015, 2015. [DOI] [PMC free article] [PubMed] [Google Scholar]
- [26].Wiskin J, Borup DT, Johnson SA, and Berggren M, "Non-linear inverse scattering: High resolution quantitative breast tissue tomography," The Journal of the Acoustical Society of America, vol. 131, pp. 3802–3813, 2012. [DOI] [PMC free article] [PubMed] [Google Scholar]
- [27].Del Grosso VA and Mader CW, "Speed of Sound in Pure Water," Journ. Acoust. Soc. Am, vol. 52, pp. 1442–1446, 1972. [Google Scholar]
- [28].Chan TF and Tai X-C, "Level set and total variation regularization for elliptic inverse problems with discontinuous coefficients," Journal of Computational Physics, vol. 193, pp. 40–66, 1/January/ 2004. [Google Scholar]
- [29].Klock J, Iuanow E, Malik B, Obuchowski N, Wiskin J, and Lenox M, "Anatomy-Correlated Breast Imaging and Visual Grading Analysis Using Quantitative Transmission (QT) Ultrasound," International Journal of Biomedical Imaging, vol. 2016, pp. 1–9, 2016. [DOI] [PMC free article] [PubMed] [Google Scholar]
- [30].Lenox MW, Wiskin J, Lewis MA, Darrouzet S, Borup D, and Hsieh S, "Imaging Performance of Quantitative Transmission Ultrasound," Int J Biomed Imaging, vol. 2015, p. 454028, 2015. [DOI] [PMC free article] [PubMed] [Google Scholar]
- [31].Duncan DP, Astheimer J, and Waag R, "Scattering calculation and image reconstruction using elevation-focused beams," Journal of the Acoustical Society of America, vol. 125, pp. 3101–3119, 2009. [DOI] [PMC free article] [PubMed] [Google Scholar]
- [32].Lavarello RJ and Oelze M, "Tomographic reconstruction of Three Dimensional volumes Using the Distorted Born Approximation," IEEE Transactions on Medical Imaging, vol. 28, pp. 1643–1653, 2009. [DOI] [PubMed] [Google Scholar]
- [33].Mast TD, "Empirical relationships between acoustic parameters in human soft tissues," J. Acoust. Soc. Am, pp. 37–42, 2000. [Google Scholar]
- [34].Klock JC, Iuanow E, Malik B, Obuchowski NA, Wiskin J, and Lenox M, "Anatomy-Correlated Breast Imaging and Visual Grading Analysis Using Quantitative Transmission Ultrasound," International Journal of Biomedical Imaging, vol. 2016, p. 9, 2016. [DOI] [PMC free article] [PubMed] [Google Scholar]
- [35].Smith K, "Clinical Product Development Studying the QT Ultrasound Breast Scanner with Volunteer Subjects," NIH, Ed., ed. clinicaltrials.gov: NIH, 2016. [Google Scholar]
- [36].Smith K, "Non-Inferiority Quantitative Transmission Ultrasound Case Collection Study (QTUS)," 2014-2017. [Google Scholar]
Associated Data
This section collects any data citations, data availability statements, or supplementary materials included in this article.


