

Summary
High-grade gliomas (HGGs) are the most aggressive and invasive primary brain tumors. The platelet-derived growth factor (PDGF) signaling pathway drives HGG progression, and enhanced expression of PDGF receptors (PDGFRs) is a well-established aberration in a subset of glioblastomas (GBMs). PDGFRA is expressed in glioma cells, whereas PDGFRB is mostly restricted to the glioma-associated stroma. Here we show that the spatial location of TAMMs correlates with the expansion of a subset of tumor cells that have acquired expression of PDGFRB in both mouse and human low-grade glioma and HCGs. Furthermore, M2-polarized microglia but not bone marrow (BM)-derived macrophages (BMDMs) induced PDGFRB expression in glioma cells and stimulated their migratory capacity. These findings illustrate a heterotypic cross-talk between microglia and glioma cells that may enhance the migratory and invasive capacity of the latter by inducing PDGFRB.
Subject Areas: Pathophysiology, Molecular Mechanism of Behavior, Immunology, Cancer
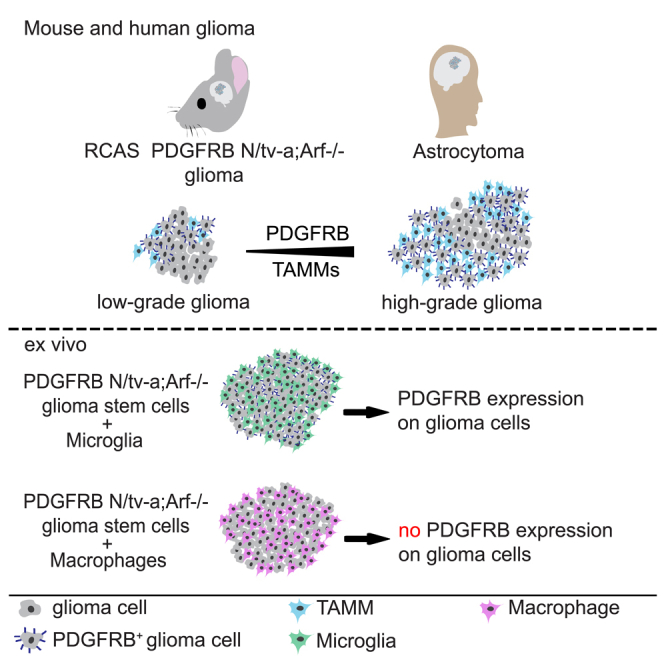
Graphical Abstract
Highlights
-
•
PDGFRB+ glioma cells are in physical contact with IBA1+ TAMMs in mouse and human glioma
-
•
Aggregation of PDGFRB+ glioma cells correlated with the accumulation of IBA1+ TAMMs
-
•
Microglia but not bone marrow-derived macrophages induced PDGFRB expression in vitro
-
•
M2-polarized microglia stimulated glioma cell migration dependent on PDGFRB
Pathophysiology; Molecular Mechanism of Behavior; Immunology; Cancer
Introduction
Gliomas are the most common primary malignant tumors of the central nervous system (CNS) with different grades of malignancy where grade II is the lowest and grade IV is the highest (Hoshide and Jandial, 2016). The growth pattern of gliomas is characterized by diffuse tumor growth and tumor cell invasion resulting in tumor microsatellites growing far away from the main tumor mass (Hambardzumyan and Bergers, 2015). Diffuse (grade II) and anaplastic (grade III) gliomas are infiltrative neoplasms that most often arise in cerebral hemispheres of adults and include astrocytomas and oligodendrogliomas (Louis et al., 2016). Grade II and III astrocytomas are generally characterized by the IDH1-R132H mutation, whereas oligodendrogliomas are IDH1 mutated and 1p and 19q co-deleted (Hoshide and Jandial, 2016). The latter show better responses to radiochemotherapy and are associated with longer survival than IDH1 wild-type diffuse gliomas or grade IV gliomas denoted glioblastomas (GBMs) (Cancer Genome Atlas Research Network et al., 2015, Eckel-Passow et al., 2015, van den Bent et al., 2013). Conventional therapy for GBMs includes maximal safe surgical resection followed by radiation with concomitant and adjuvant temozolomide treatment that prolongs survival but is not curative (Reifenberger et al., 2016). There is thus an immediate need to develop alternative therapies for GBMs.
There are several cell types in the tumor microenvironment that contribute to glioma malignancy, e.g., astrocytes, endothelial cells, pericytes, and immune cells, including tumor-associated macrophages and microglia (TAMMs) (Quail and Joyce, 2017). Interestingly, almost half of the tumor mass may consist of TAMMs in both murine as well as human gliomas (Hambardzumyan et al., 2016), and the accumulation of TAMMs is associated with poor clinical outcome in gliomas (Chen et al., 2017, Sorensen et al., 2017). In platelet-derived growth factor (PDGFB)-driven glioma the majority of TAMMs is of a pro-tumoral phenotype, and the reprogramming of these TAMMs toward an anti-tumoral phenotype hampers PDGFB-driven glioma growth (Pyonteck et al., 2013, Quail et al., 2016).
PDGFB can bind to both PDGFRA and PDGFRB and is known to play multiple roles in tumor development, both in the tumor cells themselves and within the microenvironment (Kazlauskas, 2017). However, in the RCAS-induced gliomas, it has been postulated that PDGFB drives tumor initiation and progression mainly by activating PDGFRA on nestin+ glial cells (Burton et al., 2001, Holland, 2000, Uhrbom et al., 2002). In concordance, large-scale integrated molecular analyses of GBMs have shown that a subset of these tumors are driven by activation of the PDGFRA signaling pathway (Brennan et al., 2013, Verhaak and Valk, 2010), and this has also been confirmed by computational and experimental modeling (Ozawa et al., 2014). The expression of PDGFRB on tumor cells has been less studied, although one study reports that PDGFRB can be expressed in cultured patient-derived GBM cells, particularly in the cancer stem-cell-like population (Kim et al., 2012).
Herein we demonstrated that PDGFRB was expressed on glioma cells (GCs) in mouse and human gliomas in proximity to TAMMs. Both PDGFRB expression on GCs and TAMM accumulation were significantly increased in high-grade gliomas (HGGs) compared with low-grade gliomas (LGGs). Mechanistic studies showed that M2-polarized microglia, but not M2-polarizied bone marrow-derived macrophages (BMDMs), induced GCs to acquire PDGFRB expression and augmented their migratory capacity. In summary, we propose a new mechanism whereby GC migratory behavior may be modulated.
Methods can be found in Transparent Methods in the Supplemental Information.
Results
PDGFB-Driven Gliomas in the N/tv-a;Arf−/− Mouse Model Display Necrosis, Hypoxia, and Vessel Hyperproliferation Similarly to Human Gliomas
Studies in transgenic mice indicate that gliomas can arise from a range of cell types including neural stem cells, astrocytes, oligodendrocytes, or glial progenitor cells (Jiang et al., 2017, Lindberg et al., 2009). We investigated the role of TAMMs in the N/tv-a;Arf−/− mouse model in which the retrovirus will specifically transform glial stem and progenitor cells resulting in glioma development between 1 to 3 months (Karrlander et al., 2009, Tchougounova et al., 2007). According to histopathological characteristics (evaluated by neuropathologist H. Miletic) the tumors were divided into human grade II-, grade III- and grade IV-like gliomas, where grade IV-like gliomas displayed necrotic areas (Figure 1A). GCs and glioblastoma stem cells (GSCs) in particular express OLIG2 (Lu et al., 2016), which in the normal brain is restricted to oligodendroglial cells and their progenitors (Mitew et al., 2014). Gliomas that display OLIG2+GCs that have acquired the expression of the glial fibrillary acidic protein (GFAP), which defines differentiated astrocytes, are generally classified as astrocytomas (Moeton et al., 2014), whereas OLIG2+GCs that are negative for GFAP are typically classified as oligodendrogliomas that can never develop into a grade IV glioma (Hoshide and Jandial, 2016). Importantly, all the PDGFB-driven grade II-, grade III-, and grade IV-like gliomas displayed OLIG2+GFAP+GCs (Figure 1B), indicating that these tumors are low- or high-grade astrocytomas rather than oligodendrogliomas (Skalli et al., 2013).
Figure 1.

PDGFB-Driven Gliomas in the N/tv-a;Arf−/− Mouse Model Display Necrosis and Decreased Vessel Perfusion
(A) Images display tumor sections immunostained with H&E. Scale bars, 200 μm.
(B) Glioma sections were immunostained for OLIG2 (green) and GFAP (red). Scale bars, 50 μm.
(C–G) (C) Images display tumors perfused with fluorescein isothiocyanate-conjugated lectin (green) and immunostained for the endothelial marker CD31 (blue). Graphs display (D) vessel area, (E) vessel density, (F) area of perfused vessels, and (G) % number of perfused vessels. (n = 3–5). Scale bars, 100 μm. Statistical analysis: one-way ANOVA was used; *p < 0.05, **p < 0.01, ***p < 0.001; * indicates significance compared with grade II-like tumors; #p < 0.05; # indicates significance between grade III- and grade IV-like tumors.
Tumor necrosis is associated with poorly perfused abnormal vessels with proliferative endothelial cells, resulting in an inadequate supply of the tumor with oxygen and nutrients (Jain, 2014). Increased vessel area, decreased vessel perfusion, and hypoxia generally indicate vessel abnormalization that correlates with tumor malignancy (Mazzone et al., 2009, Rolny et al., 2011). Hence, we next performed morphometric analysis for CD31 (endothelial cell marker) and fluorescein isothiocyanate-conjugated lectin, which detects perfused vessels (Figure 1C), or pimonidazole hydrochloride staining, which identifies hypoxic areas (Figure 2A). Both vessel area (Figures 1C and 1D) and vessel density (Figures 1C and 1E) were evidently increased between grade II- and grade III-like gliomas, and between grade II- and grade IV-like gliomas. Consistently, vessel perfusion (Figures 1C, 1F, and 1G) was markedly decreased, whereas hypoxia (Figures 2A and 2B) was increased in grade III- and grade IV-like gliomas compared with grade II-like gliomas. These features suggested that most of the vessels in the grade II-like gliomas are co-opted, non-angiogenic vessels (Holash et al., 1999). In corroboration, endothelial cells in grade II-like gliomas displayed significantly less proliferation compared with grade III- and grade IV-like gliomas as visualized by staining of tumor sections for podocalyxin and Ki67 (Figures 2C and 2D).
Figure 2.

PDGFB-Driven Gliomas in the N/tv-a;Arf−/− Mouse Model Display Hypoxia and Vessel Hyperproliferation
(A and B) (A) Glioma sections were immunostained for CD31 (blue), fluorescein isothiocyanate (FITC)-conjugated lectin (green), and the hypoxic marker pimonidazole (PIMO; red). (B) Graph shows morphometric analysis of hypoxic areas (n = 3–5). Scale bars, 100 μm.
(C and D) (C) Glioma sections were immunostained for podocalyxin (green) and Ki67 (red). (D) Graph depicts quantification of podocalyxin+Ki67+ vessels (n = 3). Scale bars, 100 μm.
(E and F) (E) Glioma sections were immunostained for CD31 (blue), FITC-conjugated lectin (green), and the pericyte marker α-SMA (red). (F) Graph displays quantification of α-SMA (n = 3–5). Scale bars, 100 μm.
(G and H) (G) Glioma sections were immunostained for OLIG2 (blue), FITC-conjugated lectin (green), and α-SMA (red). (H) Graph shows analysis of α-SMA+ sheets associated with vessels. Scale bars, 100 (left panel) and 50 (right panel) μm.
(I) Glioma sections were immunostained for podocalyxin (blue), microglia marker IBA1 (green), and α-SMA (red). Scale bars, 100 (left panel) and 50 μm (right panel).
Statistical analysis: one-way ANOVA (A–F) and student's t test (G and H) were used: *p < 0.05, **p < 0.01, ***p < 0.001, ****p < 0.0001; * indicates significance (A–F) compared with grade II-like tumors and (H) between α-SMA+ sheets associated and non-associated with vessels; #p < 0.05; # indicates significance between grade III- and grade IV-like tumors.
Displacement of pericytes covering the tumor vessels is yet another hallmark of vessel abnormalization and dysfunctionality (Baluk et al., 2003, Mazzone et al., 2009). Tumor sections were therefore stained for OLIG2, CD31, and the pericyte marker α-smooth muscle actin (α-SMA). The accumulation of α-SMA+ cells was profoundly increased with the degree of malignancy (Figures 2E and 2F). Surprisingly, the majority of the α-SMA+ cells were not found in conjugation with perfused vessels (Figures 2G and 2H) and were instead in close association with IBA1+ TAMMs (Figure 2I).
Glioma Cells Express Pericyte Markers in Mouse and Human Gliomas
To investigate whether the α-SMA+ cells were indeed bona fide pericytes, grade IV-like gliomas were stained for the pericyte markers PDGFRB and NG2 (that also stains oligodendrocyte progenitor cells). The majority of the α-SMA+ cells that appeared in sheets did indeed express PDGFRB (Figure 3A) and NG2 (Figure 3B), and a portion of these cells also expressed the mesenchymal marker CD44 (Figure 3C), but were negative for GC and GSC markers including SOX2 (Figure 3D), OLIG2 (Figure 3E), and GFAP (Figure 3F). Intriguingly, α-SMA+ cells that appeared as round cells did indeed express GC and GSC markers including SOX2 (Figure 3D), OLIG2 (Figure 3E), and GFAP (Figure 3F). Importantly, these α-SMA+ cells also expressed the hemagglutinin (HA) tag, which can only be expressed by the initial RCAS-infected nestin-expressing glial cells (Figure 3G). The round α-SMA+SOX2+, α-SMA+OLIG2+, α-SMA+GFAP+, and α-SMA+HA+ cells accounted for ∼20% of the total α-SMA population in grade IV-like gliomas (Figure 3H).
Figure 3.

Glioma Cells Express Pericyte Markers in Mouse Gliomas
(A–H) Mouse glioma sections were immunostained for (A) α-SMA (red) and the pericyte marker PDGFRB (green), (B) α-SMA (red) and the pericyte and oligodendrocyte marker NG2 (blue), (C) α-SMA (red) and the mesenchymal and stem cell marker CD44 (green), (D) α-SMA (red) and the GSC marker SOX2 (green), (E) α-SMA (red) and the oligodendrocyte marker OLIG2 (green), (F) α-SMA (red) and the astrocyte marker GFAP (green), and (G) α-SMA (red) and the HA tag expressed by PDGF-B-transformed cells (green). Left panels show α-SMA+ sheets, whereas right panels display round α-SMA+ cells. Scale bars, 100 (left panel) and 50 (right panel) μm. (H) Graph displays quantification of HA+, OLIG2+, SOX2+, and GFAP+ cells out of α-SMA+ cells (n = 3).
Statistical analysis: one-way ANOVA was used.
Spatial Location of αSMA+PDGFRB+GCs in Mouse and Human Gliomas
It has previously been proposed that GSCs can give rise to perivascular pericytes (Cheng et al., 2013) and are located in the vicinity of tumor vessels. However, here we find that α-SMA+ OLIG2+ (Figure 4A), α-SMA+SOX2+ (Figure 4B), and α-SMA+PDGFRB+ cells (Figure 4C) are scattered throughout the tumor mass and are not located perivascularly. Our observation that α-SMA+GCs rarely attached to vessels led us to investigate if these α-SMA+GCs were associated with other types of stromal cells such as TAMMs that accumulate in HGGs (Pyonteck et al., 2013, Quail et al., 2016). Indeed, IBA1+ TAMMs were closely associated with α-SMA+HA+ (Figure 4D) and PDGFRB+HA+ (Figure 4E) cells in mouse HGGs. Of note, α-SMA+IDH1-R132H+ cells were also in close proximity to IBA1+ TAMMs in human HGGs (Figure S1). We then speculated that PDGFRB+GCs might correlate to the accumulation of TAMMs in mouse and human gliomas. Indeed, PDGFRB+HA+ (Figures 5A–5E), PDGFRB+IDH1-R132H+, and PDGFRB+GFAP+ cells correlated to TAMM accumulation (Figures 5F–5J). In fact, ∼70% of PDGFRB+GCs in grade III- and grade IV-like mouse gliomas (Figure 5E) and human GBMs (Figure 5J) were in physical contact with IBA1+ TAMMs. It has recently been revealed that the transcription factor Sall1 is preferentially expressed by microglia and not macrophages (Buttgereit et al., 2016). In fact, the majority of IBA1+ TAMMs expressed Sall1 (Figure S2A) and not CD49d (Figure S2B), which is preferentially expressed by macrophages, indicating that these cells were microglia and not macrophages. In summary, the spatial location of TAMM accumulation strongly correlated with α-SMA+ and PDGFRB+GCs.
Figure 4.

Spatial Location of α-SMA+SOX2+, α-SMA+OLIG2+, and α-SMA+PDGFRB+ GCs in Mouse Gliomas
(A–C) Mouse glioma sections were immunostained for (A) OLIG2 (blue), α-SMA (red), and podocalyxin (green); (B) SOX2 (blue), α-SMA (red), and podocalyxin (green); and (C) PDGFRB (blue), α-SMA (red), and podocalyxin (green). Scale bars, 100 μm.
(D) Mouse grade IV-like glioma sections were immunostained for HA tag (expressed by PDGFB-transformed cells; blue), α-SMA (red), and IBA1 (green). Scale bars, 50 μm.
(E) Mouse grade IV-like glioma sections were immunostained for HA tag (blue), PDGFRB (red), and IBA1 (green). Scale bars, 50 μm.
See also Figure S1.
Figure 5.

Glioma Cells Express PDGFRB and Correlate with IBA1+ TAMMs in Mouse and Human Gliomas
(A–E) (A) Mouse glioma sections were immunostained for H&E, HA tag (green/blue), PDGFRB (red), and IBA1 (green). Graphs display (B) number of PDGFRB+HA+ cells out of HA+ cells, (C) area of IBA1+ cells, (D) Pearson's correlation between PDGFRB+ cells versus area of IBA1, and (E) number of PDGFRB+HA+ cells in contact with IBA1+ cells (n = 3–5). Scale bars 200 (left panel), 50 (middle panel), and 20 (far right panel) μm.
(F–J) (F) Human glioma sections were immunostained for IDH1-R132H or GFAP (blue), PDGFRB (red), and IBA1 (green). Graphs depict (G) number of PDGFRB+IDH1-R132H+ cells or PDGFRB+GFAP+ cells out of IDH1-R132H+ or GFAP+ cells, (H) area of IBA1+ cells, (I) Pearson's correlation between PDGFRB+ cells versus area of IBA1, and (J) number of PDGFRB+IDH1-R132H+ or PDGFRB+GFAP+ cells in contact with IBA1+ cells (n = 5–6). Scale bars, 50 (left panel) and 20 (far right panel) μm.
Statistical analysis: one-way ANOVA (B, C, E, G, H, and J) and Pearson's correlation (D and I) were used: *p < 0.05, ***p < 0.001, ****p < 0.0001; * indicates significance compared with grade II-like tumors; ###p < 0.001, ####p < 0.0001; # indicates significance between grade III- and grade IV-like tumors. See also Figure S2.
TAMMs Induce Mouse Glioma Cells to Express PDGFRB
We hypothesized that pro-tumoral TAMMs could drive tumor cells to express pdgfrb due to their spatial localization. Thus, microglia derived from adult mice polarized to an M1-phenotype (lipopolysaccharide [LPS] and interferon [IFN]-γ) or an M2 phenotype (interleukin [IL]-4, IL-10, and transforming growth factor [TGF]-β) in vitro were co-cultured with GFP+GSCs derived from grade IV-like PDGFB-induced tumors in N/tv-a;Arf−/- mice. As expected, qPCR analysis showed that M1-polarized microglia displayed high gene expression levels of chemokine (C-X-C motif) ligand (cxcl)9, cxcl10, cxcl11, il-6, and il-1β, whereas M2-polarized microglia showed high expression levels of arginase 1, mrc1, and ym1 (Figure 6A). Interestingly, GFP+GSCs flow sorted from the co-culture system displayed induced levels of pdgfrb (Figure 6B) and increased levels of α-sma transcription levels (30-fold; Figure 6C) in the presence of M2-polarized microglia. Surprisingly, co-culture with M1-polarized microglia also induced pdgfrb expression (Figure 6B) and increased α-sma levels (Figure 6C), but significantly less compared with M2 microglia. Importantly, basal expression of pdgfrb was undetectable. Notably, pdgfra was not affected by either M1- or M2-polarized microglia (Figure 6D).
Figure 6.

TAMMs Induce Mouse Glioma Cells to Express PDGFRB
(A) Microglia were polarized to either an M1 or M2 phenotype. Graph shows gene expression levels of cxcl9, cxcl10, cxcl11, il-6, il-1b, arginase1, mrc1, and ym1 analyzed by qRT-PCR (n = 3).
(B–F) GFP+GSCs were co-cultured with M1- or M2-polarized microglia. Graphs depict qRT-PCR analysis of gene expression levels of flow-sorted tumor cells for (B) pdgfrb, (C) α-sma, (D) pdgfra, (E) fgfr and igf-1r, and (F) egfr and hgfr (n = 3).
(G) GFP+GSCs were cultured with M0 (not polarized)-, M1- or M2-like microglia conditioned media. Graph displays gene expression levels for α-sma quantified by quantitative RT-PCR (n = 3).
(H) GFP+GSCs were co-cultured with M1- or M2-polarized BMDMs. Graph shows qRT-PCR analysis of gene expression levels of flow-sorted tumor cells for α-sma (n = 3).
(I–K) GFP+GSCs were co-cultured with M1- or M2-polarized microglia. Graphs depict quantitative RT-PCR analysis of gene expression levels of flow-sorted tumor cells for (I) nestin, olig2, and sox2; (J) cnp, ng2, and hes1; and (K) gfap (n = 3).
(L and M) GFP+GSCs were co-cultured with M1- or M2-polarized microglia, and migrated tumor cells were stained for the OLIG2 marker. Graphs display (L) migrated tumor cells (n = 3) and (M) migrated tumor cells with isotype control or neutralizing PDGFRB antibody (n = 3).
Statistical analysis: Student's t test (A) and one-way ANOVA (B–M) were used: *p < 0.05, **p < 0.01, ***p < 0.001; * indicates significance (B–L) compared with tumor cells alone, and (M) compared with tumor cells without PDGFRB blockage; #p < 0.05, ##p < 0.01, ###p < 0.001, ####p < 0.0001; # indicates significance between (A) M1-like and M2-like microglia and (B–L) tumor cells co-cultured with M1 microglia compared with M2 microglia and (M) tumor cells co-cultured with M2-like microglia without PDGFRB blockage compared with PDGFRB blockage. All data represent one out of three independent experiments and are presented as the mean +SD. See also Table S1.
As GCs have been shown to express different tyrosine kinases, we next examined if M2-polarized microglia could alter the expression of a variety of tyrosine kinase receptors, including epidermal growth factor receptor (egfr), fibroblast growth factor receptor (fgfr), hepatocyte growth factor receptor (hgfr), or insulin-like growth factor-1 receptor (igf-1r). In fact, M1- and M2-polarized microglia did not affect the expression of fgfr, igf-1r (Figure 6E), or hgfr (Figure 6F). Even though M1- and M2-polarized microglia could induce egfr expression in GCs, the expression levels were about 100-fold less compared with that of pdgfrb (Figure 6F). We further explored if the expression of pdgfrb in GCs could also be modulated by microglia-secreted factors. GCs were thus cultured with control medium or conditioned medium from M1- or M2-polarized microglia. Interestingly, neither pdgfrb nor α-sma expression could be either induced or increased, respectively, in the presence of conditioned medium from either M1- or M2-polarized microglia (Figure 6G).
Recent studies report that microglia are not only ontologically different from BMDMs (Gomez Perdiguero et al., 2015) but also exhibit distinct activation states based on diverse gene and surface marker expression, implying different functions compared with BMDMs (Bowman et al., 2016). We therefore investigated if BMDMs were capable of inducing the expression of pdgfrb in GCs by co-culturing GFP+GSCs with either M1-BMDMs (treated with LPS and IFN-γ) or M2-polarized BMDMs (treated with IL-4, IL-10, and TGF-β). These BMDMs displayed the same repertoire of cytokines as M1- and M2-polarized microglia. Surprisingly, neither M1- nor M2-polarized BMDMs could induce pdgfrb or increase the α-sma expression in GCs (Figure 6H). Intriguingly, preconditioning of BMDMs with medium from primary microglia culture did not induce pdgfrb or increase α-sma expression in GCs either (data not shown).
In summary, only cell-to-cell contact with microglia could induce pdgfrb expression in GCs. We further explored if M1- or M2-polarized microglial cell-to-cell contact with GSCs could further alter their expression of glial, stem, and progenitor cell markers. Surprisingly, most glial stem cell and progenitor cell markers including nestin, olig2, sox2 (Figure 6I), ng2, and hes1 (Figure 6J) were not further modified by the presence of M1- or M2-polarized microglia. Interestingly, the marker for late oligodendrocyte precursor cells cnp (Lindberg et al., 2009) (Figure 6J) was markedly decreased by both M1- and M2-polarized microglia, whereas the astrocytoma marker gfap (Figure 6K) was markedly increased by M2-polarized microglia. These findings indicate that regardless of the polarization state, microglia did not affect an overall increase in stem and progenitor cell markers.
In agreement with the notion that the PDGFRB signaling pathway is a key modulator in regulating cell migration (Kazlauskas, 2017), we explored if M1- and M2-polarized microglia could affect the migration of cultured GCs. GFP+GSCs were therefore co-cultured with M1- or M2-polarized microglia before subjecting them to a Boyden chamber. Intriguingly, M2-polarized microglia fueled the migratory capacity of GCs (Figure 6L), whereas M1-polarized microglia significantly suppressed GC migration (Figure 6L). Blocking PDGFRB revoked the effect of M2-polarized microglia on tumor cell migration but had no effect on the M1-polarized-microglia-mediated inhibition of GC migration (Figure 6M). In summary, M2-polarized-microglia-stimulated migration of GCs was mediated by PDGFRB.
Discussion
Herein we show that the presence of PDGFRB+GCs and α-SMA+GCs in mouse and human HGGs was tightly interlinked with the number of and physical proximity to TAMMs. Accordingly, both mouse and human LGGs displayed low frequency of TAMMs and PDGFRB+GCs, whereas grade III- and grade IV-like murine gliomas and human GBMs displayed high frequency of TAMMs and PDGFRB+GCs. Human grade III astrocytomas displayed a large heterogeneity in the accumulation of TAMMs and, therefore the frequency of PDGFRB+GCs also varied accordingly. TAMMs consist of a mixed population including tissue-resident microglia and macrophages that are ontogenetically different (Bowman et al., 2016). Microglia develop from embryonic yolk sac progenitor cells (Gomez Perdiguero et al., 2015) and only populate the brain during development. Thus, during adulthood microglia are maintained through survival and local proliferation (Ajami et al., 2007, Gomez Perdiguero et al., 2015). Conversely, macrophages develop from hematopoietic precursors during embryonic development and establish stable resident populations in extracranial tissues (Goldmann et al., 2016). The macrophages that populate GBMs are recruited to the tumor from the bone marrow (Quail and Joyce, 2017). The different origins of BMDMs and tissue-resident microglia result from distinct transcriptional and chromatin states, and the expression of markers in these cell populations may reflect different functions of tissue-resident microglia and BMDMs in GBMs (Bowman et al., 2016). Macrophages preferentially express CD49d (Bowman et al., 2016), whereas microglia show expression of Sall1 (Buttgereit et al., 2016). Interestingly, the majority of IBA1+ cells expressed Sall1 in mouse gliomas, pointing out that these cells were microglia and not macrophages. The induced and increased expression of PDGFRB and α-SMA in GCs, respectively, was ascribed to cell-to-cell contact with M2-polarized microglia but not with M2-polarized BMDMs.
Interestingly, in vitro co-culture of GSCs and M1- or M2-polarized microglia did not further augment stem cell marker expression, but instead downregulated oligodendrocyte progenitor marker cnp, whereas the astrocytoma marker gfap was markedly increased by M2-polarized microglia. GFAP is the hallmark in intermediate filaments and has been implicated in regulating the migratory capacity of GCs (Moeton et al., 2014). Hence, M2-polarized microglia induce not only high expression of PDGFRB but also high expression of GFAP. This in concert could possibly promote tumor cel0l migratory capacity. We speculate that microglia-GC-to-cell contact regulates PDGFRB transcription affecting any of the known transcription factors (NF-Y or Sp1) that promote PDGFRB transcription (Ishisaki et al., 1997, Molander et al., 2001). The underlying mechanisms whereby PDGFRB transcription is regulated by microglia deserve future investigations but lie outside the scope of the present investigation. In summary, these findings indicate that microglia and BMDM may affect GC behavior differently and deserve further investigation.
Limitations of the Study
Currently, evidence is increasing about differences in function between microglia and macrophages. In concordance with our study, we show that microglia but not macrophages induce PDGFRB expression in GCs and thereby increase their migratory capacity. However, due to limitations of antibody combinations, it was not possible to use the two markers Sall1 and CD49d in the same immunofluorescence staining to distinguish between microglia and macrophages that are in direct contact with PDGFRB-expressing GCs. Hence elaborate lineage-tracing animal experiments are further needed to establish the differential role of macrophages and microglia in driving PDGFRB expression in vivo.
Methods
All methods can be found in the accompanying Transparent Methods supplemental file.
Acknowledgments
The authors thank for technical support of histology lab service the CCK core facility. This study was supported by the Swedish Cancer Society (2016/825), Swedish Cancer Society (CAN 2016/791), Swedish Scientific Council (2013-5982), and Wallenberg Foundation to C.R. and T.W. was supported by KI PhD Foundation. X.-M.Z. was supported by Swedish Childhood Cancer Foundation (NCP2015-0064, NC2014-0046, PR2014-0154). Swedish Cancer Society (CAN 2016/791) and the Wallenberg foundation to J.B.
Author Contributions
Methodology, T.W. and C.R.; Investigation, T.W., X-M.Z., M.W., S.B., A-L. J., C.S., and H.M.; Resources, Y.J., J.B., E.C.H., P.Ø. E., J.A., F.J.S., L.U., and R.A.H and E.C.H and L.W.; Writing – Original Draft, T.W., M.W., and C.R.; Writing – Review & Editing, T.W., X.-M.Z., M.W., A-L.J., H.M., J.A., F.J.S., L.U., R.A.H., and C.R.; Supervision, C.R.; Project Administration, C.R.
Declaration of Interests
The authors declare no competing interests.
Published: November 30, 2018
Footnotes
Supplemental Information includes Transparent Methods, two figures, and one table and can be found with this article online at https://doi.org/10.1016/j.isci.2018.10.011.
Supporting Citations
Criscuoli et al. (2005); Dreher et al. (2006); Holland and Varmus (1998); Jiang et al. (2011); Wallerius et al. (2016); Zhang et al. (2014).
Supplemental Information
References
- Ajami B., Bennett J.L., Krieger C., Tetzlaff W., Rossi F.M. Local self-renewal can sustain CNS microglia maintenance and function throughout adult life. Nat. Neurosci. 2007;10:1538–1543. doi: 10.1038/nn2014. [DOI] [PubMed] [Google Scholar]
- Baluk P., Morikawa S., Haskell A., Mancuso M., McDonald D.M. Abnormalities of basement membrane on blood vessels and endothelial sprouts in tumors. Am. J. Pathol. 2003;163:1801–1815. doi: 10.1016/S0002-9440(10)63540-7. [DOI] [PMC free article] [PubMed] [Google Scholar]
- Bowman R.L., Klemm F., Akkari L., Pyonteck S.M., Sevenich L., Quail D.F., Dhara S., Simpson K., Gardner E.E., Iacobuzio-Donahue C.A. Macrophage ontogeny underlies differences in tumor-specific education in brain malignancies. Cell Rep. 2016;17:2445–2459. doi: 10.1016/j.celrep.2016.10.052. [DOI] [PMC free article] [PubMed] [Google Scholar]
- Brennan C.W., Verhaak R.G., McKenna A., Campos B., Noushmehr H., Salama S.R., Zheng S., Chakravarty D., Sanborn J.Z., Berman S.H. The somatic genomic landscape of glioblastoma. Cell. 2013;155:462–477. doi: 10.1016/j.cell.2013.09.034. [DOI] [PMC free article] [PubMed] [Google Scholar]
- Burton J.L., Madsen S.A., Yao J., Sipkovsky S.S., Coussens P.M. An immunogenomics approach to understanding periparturient immunosuppression and mastitis susceptibility in dairy cows. Acta Vet. Scand. 2001;42:407–424. [PubMed] [Google Scholar]
- Buttgereit A., Lelios I., Yu X., Vrohlings M., Krakoski N.R., Gautier E.L., Nishinakamura R., Becher B., Greter M. Sall1 is a transcriptional regulator defining microglia identity and function. Nat. Immunol. 2016;17:1397–1406. doi: 10.1038/ni.3585. [DOI] [PubMed] [Google Scholar]
- Cancer Genome Atlas Research Network. Brat D.J., Verhaak R.G., Aldape K.D., Yung W.K., Salama S.R., Cooper L.A., Rheinbay E., Miller C.R., Vitucci M. Comprehensive, integrative genomic analysis of diffuse lower-grade gliomas. N. Engl. J. Med. 2015;372:2481–2498. doi: 10.1056/NEJMoa1402121. [DOI] [PMC free article] [PubMed] [Google Scholar]
- Chen Z., Feng X., Herting C.J., Garcia V.A., Nie K., Pong W.W., Rasmussen R., Dwivedi B., Seby S., Wolf S.A. Cellular and molecular identity of tumor-associated macrophages in glioblastoma. Cancer Res. 2017;77:2266–2278. doi: 10.1158/0008-5472.CAN-16-2310. [DOI] [PMC free article] [PubMed] [Google Scholar]
- Cheng L., Huang Z., Zhou W., Wu Q., Donnola S., Liu J.K., Fang X., Sloan A.E., Mao Y., Lathia J.D. Glioblastoma stem cells generate vascular pericytes to support vessel function and tumor growth. Cell. 2013;153:139–152. doi: 10.1016/j.cell.2013.02.021. [DOI] [PMC free article] [PubMed] [Google Scholar]
- Criscuoli M.L., Nguyen M., Eliceiri B.P. Tumor metastasis but not tumor growth is dependent on Src-mediated vascular permeability. Blood. 2005;105:1508–1514. doi: 10.1182/blood-2004-06-2246. [DOI] [PubMed] [Google Scholar]
- Dreher M.R., Liu W., Michelich C.R., Dewhirst M.W., Yuan F., Chilkoti A. Tumor vascular permeability, accumulation, and penetration of macromolecular drug carriers. J. Natl. Cancer Inst. 2006;98:335–344. doi: 10.1093/jnci/djj070. [DOI] [PubMed] [Google Scholar]
- Eckel-Passow J.E., Lachance D.H., Molinaro A.M., Walsh K.M., Decker P.A., Sicotte H., Pekmezci M., Rice T., Kosel M.L., Smirnov I.V. Glioma groups based on 1p/19q, IDH, and TERT promoter mutations in tumors. N. Engl. J. Med. 2015;372:2499–2508. doi: 10.1056/NEJMoa1407279. [DOI] [PMC free article] [PubMed] [Google Scholar]
- Goldmann T., Wieghofer P., Jordao M.J., Prutek F., Hagemeyer N., Frenzel K., Amann L., Staszewski O., Kierdorf K., Krueger M. Origin, fate and dynamics of macrophages at central nervous system interfaces. Nat. Immunol. 2016;17:797–805. doi: 10.1038/ni.3423. [DOI] [PMC free article] [PubMed] [Google Scholar]
- Gomez Perdiguero E., Klapproth K., Schulz C., Busch K., Azzoni E., Crozet L., Garner H., Trouillet C., de Bruijn M.F., Geissmann F. Tissue-resident macrophages originate from yolk-sac-derived erythro-myeloid progenitors. Nature. 2015;518:547–551. doi: 10.1038/nature13989. [DOI] [PMC free article] [PubMed] [Google Scholar]
- Hambardzumyan D., Bergers G. Glioblastoma: defining tumor niches. Trends Cancer. 2015;1:252–265. doi: 10.1016/j.trecan.2015.10.009. [DOI] [PMC free article] [PubMed] [Google Scholar]
- Hambardzumyan D., Gutmann D.H., Kettenmann H. The role of microglia and macrophages in glioma maintenance and progression. Nat. Neurosci. 2016;19:20–27. doi: 10.1038/nn.4185. [DOI] [PMC free article] [PubMed] [Google Scholar]
- Holash J., Maisonpierre P.C., Compton D., Boland P., Alexander C.R., Zagzag D., Yancopoulos G.D., Wiegand S.J. Vessel cooption, regression, and growth in tumors mediated by angiopoietins and VEGF. Science. 1999;284:1994–1998. doi: 10.1126/science.284.5422.1994. [DOI] [PubMed] [Google Scholar]
- Holland E.C. A mouse model for glioma: biology, pathology, and therapeutic opportunities. Toxicol. Pathol. 2000;28:171–177. doi: 10.1177/019262330002800122. [DOI] [PubMed] [Google Scholar]
- Holland E.C., Varmus H.E. Basic fibroblast growth factor induces cell migration and proliferation after glia-specific gene transfer in mice. Proc. Natl. Acad. Sci. U S A. 1998;95:1218–1223. doi: 10.1073/pnas.95.3.1218. [DOI] [PMC free article] [PubMed] [Google Scholar]
- Hoshide R., Jandial R. 2016 world health organization classification of central nervous system tumors: an era of molecular biology. World Neurosurg. 2016;94:561–562. doi: 10.1016/j.wneu.2016.07.082. [DOI] [PubMed] [Google Scholar]
- Ishisaki A., Murayama T., Ballagi A.E., Funa K. Nuclear factor Y controls the basal transcription activity of the mouse platelet-derived-growth-factor beta-receptor gene. Eur. J. Biochem. 1997;246:142–146. doi: 10.1111/j.1432-1033.1997.t01-2-00142.x. [DOI] [PubMed] [Google Scholar]
- Jain R.K. Antiangiogenesis strategies revisited: from starving tumors to alleviating hypoxia. Cancer Cell. 2014;26:605–622. doi: 10.1016/j.ccell.2014.10.006. [DOI] [PMC free article] [PubMed] [Google Scholar]
- Jiang Y., Boije M., Westermark B., Uhrbom L. PDGF-B Can sustain self-renewal and tumorigenicity of experimental glioma-derived cancer-initiating cells by preventing oligodendrocyte differentiation. Neoplasia. 2011;13:492–503. doi: 10.1593/neo.11314. [DOI] [PMC free article] [PubMed] [Google Scholar]
- Jiang Y., Marinescu V.D., Xie Y., Jarvius M., Maturi N.P., Haglund C., Olofsson S., Lindberg N., Olofsson T., Leijonmarck C. Glioblastoma cell malignancy and drug sensitivity are affected by the cell of origin. Cell Rep. 2017;18:977–990. doi: 10.1016/j.celrep.2017.01.003. [DOI] [PubMed] [Google Scholar]
- Karrlander M., Lindberg N., Olofsson T., Kastemar M., Olsson A.K., Uhrbom L. Histidine-rich glycoprotein can prevent development of mouse experimental glioblastoma. PLoS One. 2009;4:e8536. doi: 10.1371/journal.pone.0008536. [DOI] [PMC free article] [PubMed] [Google Scholar]
- Kazlauskas A. PDGFs and their receptors. Gene. 2017;614:1–7. doi: 10.1016/j.gene.2017.03.003. [DOI] [PMC free article] [PubMed] [Google Scholar]
- Kim Y., Kim E., Wu Q., Guryanova O., Hitomi M., Lathia J.D., Serwanski D., Sloan A.E., Weil R.J., Lee J. Platelet-derived growth factor receptors differentially inform intertumoral and intratumoral heterogeneity. Genes Dev. 2012;26:1247–1262. doi: 10.1101/gad.193565.112. [DOI] [PMC free article] [PubMed] [Google Scholar]
- Lindberg N., Kastemar M., Olofsson T., Smits A., Uhrbom L. Oligodendrocyte progenitor cells can act as cell of origin for experimental glioma. Oncogene. 2009;28:2266–2275. doi: 10.1038/onc.2009.76. [DOI] [PubMed] [Google Scholar]
- Louis D.N., Perry A., Reifenberger G., von Deimling A., Figarella-Branger D., Cavenee W.K., Ohgaki H., Wiestler O.D., Kleihues P., Ellison D.W. The 2016 world health organization classification of tumors of the central nervous system: a summary. Acta Neuropathol. 2016;131:803–820. doi: 10.1007/s00401-016-1545-1. [DOI] [PubMed] [Google Scholar]
- Lu F., Chen Y., Zhao C., Wang H., He D., Xu L., Wang J., He X., Deng Y., Lu E.E. Olig2-dependent reciprocal shift in PDGF and EGF receptor signaling regulates tumor phenotype and mitotic growth in malignant glioma. Cancer Cell. 2016;29:669–683. doi: 10.1016/j.ccell.2016.03.027. [DOI] [PMC free article] [PubMed] [Google Scholar]
- Mazzone M., Dettori D., Leite de Oliveira R., Loges S., Schmidt T., Jonckx B., Tian Y.M., Lanahan A.A., Pollard P., Ruiz de Almodovar C. Heterozygous deficiency of PHD2 restores tumor oxygenation and inhibits metastasis via endothelial normalization. Cell. 2009;136:839–851. doi: 10.1016/j.cell.2009.01.020. [DOI] [PMC free article] [PubMed] [Google Scholar]
- Mitew S., Hay C.M., Peckham H., Xiao J., Koenning M., Emery B. Mechanisms regulating the development of oligodendrocytes and central nervous system myelin. Neuroscience. 2014;276:29–47. doi: 10.1016/j.neuroscience.2013.11.029. [DOI] [PubMed] [Google Scholar]
- Moeton M., Kanski R., Stassen O.M., Sluijs J.A., Geerts D., van Tijn P., Wiche G., van Strien M.E., Hol E.M. Silencing GFAP isoforms in astrocytoma cells disturbs laminin-dependent motility and cell adhesion. FASEB J. 2014;28:2942–2954. doi: 10.1096/fj.13-245837. [DOI] [PubMed] [Google Scholar]
- Molander C., Hackzell A., Ohta M., Izumi H., Funa K. Sp1 is a key regulator of the PDGF beta-receptor transcription. Mol. Biol. Rep. 2001;28:223–233. doi: 10.1023/a:1015701232589. [DOI] [PubMed] [Google Scholar]
- Ozawa T., Riester M., Cheng Y.K., Huse J.T., Squatrito M., Helmy K., Charles N., Michor F., Holland E.C. Most human non-GCIMP glioblastoma subtypes evolve from a common proneural-like precursor glioma. Cancer Cell. 2014;26:288–300. doi: 10.1016/j.ccr.2014.06.005. [DOI] [PMC free article] [PubMed] [Google Scholar]
- Pyonteck S.M., Akkari L., Schuhmacher A.J., Bowman R.L., Sevenich L., Quail D.F., Olson O.C., Quick M.L., Huse J.T., Teijeiro V. CSF-1R inhibition alters macrophage polarization and blocks glioma progression. Nat. Med. 2013;19:1264–1272. doi: 10.1038/nm.3337. [DOI] [PMC free article] [PubMed] [Google Scholar]
- Quail D.F., Bowman R.L., Akkari L., Quick M.L., Schuhmacher A.J., Huse J.T., Holland E.C., Sutton J.C., Joyce J.A. The tumor microenvironment underlies acquired resistance to CSF-1R inhibition in gliomas. Science. 2016;352:aad3018. doi: 10.1126/science.aad3018. [DOI] [PMC free article] [PubMed] [Google Scholar]
- Quail D.F., Joyce J.A. The microenvironmental landscape of brain tumors. Cancer Cell. 2017;31:326–341. doi: 10.1016/j.ccell.2017.02.009. [DOI] [PMC free article] [PubMed] [Google Scholar]
- Reifenberger G., Wirsching H.G., Knobbe-Thomsen C.B., Weller M. Advances in the molecular genetics of gliomas - implications for classification and therapy. Nat. Rev. Clin. Oncol. 2016;14:434–452. doi: 10.1038/nrclinonc.2016.204. [DOI] [PubMed] [Google Scholar]
- Rolny C., Mazzone M., Tugues S., Laoui D., Johansson I., Coulon C., Squadrito M.L., Segura I., Li X., Knevels E. HRG inhibits tumor growth and metastasis by inducing macrophage polarization and vessel normalization through downregulation of PlGF. Cancer Cell. 2011;19:31–44. doi: 10.1016/j.ccr.2010.11.009. [DOI] [PubMed] [Google Scholar]
- Skalli O., Wilhelmsson U., Orndahl C., Fekete B., Malmgren K., Rydenhag B., Pekny M. Astrocytoma grade IV (glioblastoma multiforme) displays 3 subtypes with unique expression profiles of intermediate filament proteins. Hum. Pathol. 2013;44:2081–2088. doi: 10.1016/j.humpath.2013.03.013. [DOI] [PubMed] [Google Scholar]
- Sorensen M.D., Dahlrot R.H., Boldt H.B., Hansen S., Kristensen B.W. Tumor-associated microglia/macrophages predict poor prognosis in high-grade gliomas and correlate with an aggressive tumor subtype. Neuropathol. Appl. Neurobiol. 2017;44:185–206. doi: 10.1111/nan.12428. [DOI] [PubMed] [Google Scholar]
- Tchougounova E., Kastemar M., Brasater D., Holland E.C., Westermark B., Uhrbom L. Loss of Arf causes tumor progression of PDGFB-induced oligodendroglioma. Oncogene. 2007;26:6289–6296. doi: 10.1038/sj.onc.1210455. [DOI] [PubMed] [Google Scholar]
- Uhrbom L., Dai C., Celestino J.C., Rosenblum M.K., Fuller G.N., Holland E.C. Ink4a-Arf loss cooperates with KRas activation in astrocytes and neural progenitors to generate glioblastomas of various morphologies depending on activated Akt. Cancer Res. 2002;62:5551–5558. [PubMed] [Google Scholar]
- van den Bent M.J., Brandes A.A., Taphoorn M.J., Kros J.M., Kouwenhoven M.C., Delattre J.Y., Bernsen H.J., Frenay M., Tijssen C.C., Grisold W. Adjuvant procarbazine, lomustine, and vincristine chemotherapy in newly diagnosed anaplastic oligodendroglioma: long-term follow-up of EORTC brain tumor group study 26951. J. Clin. Oncol. 2013;31:344–350. doi: 10.1200/JCO.2012.43.2229. [DOI] [PubMed] [Google Scholar]
- Verhaak R.G., Valk P.J. Genes predictive of outcome and novel molecular classification schemes in adult acute myeloid leukemia. Cancer Treat. Res. 2010;145:67–83. doi: 10.1007/978-0-387-69259-3_5. [DOI] [PubMed] [Google Scholar]
- Wallerius M., Wallmann T., Bartish M., Ostling J., Mezheyeuski A., Tobin N.P., Nygren E., Pangigadde P., Pellegrini P., Squadrito M.L. Guidance molecule SEMA3A restricts tumor growth by differentially regulating the proliferation of tumor-associated macrophages. Cancer Res. 2016;76:3166–3178. doi: 10.1158/0008-5472.CAN-15-2596. [DOI] [PubMed] [Google Scholar]
- Zhang X.M., Lund H., Mia S., Parsa R., Harris R.A. Adoptive transfer of cytokine-induced immunomodulatory adult microglia attenuates experimental autoimmune encephalomyelitis in DBA/1 mice. Glia. 2014;62:804–817. doi: 10.1002/glia.22643. [DOI] [PMC free article] [PubMed] [Google Scholar]
Associated Data
This section collects any data citations, data availability statements, or supplementary materials included in this article.