

Abstract
Many liver transplant recipients experience intraoperative hyperglycemia after graft reperfusion. Accordingly, we introduced the Portland intensive insulin therapy (PoIIT) in our practice to better control blood glucose concentration (BGC). We evaluated the effects of PoIIT by comparing with our conventional insulin therapy (CoIT). Of 128 patients who underwent living donor liver transplantation (LDLT) during the phaseout period of CoIT, 89 were treated with the PoIIT and 39 were treated with CoIT. The primary outcome was hyperglycemia (BGC > 180 mg/dL) during the intraoperative postreperfusion phase. The secondary outcomes were postoperative complications such as infection. The incidence of hyperglycemia (22.5% vs. 53.8%, p = 0.001) and prolonged hyperglycemia for >2 hours (7.9% vs. 30.8%, p = 0.002) was significantly lower in PoIIT group than in CoIT group. A mixed linear model further demonstrated that repeatedly measured BGCs were lower in PoIIT group (p < 0.001). The use of PoIIT was significantly associated with decreases in major infections (OR = 0.23 [0.06–0.85], p = 0.028), prolonged mechanical ventilation (OR = 0.29 [0.09–0.89], p = 0.031), and biliary stricture (OR = 0.23 [0.07–0.78], p = 0.018) after adjustments for age, sex, and diabetes mellitus. In conclusion, the PoIIT is effective for maintaining BGC and preventing hyperglycemia during the intraoperative postreperfusion phase of living donor liver transplantation with potential clinical benefits.
Introduction
Liver transplantation is attended with various metabolic disturbances1. Rapid increase in blood glucose concentration (BGC) after graft reperfusion is one of them and results from the systemic influx of glucose from hepatocytes destroyed by ischemia reperfusion injury2,3. Intraoperative hyperglycemia during liver transplantation is associated with surgical site infection, overall infectious complications, and mortality4–6. The decrease in immunity7,8 and increase in ischemia reperfusion injury9 resulting from acute hyperglycemic disturbance are thought to be the underlying mechanisms for these adverse outcomes. Moreover, the early postreperfusion period is a critical time during which substantial hepatic insult occurs and graft regeneration is initiated concurrent with metabolic, synthetic, and detoxifying burdens10–12. Accordingly, liver transplant anesthesiologists strive to maintain glycemic homeostasis during the intraoperative postreperfusion phase to improve post-transplant clinical courses. However, hyperglycemia is still not rare because the extent of hepatocyte ischemia reperfusion injury is profound and insulin sensitivity is impaired due to underlying chronic liver disease, surgical stress, vasoactive drugs, and steroid immunosuppression. The optimal postreperfusion glycemic strategies to improve liver transplant outcomes remain unresolved6.
As a well-established form of intensive insulin therapy (IIT), the Portland IIT (PoIIT) protocol was designed for patients treated in surgical cardiac intensive care units (ICU) and validated as a reliable glycemic strategy with clinical benefits13,14. The success of the PoIIT is attributable to a dynamic algorithm modifying therapeutic insulin doses by accounting for patient insulin sensitivity that is evaluated according to the rate of BGC change at a set insulin dose. That is, calculated insulin dose differs according to the rate of BGC change even if the measured BGCs are the same15. Thus, we had deduced that the PoIIT effectively controls rapid intraoperative hyperglycemic changes in liver transplant recipients and introduced the PoIIT to our practice in January 2015. Among various algorithms with different target BGC ranges, we chose the PoIIT with the lowest target range (80–120 mg/dL) to rapidly control hyperglycemia and minimize the duration of intraoperative hyperglycemia16. We also considered that the risk of hypoglycemia is low due to frequent intraoperative BGC checkups17. Herein, we evaluated the effects of the PoIIT by comparing results with those of our conventional insulin therapy (CoIT) in recipients who underwent liver transplantation during the phaseout period of CoIT.
Materials and Methods
Subjects and data collection
We reviewed the medical records of 128 patients who underwent their first adult-to-adult living donor liver transplantations at our institution during the phaseout period of CoIT (implantation period of the PoIIT) between January 2015 and July 2017. Of these, 39 recipients were treated with CoIT and 89 recipients were treated with the PoIIT. During the phaseout period, the PoIIT was gradually established as a standard protocol by ensuring patient safety and compliance with attending anesthetists (Supplementary Table S1). All data were collected from computerized medical records or a liver transplant database (prospectively collected) and were anonymized and de-identified prior to analysis. The Institutional Review Board of Samsung Medical Center approved this retrospective study (SMC 2016-11-016) and waived the requirement for written informed consent. All procedures in this study were performed in accordance with the relevant guidelines and regulations. No grafts were procured from prisoners. All surgeries were performed at our hospital by surgeons in the Department of surgery, Samsung Medical Center.
Perioperative glycemic management
Recipients fasted starting the evening before surgery and 5% dextrose solution was infused at a rate of 80 mL/h during the fasting period. Preoperative oral carbohydrate supplements were not provided. During surgery, arterial BGCs were measured in combination with other arterial blood-derived parameters using a blood gas/chemistry analysis device (RAPIDLAB1265, Siemens Healthcare Diagnostics Inc., Berlin, Germany) on an hourly basis, as well as at the following additional time points: start of the anhepatic phase, immediately before graft reperfusion, and 5 and 30 minutes after graft reperfusion, as described previously11. The blood gas/chemistry analysis device was near each patient and clinicians were able to reach the device within 1 minute after arterial blood sampling. Insulin therapy was not indicated for controlling BGC before graft reperfusion because BGC generally decreases during the anhepatic phase due to the lack of hepatic glucose production18. Instead, hyperkalemia was corrected using the conventional large-bolus insulin method (10 units of regular insulin) if the blood potassium concentration was >4.5 mEq/L19. After graft reperfusion, the PoIIT or CoIT was initiated at the discretion of anesthetists until ICU arrival. For CoIT, the continuous insulin infusion dose was determined solely by the current BGC: insulin (Humulin R, Eli Lilly, Indianapolis, IN, USA) was infused at 5 U/h if BGC > 150 mg/dL or at 10 U/h if BGC > 200 mg/dL. For PoIIT, both bolus injection and continuous infusion doses were determined by accounting for the degree of BGC change between the current and previous checkups and previous insulin dose in addition to the current BGC (Supplementary Fig. S1)16. After ICU arrival, glycemic management was performed by liver transplant surgeons based on a standardized protocol that is independent from intraoperative glycemic protocols. BGCs were measured at ICU arrival and every 8 hours thereafter using a blood gas/chemistry analysis device (RAPIDLAB1265). Insulin dose was increased by 2 U/h if BGC was 180–240 mg/dL and by 3 U/h if BGC was 240–300 mg/dL; in contrast, the insulin dose was decreased by 1 U/h if BGC was 100–140 mg/dL. Insulin therapy was stopped if BGC was <100 mg/dL.
Anesthetic management
Anesthesia was performed based on a standardized institutional protocol as described previously11. In short, mechanical ventilation was delivered at a tidal volume of 8 mL per ideal body weight (kg) using a mixture of medical air and oxygen with positive end-expiratory pressure set at 6 mmHg. The respiratory rate was adjusted as needed to maintain normocapnea. Vasoactive drugs were used to maintain mean arterial pressure >70 mmHg. Metabolic acidosis was corrected with sodium bicarbonate when the base deficit was >10 mEq/L. Body core temperature was maintained using a whole body-sized warm blanket, airway humidifiers, and fluid warming devices. Transfusion of allogeneic blood was strictly controlled based on a restrictive and prophylactic policy, with each blood component transfused separately according to its respective indication. Blood salvage was routinely used for intraoperative autotransfusion irrespective of the presence of a hepatic tumor20.
Perioperative surgical procedures
Acceptance criteria for liver donation were age ≤65 years, body mass index <35 kg/m2, macrosteatosis ≤30%, and residual liver volume ≥30%. Individuals with any type of hepatitis or fibrosis were excluded from donation. All grafts consisted of segments 5–8 excluding the middle hepatic vein trunk. Graft implantation was performed using the piggyback technique. After the portal vein anastomosis was completed, the graft was reperfused by consecutively unclamping the hepatic vein and portal vein. The hepatic artery was subsequently anastomosed, followed by biliary anastomosis. Immunosuppression was performed based on a quadruple regimen consisting of methylprednisolone, basiliximab, mycophenolate mofetil, and tacrolimus as described previously21. In particularly, recipients received methylprednisolone 500 mg intravenously before graft reperfusion for the induction of immunosuppression and 500 mg daily until postoperative day 2, followed by a tapered dose of 60 mg per day for 5 days, and then 8 mg twice per day for 1 month.
Variables and statistical analysis
The primary outcome was hyperglycemia during the intraoperative postreperfusion phase. Hyperglycemia was defined when a BGC was >180 mg/dL based on previous research22. Secondary outcomes were blood potassium, the extent of hepatocyte injury, and postoperative complications. Hepatocyte injury was determined by monitoring aspartate transaminase (AST) and alanine transaminase (ALT) during the first week after surgery23. Postoperative complications were graded according to the modified Clavien-Dindo classification24,25. Surgical site infections included superficial/deep incisional infections or organ/space infections according to the Centers for Disease Control definitions for surgical infection26. Major infections included septicemia, peritonitis, pneumonia, and tissue-invasive cytomegalovirus disease. During the postoperative period, the first BGC or potassium concentration measured each day was used for analysis. Continuous variables are expressed as mean ± standard deviation or median (25th percentile–75th percentile) and were analyzed by t-test or the Mann-Whitney test. Repeatedly measured continuous variables were analyzed by a mixed linear model with the Bonferroni correction. Categorical variables are expressed as frequency (%) and were analyzed by chi-square test, Fisher’s exact test, or binary logistic regression, as appropriate. In terms of postoperative complications, potential compounding effect from age, sex, and diabetes mellitus was adjusted during multivariable analysis and the risk of type I error or the false discovery rate was controlled by using the Benjamini-Hochberg procedure27. All reported p values were 2-sided, and p < 0.05 was considered statistically significant. Analyses were performed using SPSS version 23.0 (IBM, Armonk, NY, USA) or SAS version 9.2 (SAS institute, Cary, NC, USA).
Results
Clinical characteristics
As shown in Tables 1 and 2, there were no significant differences between CoIT group and PoIIT group regarding graft quantity/quality, recipient baseline clinical characteristics, or intraoperative hemodynamic variables (p > 0.05). Preoperative fasting BGC was 118 ± 50 mg/dL in CoIT group and 107 ± 32 mg/dL in PoIIT group (p = 0.215). Mean duration of the intraoperative postreperfusion phase was about 4 hours for each group and the amount of insulin infused during the postreperfusion phase was significantly greater in the PoIIT group than in the CoIT group (24 ± 16 U vs. 18 ± 12 U, p = 0.006). No recipients experienced hypoglycemia of BGC < 60 mg/dL15,28: only one PoIIT recipient reached <70 mg/dL (65 mg/dL).
Table 1.
Graft factors, recipient baseline characteristics, and operative variables.
| Conventional (n = 39) | Portland (n = 89) | P | |
|---|---|---|---|
| Graft Factors | |||
| Age (years) | 32 (25–39) | 29 (22–38) | 0.848 |
| Male sex | 24 (61.5) | 49 (55.1) | 0.563 |
| Macrosteatosis | 14 (35.9) | 31 (34.8) | >0.99 |
| Graft-to-recipient weight ratio (%) | 1.1 ± 0.3 | 1.0 ± 0.3 | 0.072 |
| Cold ischemia time (minutes) | 94 ± 20 | 92 ± 23 | 0.744 |
| Warm ischemia time (minutes) | 39 ± 14 | 43 ± 18 | 0.184 |
| Recipient Factors | |||
| Age (years) | 56 (51–62) | 56 (52–60) | 0.630 |
| Male sex | 28 (71.8) | 65 (73.0) | >0.99 |
| Body mass index (kg/m2) | 24 ± 4 | 25 ± 4 | 0.541 |
| MELD score | 17 ± 10 | 14 ± 8 | 0.102 |
| Pre-transplant diabetes | 11 (28.9) | 18 (20.2) | 0.362 |
| Oral hypoglycemic agents | 8 (72.7) | 15 (83.3) | |
| Insulin | 3 (27.3) | 3 (15.8) | |
| Hypertension | 2 (5.1) | 11 (12.4) | 0.341 |
| Primary etiology | 0.242 | ||
| Hepatitis B virus | 26 (66.7) | 59 (66.3) | |
| Hepatitis C virus | 0 | 5 (5.6) | |
| Alcoholic | 3 (7.7) | 11 (12.4) | |
| Others | 10 (25.6) | 14 (15.7) | |
| Preoperative laboratory findings | |||
| Glucose (mg/dL) | 118 ± 50 | 107 ± 32 | 0.215 |
| Potassium (mEq/L) | 4.0 ± 0.4 | 4.1 ± 0.4 | 0.117 |
| Albumin (g/dL) | 3.4 ± 0.6 | 3.4 ± 0.6 | 0.800 |
| Creatinine (mg/dL) | 0.9 ± 0.4 | 0.9 ± 0.3 | 0.272 |
| Sodium (mmol/L) | 138 ± 7 | 139 ± 5 | 0.317 |
| High sensitivity CRP (mg/dL) | 0.5 ± 0.5 | 0.7 ± 1.5 | 0.390 |
| Platelet count (×109/L) | 85 ± 48 | 73 ± 44 | 0.205 |
| Neutrophil-to-lymphocyte ratio | 2.9 ± 2.5 | 3.2 ± 4.1 | 0.730 |
| Lactate (mmol/L) | 2.2 ± 2.1 | 1.4 ± 0.6 | 0.082 |
| Aspartate transaminase (U/L) | 80 ± 140 | 53 ± 41 | 0.099 |
| Alanine transaminase (U/L) | 91 ± 280 | 45 ± 58 | 0.145 |
| Prothrombin time (INR) | 1.8 ± 1.4 | 1.5 ± 0.6 | 0.100 |
| Total bilirubin (mg/dL) | 6.5 ± 11.5 | 5.1 ± 4.1 | 0.483 |
| Intraoperative factors | |||
| Vasoactive drug use | |||
| Maximum dopamine dose (µg/kg/min) | 0 (0–5) | 3 (0–5) | 0.222 |
| Maximum norepinephrine dose (µg/kg/min) | 0.15 (0.06–0.25) | 0.20 (0.10–0.30) | 0.682 |
| Maximum vasopressin dose (U/min) | 0 (0-0) | 0 (0-0) | 0.155 |
| Allogeneic transfusion | |||
| Red blood cells (units) | 0 (0–2) | 0 (0–2) | 0.885 |
| Fresh frozen plasma (units) | 0 (0–2) | 0 (0–2) | 0.458 |
| Apheresis platelets (units) | 0 (0–0) | 0 (0-0) | 0.240 |
| Cryoprecipitate (units) | 0 (0–4) | 0 (0–6) | 0.398 |
| Crystalloid infusion (mL) | 5780 ± 3373 | 5735 ± 3175 | 0.942 |
| Colloid infusion (mL) | 1722 ± 695 | 1871 ± 795 | 0.313 |
| Anesthesia time (minutes) | 610 ± 106 | 617 ± 94 | 0.721 |
| Operation time (minutes) | 514 ± 105 | 523 ± 97 | 0.649 |
| Reperfusion phase time (minutes) | 254 ± 71 | 246 ± 68 | 0.533 |
| Insulin use before reperfusion | 15 (38.5) | 26 (29.2) | 0.311 |
Data are presented as mean ± standard deviation or median (25th percentile–75th percentile) for continuous variables and number (%) as appropriate for categorical variables. CRP, C-reactive protein; MELD, model for end-stage liver disease.
Table 2.
Intraoperative biochemical and hemodynamic variables before and after graft reperfusion.
| Before graft reperfusion* | After graft reperfusion† | |||||
|---|---|---|---|---|---|---|
| Conventional (n = 39) | Portland (n = 89) | P | Conventional (n = 39) | Portland (n = 89) | P | |
| Arterial blood gas/chemistry analysis | ||||||
| PaO2-to-FiO2 ratio (mmHg) | 557 ± 156 | 511 ± 150 | 0.119 | 430 ± 86 | 448 ± 107 | 0.383 |
| pH | 7.30 ± 0.06 | 7.29 ± 0.07 | 0.426 | 7.31 ± 0.06 | 7.30 ± 0.06 | 0.216 |
| Base excess (mEq/L) | −6.2 ± 3.2 | −7.2 ± 3.4 | 0.153 | −6.6 ± 3.2 | −7.2 ± 3.3 | 0.378 |
| Chloride (mEq/L) | 108 ± 19 | 109 ± 4 | 0.735 | 109 ± 19 | 110 ± 4 | 0.678 |
| Central laboratory findings | ||||||
| Hematocrit (mg/dL) | 27 ± 4 | 27 ± 5 | 0.546 | 27 ± 3 | 27 ± 4 | 0.944 |
| Platelet count (×109/L) | 69 ± 48 | 62 ± 40 | 0.546 | 75 ± 52 | 70 ± 46 | 0.235 |
| Prothrombin time (INR) | 2.9 ± 1.5 | 3.1 ± 1.4 | 0.510 | 2.9 ± 0.8 | 3.2 ± 1.3 | 0.615 |
| Fibrinogen (mg/dL) | 120 ± 50 | 109 ± 47 | 0.238 | 110 ± 42 | 100 ± 37 | 0.217 |
| Hemodynamics | ||||||
| Mean femoral arterial pressure (mmHg) | 67 ± 25 | 73 ± 21 | 0.171 | 71 ± 14 | 74 ± 13 | 0.296 |
| Jugular venous pressure (mmHg) | 6 ± 3 | 9 ± 12 | 0.165 | 2 ± 4 | 2 ± 2 | 0.781 |
| Mean pulmonary artery pressure (mmHg) | 16 ± 5 | 15 ± 5 | 0.654 | 16 ± 3 | 14 ± 4 | 0.114 |
| Pulmonary capillary wedge pressure (mmHg) | 11 ± 3 | 10 ± 4 | 0.489 | 10 ± 3 | 9 ± 3 | 0.116 |
| Systemic vascular resistance (dyn·s/cm5) | 789 ± 241 | 733 ± 291 | 0.305 | 643 ± 221 | 618 ± 158 | 0.462 |
| Heart rate (/min) | 93 ± 21 | 94 ± 19 | 0.873 | 94 ± 14 | 97 ± 13 | 0.423 |
| Cardiac output (L/min) | 7.6 ± 1.7 | 7.9 ± 2.4 | 0.327 | 8.2 ± 1.7 | 8.9 ± 2.2 | 0.121 |
| Ejection fraction (%) | 39 ± 9 | 42 ± 9 | 0.250 | 43 ± 7 | 44 ± 7 | 0.613 |
| Mixed venous oxygen saturation (%) | 89 ± 6 | 92 ± 5 | 0.092 | 89 ± 6 | 89 ± 5 | 0.942 |
Data are presented as mean ± standard deviation or median (25th percentile–75th percentile). FiO2, fraction of inspired oxygen; PaO2, arterial partial oxygen pressure. *Immediately before graft reperfusion. †1, 2, 3, and 4 hours after graft reperfusion (mean value).
Intraoperative BGCs after graft reperfusion
BGC at the moment of graft reperfusion was comparable between the two groups: 117 ± 35 mg/dL in CoIT group and 120 ± 28 mg/dL in PoIIT group (p = 0.631). As shown in Fig. 1a, BGCs continued to increase after graft reperfusion in CoIT group, whereas BGCs gradually decreased in PoIIT group. BGCs at 1, 2, 3, and 4 hours after graft reperfusion, and at the moment of ICU arrival, were 155 ± 38, 154 ± 31, 159 ± 28, 160 ± 28, and 167 ± 37 mg/dL, respectively, in CoIT group and 149 ± 27 (p > 0.99), 137 ± 22 (p = 0.015), 134 ± 17 (p < 0.001), 134 ± 17 (p < 0.001), and 137 ± 23 mg/dL (p < 0.001), respectively, in PoIIT group. Repeatedly measured BGCs were significantly lower in PoIIT group than in CoIT group (p < 0.001). As shown in Fig. 2, the incidence of hyperglycemia was significantly lower in PoIIT group than in CoIT group (22.5% vs. 53.8%, p = 0.001) as well as prolonged hyperglycemia occurring during >2 hours (7.9% vs. 30.8%, p = 0.002). At 3 hours after graft reperfusion, no patients in PoIIT group and 9 recipients (23.1%) in CoIT group had hyperglycemia (p < 0.001). Within the subgroup of recipients with diabetes (18 with the PoIIT and 11 with CoIT), BGCs continued to increase after graft reperfusion in CoIT group, whereas BGCs gradually decreased in PoIIT group, as shown in the whole cohort (Fig. 1b). Repeatedly measured BGCs were significantly lower in PoIIT group (p < 0.001). The incidence of hyperglycemia (33.3% vs. 63.6%, p = 0.143) and prolonged hyperglycemia (11.1% vs. 36.4%, p = 0.164) were insignificantly lower in PoIIT group, most likely due to insufficient sample size29.
Figure 1.
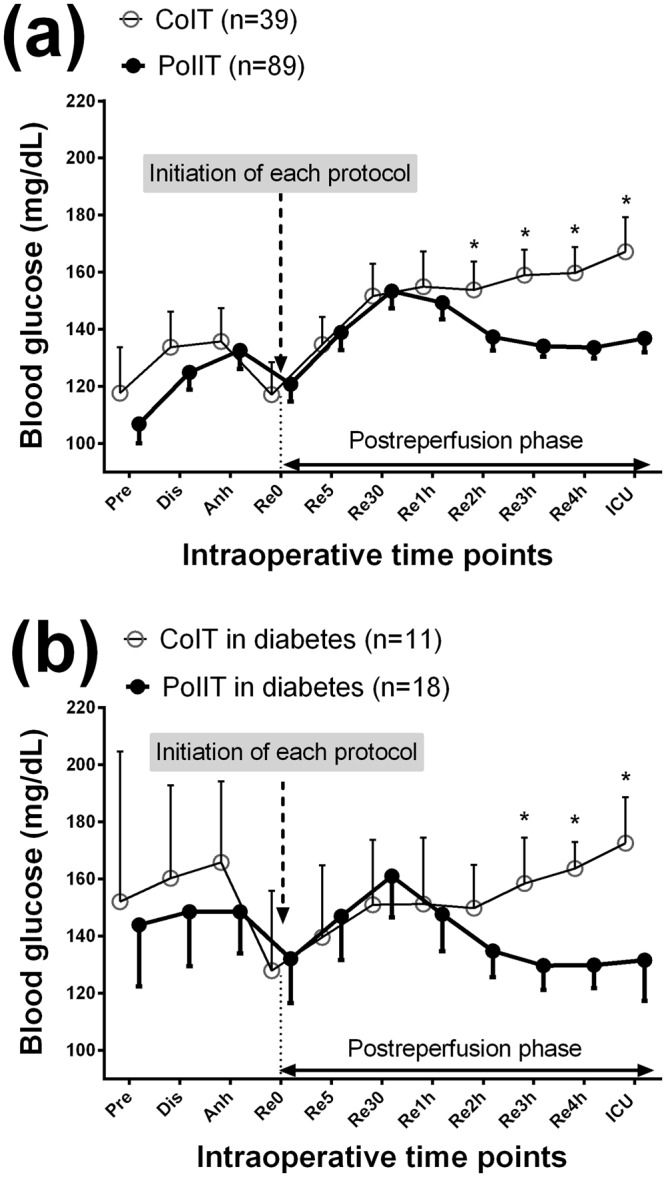
Blood glucose concentrations in (a) all recipients and (b) diabetic recipients at the following time points; Pre, one day before surgery; Dis, the start of the dissection phase; Anh, the start of the anhepatic phase; Re0, immediately before graft reperfusion; Re5/30, 5/30 minutes after graft reperfusion; Re1h/2 h/3 h/4 h, 1/2/3/4 hours after graft reperfusion; ICU, ICU arrival. *p < 0.05 after Bonferroni correction in mixed linear model analysis.
Figure 2.
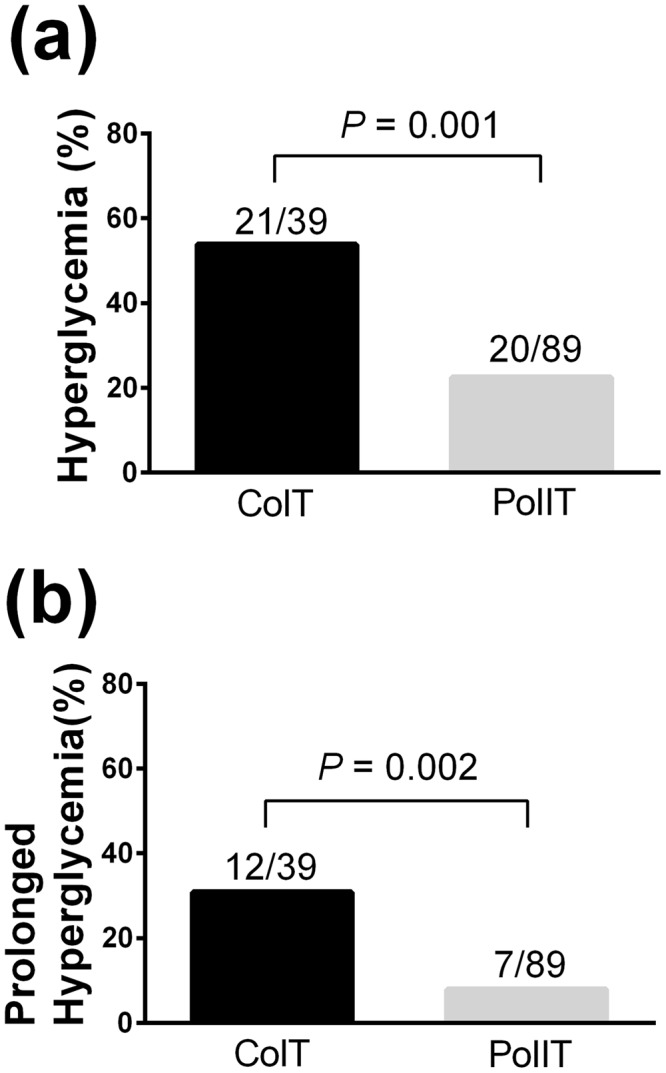
The incidences of (a) hyperglycemia and (b) prolonged hyperglycemia occurring for >2 hours. The number above the bar indicates the event frequency per group.
Intraoperative blood potassium concentrations after graft reperfusion
Blood potassium concentrations gradually decreased in PoIIT group after graft reperfusion, whereas it continued to increase in CoIT group (Fig. 3). Repeatedly measured potassium concentrations were significantly lower in PoIIT group than in CoIT group (p < 0.001). One CoIT recipient (2.6%) and one PoIIT recipient (1.1%) experienced hyperkalemia (>5.5 mEq/L) during the intraoperative postreperfusion phase (p = 0.518), and were managed with an additional bolus insulin injection. Four CoIT recipients (10.3%) and 6 PoIIT recipients (6.7%) experienced hypokalemia (<3.0 mEq/L, p = 0.492), and were managed with intravenous potassium replacement (5 mEq/h) without any detected complications. No patients reached <2.5 mEq/L.
Figure 3.
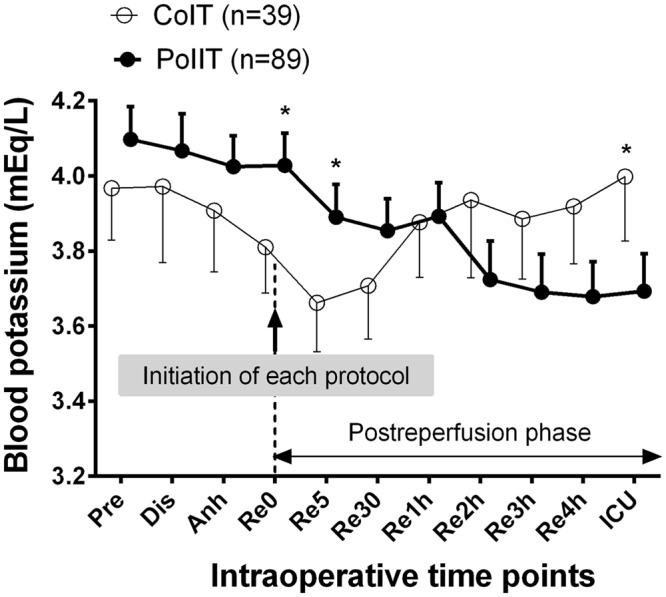
Blood potassium concentrations at the following time points; Pre, one day before surgery; Dis, the start of the dissection phase; Anh, the start of the anhepatic phase; Re0, immediately before graft reperfusion; Re5/30, 5/30 minutes after graft reperfusion; Re1h/2 h/3 h/4 h, 1/2/3/4 hours after graft reperfusion; ICU, ICU arrival. *p < 0.05 after Bonferroni correction in mixed linear model analysis.
Postoperative blood glucose and potassium concentrations
There were no significant differences between the two groups regarding blood glucose and potassium concentrations after the cessation of intraoperative glycemic protocols and the start of the ICU glycemic protocol (Supplementary Fig. S2), indicating that a single ICU glycemic protocol was performed similarly for the two groups.
Postoperative complications
As shown in Fig. 4a, repeatedly measured postoperative ASTs were significantly lower in PoIIT group than in CoIT group p = 0.015, indicating less hepatocyte injury in relation to the use of the PoIIT. In particular, AST level immediately after ICU arrival was 257 ± 159 IU/L in PoIIT group and 390 ± 333 IU/L in CoIT group. Repeatedly measured ALTs were insignificantly lower in PoIIT group (p = 0.412) (Fig. 4b). In particular, ALT level immediately after ICU arrival was 213 ± 167 IU/L in PoIIT group and 340 ± 347 IU/L in CoIT group. As shown in Table 3, results of univariable analysis indicated that the risks of major infection (4.5% vs. 17.9%, OR = 0.22 [0.06–0.79], p = 0.020), prolonged mechanical ventilation (6.7% vs. 20.5%, OR = 0.28 [0.09–0.87], p = 0.028), and biliary stricture (5.6% vs. 20.5%, OR = 0.23 [0.07–0.76], p = 0.016) were significantly lower in PoIIT group. After adjustments for age, sex, and diabetes mellitus, the PoIIT was significantly associated with decreases in major infections (OR = 0.23 [0.06–0.85], p = 0.028), prolonged mechanical ventilation (OR = 0.29 [0.09–0.89], p = 0.031), and biliary stricture (OR = 0.23 [0.07–0.78], p = 0.018). Detailed results of multivariable analysis for each outcome variable are described in Supplementary Table S2.
Figure 4.

Perioperative changes in (a) aspartate transaminase (AST) and (b) alanine transaminase (ALT). Pre, the day before surgery; Pod, postoperative day. *p < 0.05 after Bonferroni correction in mixed linear model analysis.
Table 3.
Postoperative complications in univariable and multivariable analyses.
| Conventional (n = 39) | Portland (n = 89) | Univariable analysis | Multivariable analysis | |||
|---|---|---|---|---|---|---|
| OR | P | †OR | P | |||
| Major infection* | 7 (17.9) | 4 (4.5) | 0.22 [0.06–0.79] | 0.020 | 0.23 [0.06–0.85] | 0.028 |
| Surgical site infection | 5 (12.8) | 10 (11.2) | 0.86 [0.27–2.71] | 0.798 | 0.93 [0.29–3.01] | 0.909 |
| Cytomegalovirus infection | 28 (71.8) | 56 (62.9) | 0.67 [0.29–1.51] | 0.332 | 0.64 [0.28–1.46] | 0.289 |
| Gr IIIb-V complication | 7 (17.9) | 20 (22.5) | 1.33 [0.51–3.45] | 0.564 | 1.33 [0.51–3.47] | 0.564 |
| Bile leak | 7 (17.9) | 11(12.4) | 0.65 [0.23–1.81] | 0.405 | 0.64 [0.22–1.85] | 0.406 |
| Biliary stricture | 8 (20.5) | 5 (5.6) | 0.23 [0.07–0.76] | 0.016 | 0.23 [0.07–0.78] | 0.018 |
| Respiratory complication | 11 (28.2) | 20 (22.5) | 0.74 [0.31–1.74] | 0.487 | 0.75 [0.31–1.83] | 0.521 |
| Mechanical ventilation >24 hours | 8 (20.5) | 6 (6.7) | 0.28 [0.09–0.87] | 0.028 | 0.29 [0.09–0.89] | 0.031 |
| Acute kidney injury within 48 hours | 9 (23.1) | 20 (22.5) | 0.97 [0.39–2.37] | 0.940 | 0.95 [0.39–2.34] | 0.915 |
Data are presented as frequency (%) and odds ratio (OR) with 95% confidence interval.
*Septicemia, peritonitis, pneumonia and tissue-invasive cytomegalovirus disease. †Adjusted for age, sex, and diabetes mellitus.
Discussion
In this study, we demonstrated that the PoIIT was superior to our CoIT for controlling acute hyperglycemic disturbance after graft reperfusion and for preventing intraoperative hyperglycemia during the postreperfusion phase in living donor liver transplantations. Hyperglycemia risk was reduced by 60% in relation to the use of the PoIIT (22.5% vs. 53.8%). Although greater amounts of insulin were used with the PoIIT, no recipients developed clinically relevant hypoglycemia. PoIIT showed an additional advantage by preventing increases in potassium concentration after graft reperfusion. Moreover, the use of the PoIIT was associated with improved post-transplant clinical courses in terms of hepatocyte injury, major infection, prolonged mechanical ventilation, and biliary stricture.
Among the various IITs16, our team selected the PoIIT because it was designed for surgical patients, while many IITs are for medical ICU patients, and because the PoIIT has been well-validated as an effective intraoperative glycemic protocol in cardiac surgeries during which glycemic environment and patient insulin sensitivity change considerably during surgery13,14. Moreover, a previous study has suggested that hypoglycemia risk is lower in the PoIIT than in other IITs, particularly when insulin sensitivity is impaired16. Nonetheless, it was unclear whether the PoIIT would be effective for use in liver transplantation. Some studies of patients undergoing liver surgeries have highlighted the necessity of developing better intraoperative glycemic strategies by reporting the difficulties in controlling BGC and negative clinical impacts of intraoperative hyperglycemia4,5,30. In a previous study comparing 60 liver transplant recipients with mean intraoperative BGC of <150 mg/dL and 124 recipients with mean intraoperative BGC of ≥150 mg/dL, higher intraoperative BGC was associated with post-transplant infections and mortality5. Another study of 680 recipients demonstrated that intraoperative hyperglycemia (BGC > 200 mg/dL) was associated with surgical site infection4. Despite the need for better intraoperative glycemic protocols for liver transplantation, there have been no studies evaluating the efficacy and/or safety of particular insulin infusion protocols.
The mechanisms underlying the association of the use of PoIIT with improved post-transplant clinical outcomes might be attributable to decreased intraoperative BGCs and hyperglycemia. First, acute transient hyperglycemia or BGC fluctuation even during short periods disturbs the innate immune system by inhibiting neutrophil migration, phagocytosis, and complement function, stimulating inflammatory cytokines, and decreasing microvascular reactivity7,8. The deterioration of innate immune response may promote infection progress. Second, previous research demonstrated that only a transient period of acute hyperglycemia is necessary to aggravate ischemia reperfusion injury via oxidative stress and impaired tissue microcirculation3,9. A previous study of critically ill patients demonstrated that hepatocyte mitochondrial ultrastructure and function can be protected by preventing acute hyperglycemia with tight glycemic control31. Moreover, insulin may directly mitigate hepatocyte injury by serving as a scavenger of free radicals generated during the ischemia reperfusion process32. Third, decreased hepatic ischemia reperfusion injury could also benefit the bile duct23. Ischemia reperfusion injury to the microvasculature of the bile duct arteriolar plexus causes biliary epithelial cell damage; consequently, inflammatory cells penetrate between epithelial cells and basement membranes, and result in biliary stricture33, Moreover, insulin is an essential molecule for the regeneration of hepatic tissues including the bile duct34,35. A previous study in rats demonstrated that the degree of liver regeneration after hepatectomy was lower in subjects with decreased insulin sensitivity and suggested the benefit of insulin administration36. Another study demonstrated that early graft regeneration after LDLT was improved in relation to postoperative insulin administration37. Fourth, acute hyperglycemia-induced oxidative stress is systemic and can affect various tissues and organs in remote areas including the diaphragm38, which supports the association between the use of the PoIIT and decreased risk of prolonged mechanical ventilation. In addition, a direct anabolic effect of insulin on respiratory muscles may play a role: previous research demonstrated that insulin administration promotes skeletal muscle protein uptake and synthesis, improving skeletal muscle function39.
This study had several limitations. First, due to its retrospective nature, we are unable to establish a direct cause-and-effect relationship between the use of the PoIIT and improved post-transplant outcomes, although some of the underlying mechanisms can be hypothesized based on previous studies. In addition, we were unable to include more variables in the multivariable model due to the limited event number40. Thus, the association between strict glycemic management and post-transplant outcomes warrants further research with sufficient sample size. Nonetheless, we performed the Bonferroni correction and the Benjamini-Hochberg procedure to decrease the risk of type I error. Moreover, the sufficient sample size to assess the primary outcome was an advantage of the current study: the power of the 50% reduction of an assumed intraoperative hyperglycemia rate with the PoIIT was 83%. Second, there was a potential risk of selection bias because the use of the PoIIT or CoIT was determined at the discretion of attending anesthetists. In this regard, we tested and confirmed the absence of significant differences among 4 attending anesthetists who covered all recipients evaluated in the current study regarding graft quantity and quality, donor factors, recipient factors, and preoperative laboratory findings (Supplementary Table S3). Third, only 25.8% of recipients with the PoIIT reached the target range (80–120 mg/dL) before ICU arrival, during about 4 hours after the initiation of the PoIIT, most likely due to profound hepatic injury and severe insulin insensitivity. Thus, it remains unclear that how fast the target BGC range can be achieved and how safely the target range can be maintained once it is achieved. It should be noted that IIT-induced severe hypoglycemia and hypokalemia can cause poor outcomes17,41. In addition, identifying the optimal time window for the use of the PoIIT warrants further research. Nonetheless, the results of the current study suggest that transient use of PoIIT during the intraoperative postreperfusion phase and prevention of acute hyperglycemia for the critical time window may provide clinical benefits.
The use of the PoIIT during the intraoperative postreperfusion phase was associated with decreases in intraoperative hyperglycemia and postoperative complications such as infections, prolonged mechanical ventilation, and biliary stricture. We observed no increases in the risks of hypoglycemia or hypokalemia in relation to the use of the PoIIT. Our findings suggest that the PoIIT effectively and safely controls acute hyperglycemic change after graft reperfusion and prevents hyperglycemia during LDLT, resulting in potential clinical benefits.
Electronic supplementary material
Author Contributions
Kang R.A. and Han S. designed the study, analyzed data, and wrote the manuscript; Kang R.A., Lee K.W. and Lee S. collected data; Lee S., Kim G.S., Ko J.S., Gwak M.S. and Choi S.J. contributed to the conception, data analysis, and critical revision.
Data Availability
The datasets generated during and/or analyzed during the current study are available from the corresponding author on reasonable request.
Competing Interests
The authors declare no competing interests.
Footnotes
Publisher’s note: Springer Nature remains neutral with regard to jurisdictional claims in published maps and institutional affiliations.
Electronic supplementary material
Supplementary information accompanies this paper at 10.1038/s41598-018-34655-6.
References
- 1.Shangraw RE. Metabolic issues in liver transplantation. Int Anesthesiol Clin. 2006;44:1–20. doi: 10.1097/00004311-200604430-00003. [DOI] [PubMed] [Google Scholar]
- 2.Han S, et al. Glycemic responses to intermittent hepatic inflow occlusion in living liver donors. Liver Transpl. 2015;21:180–186. doi: 10.1002/lt.24029. [DOI] [PubMed] [Google Scholar]
- 3.Han S, et al. Intraoperative hyperglycemia during liver resection: Predictors and association with the extent of hepatocytes injury. PLoS One. 2014;9:e109120. doi: 10.1371/journal.pone.0109120. [DOI] [PMC free article] [PubMed] [Google Scholar]
- 4.Park C, et al. Severe intraoperative hyperglycemia is independently associated with surgical site infection after liver transplantation. Transplantation. 2009;87:1031–1036. doi: 10.1097/TP.0b013e31819cc3e6. [DOI] [PubMed] [Google Scholar]
- 5.Ammori JB, Sigakis M, Englesbe MJ, O’Reilly M, Pelletier SJ. Effect of intraoperative hyperglycemia during liver transplantation. J Surg Res. 2007;140:227–233. doi: 10.1016/j.jss.2007.02.019. [DOI] [PubMed] [Google Scholar]
- 6.Park CS. Predictive roles of intraoperative blood glucose for post-transplant outcomes in liver transplantation. World J Gastroenterol. 2015;21:6835–6841. doi: 10.3748/wjg.v21.i22.6835. [DOI] [PMC free article] [PubMed] [Google Scholar]
- 7.Turina M, Fry DE, Polk HC., Jr. Acute hyperglycemia and the innate immune system: clinical, cellular, and molecular aspects. Crit Care Med. 2005;33:1624–1633. doi: 10.1097/01.CCM.0000170106.61978.D8. [DOI] [PubMed] [Google Scholar]
- 8.Jafar N, Edriss H, Nugent K. The effect of short-term hyperglycemia on the innate immune system. Am J Med Sci. 2016;351:201–211. doi: 10.1016/j.amjms.2015.11.011. [DOI] [PubMed] [Google Scholar]
- 9.Behrends M, et al. Acute hyperglycemia worsens hepatic ischemia/reperfusion injury in rats. J Gastrointest Surg. 2010;14:528–535. doi: 10.1007/s11605-009-1112-3. [DOI] [PMC free article] [PubMed] [Google Scholar]
- 10.Michalopoulos GK, DeFrances MC. Liver regeneration. Science. 1997;276:60–66. doi: 10.1126/science.276.5309.60. [DOI] [PubMed] [Google Scholar]
- 11.Han S, et al. Association between intraoperative platelet transfusion and early graft regeneration in living donor liver transplantation. Ann Surg. 2016;264:1065–1072. doi: 10.1097/SLA.0000000000001526. [DOI] [PubMed] [Google Scholar]
- 12.Clavien PA, Petrowsky H, DeOliveira ML, Graf R. Strategies for safer liver surgery and partial liver transplantation. N Engl J Med. 2007;356:1545–1559. doi: 10.1056/NEJMra065156. [DOI] [PubMed] [Google Scholar]
- 13.Furnary AP, et al. Continuous insulin infusion reduces mortality in patients with diabetes undergoing coronary artery bypass grafting. J Thorac Cardiovasc Surg. 2003;125:1007–1021. doi: 10.1067/mtc.2003.181. [DOI] [PubMed] [Google Scholar]
- 14.Furnary AP, Wu Y, Bookin SO. Effect of hyperglycemia and continuous intravenous insulin infusions on outcomes of cardiac surgical procedures: the Portland Diabetic Project. Endocr Pract. 2004;10(Suppl 2):21–33. doi: 10.4158/EP.10.S2.21. [DOI] [PubMed] [Google Scholar]
- 15.Furnary AP, Cheek DB, Holmes SC, Howell WL, Kelly SP. Achieving tight glycemic control in the operating room: lessons learned from 12 years in the trenches of a paradigm shift in anesthetic care. Semin Thorac Cardiovasc Surg. 2006;18:339–345. doi: 10.1053/j.semtcvs.2007.01.004. [DOI] [PubMed] [Google Scholar]
- 16.Steil GM, et al. Intensive Care Unit Insulin Delivery Algorithms: Why So Many? How to Choose? J Diabetes Sci Technol. 2009;3:125–140. doi: 10.1177/193229680900300114. [DOI] [PMC free article] [PubMed] [Google Scholar]
- 17.Egi M, Furushima N, Makino S, Mizobuchi S. Glycemic control in acute illness. Korean J Anesthesiol. 2017;70:591–595. doi: 10.4097/kjae.2017.70.6.591. [DOI] [PMC free article] [PubMed] [Google Scholar]
- 18.Battezzati A, et al. Nonhepatic glucose production in humans. Am J Physiol Endocrinol Metab. 2004;286:E129–135. doi: 10.1152/ajpendo.00486.2002. [DOI] [PubMed] [Google Scholar]
- 19.De Wolf A, Frenette L, Kang Y, Tang C. Insulin decreases the serum potassium concentration during the anhepatic stage of liver transplantation. Anesthesiology. 1993;78:677–682. doi: 10.1097/00000542-199304000-00010. [DOI] [PubMed] [Google Scholar]
- 20.Han S, et al. Safety of the use of blood salvage and autotransfusion during liver transplantation for hepatocellular carcinoma. Ann Surg. 2016;264:339–343. doi: 10.1097/SLA.0000000000001486. [DOI] [PubMed] [Google Scholar]
- 21.Han, S. et al. Risk of Post-transplant Hepatocellular Carcinoma Recurrence Is Higher in Recipients of Livers From Male Than Female Living Donors. Ann Surg[Epub ahead of print], 10.1097/SLA.0000000000002318) (2017). [DOI] [PubMed]
- 22.Akhtar S, Barash PG, Inzucchi SE. Scientific principles and clinical implications of perioperative glucose regulation and control. Anesth Analg. 2010;110:478–497. doi: 10.1213/ANE.0b013e3181c6be63. [DOI] [PubMed] [Google Scholar]
- 23.Han S, et al. Comparison of the tolerance of hepatic ischemia/reperfusion injury in living donors: Macrosteatosis versus microsteatosis. Liver Transpl. 2014;20:775–783. doi: 10.1002/lt.23878. [DOI] [PubMed] [Google Scholar]
- 24.Dindo D, Demartines N, Clavien PA. Classification of surgical complications: a new proposal with evaluation in a cohort of 6336 patients and results of a survey. Ann Surg. 2004;240:205–213. doi: 10.1097/01.sla.0000133083.54934.ae. [DOI] [PMC free article] [PubMed] [Google Scholar]
- 25.Clavien PA, et al. Definition and classification of negative outcomes in solid organ transplantation. Application in liver transplantation. Ann Surg. 1994;220:109–120. doi: 10.1097/00000658-199408000-00002. [DOI] [PMC free article] [PubMed] [Google Scholar]
- 26.Mangram Alicia J., Horan Teresa C., Pearson Michele L., Silver Leah Christine, Jarvis William R. Guideline for Prevention of Surgical Site Infection, 1999. Infection Control & Hospital Epidemiology. 1999;20(04):247–280. doi: 10.1086/501620. [DOI] [PubMed] [Google Scholar]
- 27.Benjamini YHY. Controlling the false discovery rate: a practical and powerful approach to multiple testing. J Roy Stat Soc. 1995;57:289–300. [Google Scholar]
- 28.Garg R, et al. Effect of preoperative diabetes management on glycemic control and clinical outcomes after elective surgery. Ann Surg. 2018;267:858–862. doi: 10.1097/SLA.0000000000002323. [DOI] [PubMed] [Google Scholar]
- 29.Bababekov YJ, Stapleton SM, Mueller JL, Fong ZV, Chang DC. A proposal to mitigate the consequences of type 2 error in surgical science. Ann Surg. 2018;267:621–622. doi: 10.1097/SLA.0000000000002547. [DOI] [PubMed] [Google Scholar]
- 30.Okabayashi T, et al. Effect of intensive insulin therapy using a closed-loop glycemic control system in hepatic resection patients: a prospective randomized clinical trial. Diabetes Care. 2009;32:1425–1427. doi: 10.2337/dc08-2107. [DOI] [PMC free article] [PubMed] [Google Scholar]
- 31.Vanhorebeek I, et al. Protection of hepatocyte mitochondrial ultrastructure and function by strict blood glucose control with insulin in critically ill patients. Lancet. 2005;365:53–59. doi: 10.1016/S0140-6736(04)17665-4. [DOI] [PubMed] [Google Scholar]
- 32.Hess ML, et al. Glucose, insulin, potassium protection during the course of hypothermic global ischemia and reperfusion: a new proposed mechanism by the scavenging of free radicals. J Cardiovasc Pharmacol. 1983;5:35–43. doi: 10.1097/00005344-198301000-00005. [DOI] [PubMed] [Google Scholar]
- 33.Noack K, Bronk SF, Kato A, Gores GJ. The greater vulnerability of bile duct cells to reoxygenation injury than to anoxia. Implications for the pathogenesis of biliary strictures after liver transplantation. Transplantation. 1993;56:495–500. doi: 10.1097/00007890-199309000-00001. [DOI] [PubMed] [Google Scholar]
- 34.Ozawa K, Yamaoka Y, Nanbu H, Honjo I. Insulin as the primary factor governing changes in mitochondrial metabolism leading to liver regeneration and atrophy. Am J Surg. 1974;127:669–675. doi: 10.1016/0002-9610(74)90344-4. [DOI] [PubMed] [Google Scholar]
- 35.Starzl TE, Watanabe K, Porter KA, Putnam CW. Effects of insulin, glucagon, and insuling/glucagon infusions on liver morphology and cell division after complete portacaval shunt in dogs. Lancet. 1976;1:821–825. doi: 10.1016/S0140-6736(76)90477-3. [DOI] [PubMed] [Google Scholar]
- 36.Yamada T, Yamamoto M, Ozawa K, Honjo I. Insulin requirements for hepatic regeneration following hepatectomy. Ann Surg. 1977;185:35–42. doi: 10.1097/00000658-197701000-00006. [DOI] [PMC free article] [PubMed] [Google Scholar]
- 37.Xu MQ, et al. Initial clinical effect of intraportal insulin administration on liver graft regeneration in adult patients underwent living donor right lobe liver transplantation. Transplant Proc. 2009;41:1698–1702. doi: 10.1016/j.transproceed.2008.10.094. [DOI] [PubMed] [Google Scholar]
- 38.Callahan LA, Supinski GS. Hyperglycemia-induced diaphragm weakness is mediated by oxidative stress. Crit Care. 2014;18:R88. doi: 10.1186/cc13855. [DOI] [PMC free article] [PubMed] [Google Scholar]
- 39.Ferrando AA, et al. A submaximal dose of insulin promotes net skeletal muscle protein synthesis in patients with severe burns. Ann Surg. 1999;229:11–18. doi: 10.1097/00000658-199901000-00002. [DOI] [PMC free article] [PubMed] [Google Scholar]
- 40.Peduzzi P, Concato J, Feinstein AR, Holford TR. Importance of events per independent variable in proportional hazards regression analysis. II. Accuracy and precision of regression estimates. J Clin Epidemiol. 1995;48:1503–1510. doi: 10.1016/0895-4356(95)00048-8. [DOI] [PubMed] [Google Scholar]
- 41.Wiener RS, Wiener DC, Larson RJ. Benefits and risks of tight glucose control in critically ill adults: a meta-analysis. Jama. 2008;300:933–944. doi: 10.1001/jama.300.8.933. [DOI] [PubMed] [Google Scholar]
Associated Data
This section collects any data citations, data availability statements, or supplementary materials included in this article.
Supplementary Materials
Data Availability Statement
The datasets generated during and/or analyzed during the current study are available from the corresponding author on reasonable request.