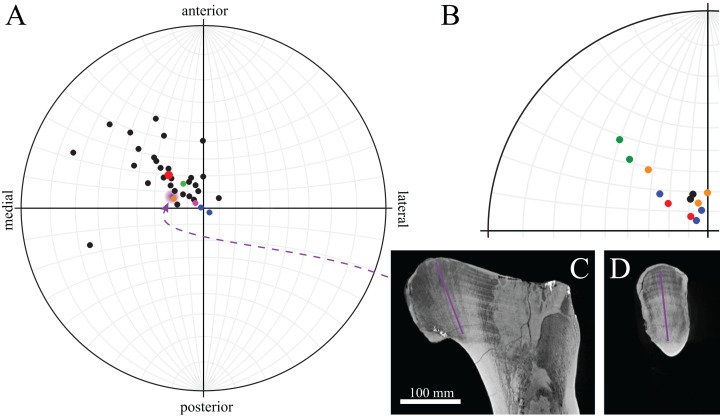
Figure 22. The mean orientation of u1 in the femoral head, referenced in the femur anatomical coordinate system.
This is plotted on an equal-angle stereoplot, with northern hemisphere projection (using StereoNet 9.5; Allmendinger, Cardozo & Fisher, 2013; Cardozo & Allmendinger, 2013). (A) Results for all specimens analysed. Note that for the fossil specimens, only those that were complete and well-preserved, and enabled an anatomical coordinate system to be defined, were analysed. Colour codes: black = birds, pink = human, blue = Masiakasaurus (FMNH PR 2153, UA 8384), orange = Falcarius, green = Troodontidae sp. (MOR 748), purple = general orientation for Allosaurus and the tyrannosaurids, red = mean orientation across birds. (B) Results for species or genera that were multiply sampled often displayed significant instraspecific or intrageneric variation, ranging up to 30.6°. Colour codes: black = ostrich, Struthio camelus, blue = southern cassowary, Casuarius casuarius, orange = emu, Dromaius novaehollandiae, red = chicken, Gallus gallus, green = kiwi, Apteryx spp. (C, D) The orientation of u1 superimposed on the CT scan of a representative tyrannosaur femur (Daspletosaurus torosus, TMP 2001.036.0001) in coronal (C) and sagittal (D) views, illustrating how the orientation data extracted and illustrated in the geometric models (e.g. Fig. 19) qualitatively reflects the observed cancellous bone architecture in the scans.

