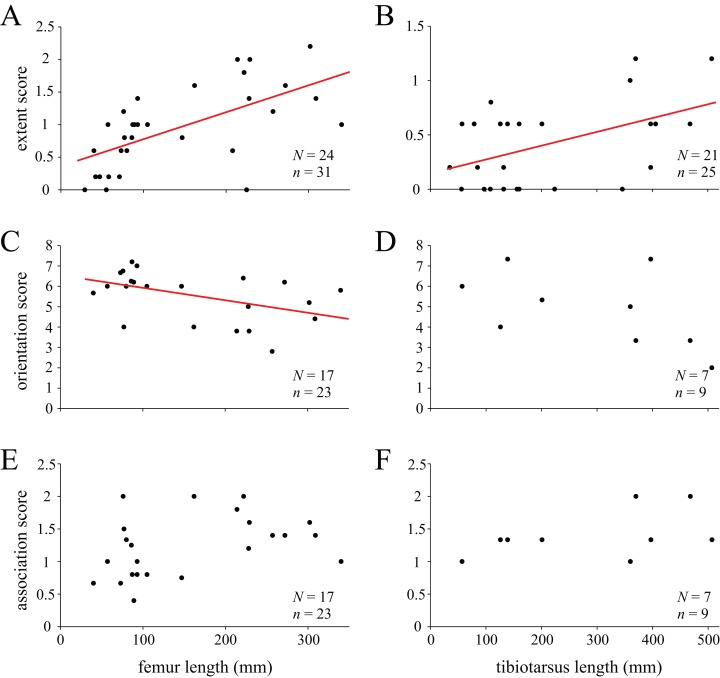
Figure 42. Size-dependent variation in diaphyseal cancellous bone architecture in the femora and tibiae of birds.
These plots compare the results of the categorical scoring of each bone against its length. (A, B) Feature 1 (extent of cancellous bone) in the femur (A) and tibia (B); a higher score indicates greater extent. (C, D) Feature 2 (average orientation of trabeculae) in the femur (C) and tibia (D); a higher score indicates that trabeculae are more perpendicular to the bone’s long-axis. (E, F) Feature 3 (degree of association of trabeculae) in the femur (E) and tibia (F); a higher score indicates that trabeculae tend to be more closely associated with other similar trabeculae. Major axis regression lines are also plotted when correlations were statistically significant. N signifies number of species represented, and n signifies number of individuals. Other statistical metrics for each comparison are reported in Table 2.

