Abstract
Nuclear co-localization labels are critical to ocular research. Among these, the TUNEL assay has been established as a gold standard of cell death and apoptosis. While several validated computer-based methods exist to quantitate these markers, including ImageJ Retina Analysis (RA) Toolkit and ImagePro, none verify the count with the nuclear counter stain to confirm nuclear co-localization. We established a new ImageJ-based automated multichannel thresholding (MCT) method to quantitate nuclear co-localized labeling. The MCT method was validated by comparing it with the two published TUNEL analysis in TUNEL-positive photoreceptors in an experimental retinal detachment (RD) model. RDs were induced in murine eyes and cross-sectional images of TUNEL and DAPI counter stain were obtained. Images were classified as “typical” or high density ”hotspot” TUNEL regions (n = 10/group). Images were analyzed and compared between the MCT method and the published techniques including both ”standard” and ”high” settings of the RA Toolkit for detecting lower or higher TUNEL densities, respectively. Additional testing of the MCT method with built-in ImageJ thresholding algorithms was performed to produce fully automated measurements. All images were compared with Bland-Altman mean difference plots to assess the difference in counts and linear regression plots to assess correlation. Comparison between the MCT method and the ImagePro method were found to be well correlated (typical: R2 = 0.8972, hotspot: R2 = 0.9000) with minor to non-significant differences. The RA Toolkit settings were found to be mostly well correlated as well (standard/typical: R2 = 0.8036, standard/hotspot: R2 = 0.4309, high/typical: R2 = 0.7895, high/hotspot: R2 = 0.8738) but were often found to have significantly higher counts than the MCT. In conclusion, the MCT method compared favorably with validated computer-based methods of nuclear marker immunofluorescence quantitation and avoids staining artifacts through the incorporation of the nuclear counter stain to confirm positive cells.
Keywords: TUNEL, Cell Death, ImageJ, Image Analysis, Apoptosis, Thresholding, Retina, Retinal Detachment
1. Introduction
Nuclear co-localization labels are widely used in biological analyses of cellular and tissue samples throughout the body. Retinal cell death analysis with the TUNEL assay (terminal deoxynucleotidyl transferase (dUTP) nick end labeling) is one of the most commonly performed tests with nuclear co-localization. The assay uses a terminal deoxynucleotidyl transferase enzyme to incorporate fluorescent labeled dUTPs in damaged nucleic acid regions found in apoptotic and sometimes necrotic cells.1, 2
The classic method for TUNEL quantitation is to manually count the number of TUNEL positive (TUNEL+) nuclei in a region. This method has several disadvantages including extensive time and labor investments. Improvements in technique have included the development of semi- and fully automated quantitation programs, such as ImageJ3 and Image-Pro (Media Cybernetics), which are routinely used to quantify apoptotic regions. These programs have been successful in reducing the time and effort of analysis by thresholding4 which selects all color intensity values within a selected range in an image. Maidana et al. improved upon existing ImageJ analysis programs with the introduction and validation of the Retina Analysis (RA) Toolkit macro which automatically segments the retina into the outer nuclear layer (ONL) and the inner nuclear layer (INL) and counts TUNEL+ cells with a standard and a high sensitivity setting to allow measurement of different TUNEL densities5. It includes both “standard” and “high” threshold settings for analyzing “typical” TUNEL regions and denser “hotspot” TUNEL regions, respectively, which present a greater quantitation challenge. Image-Pro is another established method used to measure TUNEL and other nuclear-localized cell counts by including all cells above a manually selected threshold intensity.6–11 Although these methods are time-saving, they quantitate regions based on one color channel without confirmation of nuclear co-localization to ensure nuclear expression of the marker.
Herein we have developed a novel automated/semi-automated batch method, using the multichannel RGB thresholding tool in ImageJ, to combine the nuclear DAPI (4′,6-Diamidino-2-Phenylindole, Dihydrochloride) counter stain information with TUNEL to rapidly detect TUNEL+ nuclear co-localization. This assay is compared with two established methods (ImageJ RA Toolkit macro and Image-Pro) in both “standard” and “hotspot” TUNEL regions and offers another option for rapid quantitation of nuclear-located targets.
2. Methods and Supplies
2.1 Animal and Retinal Detachment Surgery
This research adheres to the principles of the ARVO statement for the Use of Animals in Ophthalmic and Vision Research and was conducted under an Ohio State University IACUC-approved protocol. RDs were induced by subretinal injection of approximately 5μl hyaluronic acid (HA) (10mg/ml, Abbot Medical Optics, Santa Ana, CA, USA) into the left eyes of (16–20 week-old) C57BL/6 female mice (n = 11) as previously described12. Mice were anesthetized with intraperitoneal injection of ketamine (90mg/kg) and xylazine (10mg/kg). Pupils were dilated with tropicamide 1%. Eyes were prepped with betadine and a 30-gauge (g) needle was used to make the entry site for a 33-g, 19-mm custom Hamilton needle (Hamilton Company, Reno, NV, USA), approximately 2mm posterior to the limbus in the superotemporal quadrant. Anterior chamber tab with a 30-g needle was performed to reduce the intraocular pressure prior to injecting HA beneath the retina with the aid of an operating microscope to create a total or near-total RD. Eyes were treated with erythromycin ophthalmic ointment. Untreated right eyes served as controls.
2.2 Enucleation, Fixation, and Sectioning
Anesthetized mice were euthanized and eyes were enucleated with a small opening cut in the temporal limbus to allow better penetration of fixative. Eyes were placed in a fixative containing phosphate buffer with 4% paraformaldehyde and 3% sucrose in 0.1M phosphate buffer at pH 7.4 for 90 minutes. Eyes were washed three times in phosphate buffered saline (PBS) for 15 minutes and placed in 30% sucrose in PBS overnight. The eyes were embedded in optical cutting temperature solution (Electron Microscopy Sciences, Hatfield, PA, USA), snap frozen, and cut into 12-μm sections.
2.3 TUNEL Assay & Microscopy
TUNEL assay was performed according to manufacturer’s instructions (TMR red kit, cat#: 12156792910, Roche) to detect cell death in the retina ONL. The assay stained in the red channel at 568nm. DAPI was applied as a nuclear counter-stain in the blue channel at 461nm. Images were taken with a Leica DM5000B fluorescent microscope and Leica DC500 digital camera at 200× magnification with Leica Application Suite 4.8.0 software. Exposure settings were adjusted to minimize oversaturation.
2.4 Regression Analysis
To validate the MCT method, regression analysis was performed to assess TUNEL+ cells per mm2 values found with the MCT method compared to the two validated methods: RA Toolkit (with both “standard” and “high” settings) and the Image-Pro method. This was performed on detachments with both TUNEL hotspot regions (n=10 mice) and standard regions (n=10 mice). R2 values were found via a simple linear regression in JMP. Spearman ρ values were calculated in JMP along with associated p-values through the multivariate correlation analysis tool where p ≤ 0.05 was considered significant.
2.5 Bland-Altman Mean-Difference Analysis
To assess agreement between the MCT method and the standard methods, Bland-Altman mean-difference values were measured between both RA Toolkit analyses and the Image-Pro analysis against the MCT method, with the matched pairs analysis in JMP. The Wilcoxon signed-rank test was used to assess statistical differences in the plots, where p ≤ 0.05 was considered significant. The normality of the data distribution was determined in JMP by the Shapiro-Wilk test.
3. Detailed Methods
Select images from day 3 RD mice (n=20) were used and categorized as ‘typical’ (n=10) or ‘hotspot’ (n=10) by visual inspection for TUNEL+ regions with a high degree of congruent staining or total coverage across the width of the ONL. Regions of 900×900 pixels were selected and then cropped down to just the ONL with a black background in GIMP 2.813 (Fig. 1A). The red and blue RGB channels were balanced to have a black background, minimize the value of intercellular DAPI signal, and increase the contrast of the images in both channels. These ONL regions were analyzed with 12 methods: the RA Toolkit at (1) the standard threshold setting and (2) the high threshold setting, (3) Image-Pro threshold cell count, the novel multichannel threshold (MCT) method with manual thresholding (4) and combinations of automated methods (5–12) with either the IsoData14, Li15, Mean16, or Otsu17 algorithm for the DAPI channel and either the MaxEntropy18 or RenyiEntropy18, 19 algorithm for the TUNEL channel (Table 1).
Fig. 1.
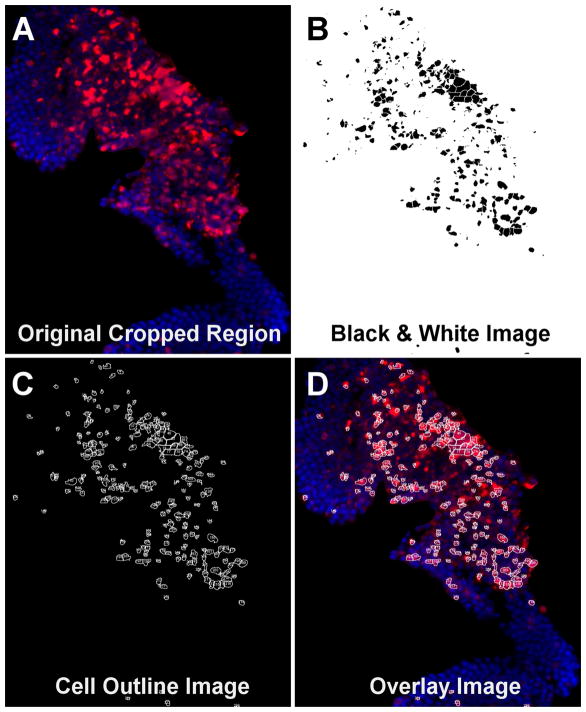
Immunohistochemistry image capture of an example hotspot region showing the TUNEL (red) and DAPI (blue) staining. The RGB cropped ONL region (A) is processed by the ‘Color Threshold’ function in ImageJ by adjusting the red and blue channels to create a black & white image (B) that shows black as a positive region and white as negative space. The black & white image is run through a binary watershed segmentation along with manual watershed adjustment before it is processed by the ‘Analyze Particles’ function in ImageJ to count the positive cells. This creates an outline map of the positive, detected cells (C). The final image (D) is created by overlaying the outline (C) onto the original image (A) to provide a visual assessment of counted TUNEL and DAPI+ cells.
Table 1.
All methods used to analyze selected 20 hotspot and typical TUNEL images.
| Primary Analysis
| |||||
|---|---|---|---|---|---|
| RA Toolkit: Standard (1) & High (2) | ImagePro Method (3) | MCT Method: Manual (4) | |||
|
| |||||
| MCT Automated Analysis | DAPI Thresholding Algorithm
|
||||
| IsoData (ID) | Li | Mean | Otsu | ||
| TUNEL Thresholding Algorithm | MaxEntropy (ME) | ME+ID (5) | ME+Li (6) | ME+Mean (7) | ME+Otsu (8) |
| RenyiEntropy (RE) | RE+ID (9) | RE+Li (10) | RE+Mean (11) | RE+Otsu (12) | |
Abbreviations: ME – MaxEntropy, RE – RenyiEntropy, ID – IsoData.
The RA Toolkit measurements use the red TUNEL channel with the “standard” and “high” threshold settings based on the program’s macros. Image-Pro measurements used a threshold from 90 to 255 on the red channel with automated watershedding. The MCT method used both the blue nuclear counter-stain (DAPI) channel and the red TUNEL channel to detect positive cells with either manual or automated thresholding.
MCT manual method detail
After opening the selected cropped ONL region in ImageJ and using the color thresholding function in the Red/Green/Blue (RGB) mode with dark background selected, both the red and green channels were opened from 0 to 255 while the blue channel was adjusted to best represent positive nuclei. Once the nuclei were chosen, the red channel was set from 90 to 255 to match the Image-Pro measurement settings. The color image was converted into a black and white binary image where the black spots represent candidate cells that are positive in both the DAPI and TUNEL channels. The subsequent binary image was processed with the watershed function with additional manual watershed correction as needed (Fig. 1B). The “analyze particles” function was run on the final corrected binary image and set to “produce outlines” (Fig. 1C) and a “results table” to ascertain cell counts. To verify the accuracy of the measured cells, the outlines were superimposed on top of the original color image to create an overlay (Fig. 1D) showing the final regions counted as cells.
MCT automated method detail
The images were processed as a batch with an in-house ImageJ macro (Appendix A). The macro would open all images with a specified suffix within the selected folder and would carry out all the steps from the manual processing automatically. It would use the specified thresholding algorithm when thresholding the blue (DAPI) and the red (TUNEL) channels. Additionally it would measure the area of the ONL to calculate the count per area. After finishing all the images within the specified folder it would export all the compiled results to an excel file.
4. Results
4.1 Observational Results
Typical TUNEL regions
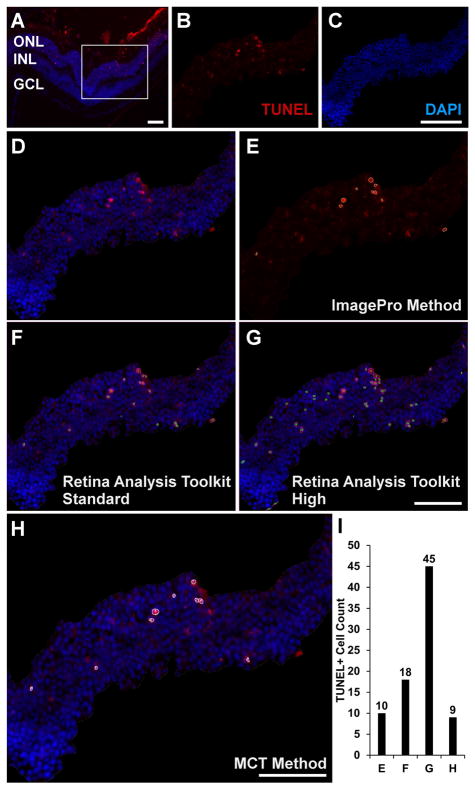
An analysis was performed comparing the MCT method with the RA Toolkit, at both standard and high threshold settings, and with the Image-Pro method in typical TUNEL regions (Fig. 2, n = 10). The original image (Fig. 2A) was processed with each analysis method: (1) the Image-Pro analysis method (10 TUNEL+ cells, Fig. 2E,I), (2) the RA Toolkit “standard” setting (18 TUNEL+ cells, Fig. 2F,I), (3) the RA Toolkit “high” setting (45 TUNEL+ cells, Fig. 2G,I), and (4) the manually thresholded MCT method (9 TUNEL+ cells, Fig. 2H,I) with positive cells indicated by numbered outlines. Visually, the Image-Pro, MCT, and RA Toolkit standard setting methods appeared to generate very similar quantification plots, while the RA Toolkit high setting appeared to over count having a total number of TUNEL+ cells that was 5 times greater the MCT and Image-Pro methods.
Fig. 2.
Immunofluorescence image (A) of a typical TUNEL (red, B) and DAPI (blue, C) region prior to cropping. The white box shows the region of analysis used in (B–H). The merged cropped region (D) was processed with the primary four methods: the ImagePro method (E), the RA Toolkit standard setting (F), the RA Toolkit high setting (G), and the MCT method (H). The corresponding individual total cell counts acquired with each method are shown in (I) where ‘E’ refers to ImagePro, ‘F’ refers to the RA Toolkit standard setting, ‘G’ refers to the RA Toolkit high setting, and ‘H’ refers to the MCT method. Scale bar denotes 50μm. Abbreviations: ONL – outer nuclear layer, INL – inner nuclear layer, GCL – ganglion cell layer.
Hotspot TUNEL regions
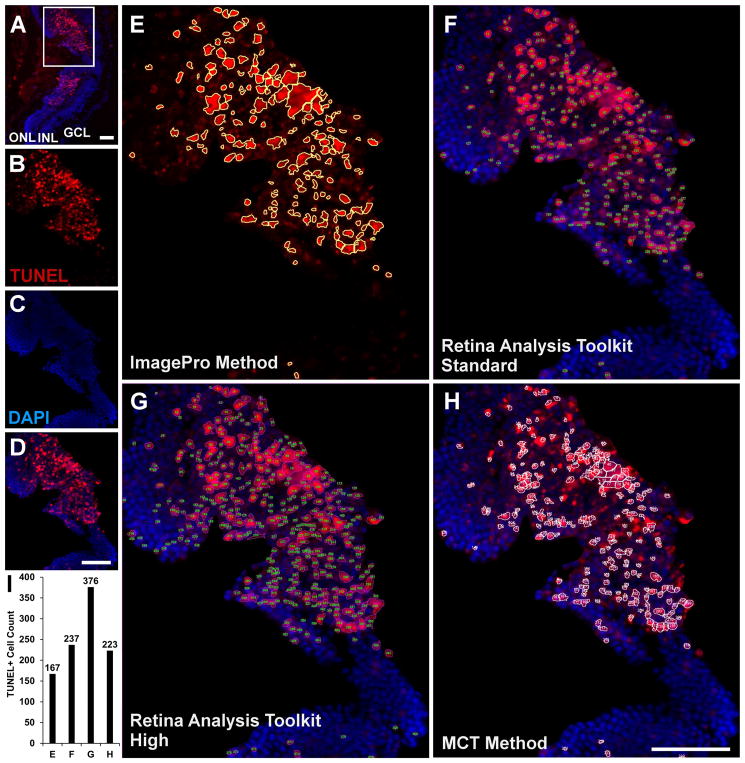
Analysis results of the MCT method were compared with The RA Toolkit, at both standard and high threshold settings, and with the Image-Pro method in hotspot TUNEL regions (Fig. 3, n = 10/group). The original image (Fig. 3A) was processed with each analysis method: (1) the Image-Pro analysis method (167 TUNEL+ cells, Fig. 3E,I), (2) the RA Toolkit on the standard setting (237 TUNEL+ cells, Fig. 3F,I), (3) the RA Toolkit on the high setting (376 TUNEL+ cells, Fig. 3G,I), and (4) the manually thresholded MCT method (223 TUNEL+ cells, Fig. 3H,I). Visually, the MCT method most closely matched the RA Toolkit standard method, while the Image-Pro method appeared to undercount the total number of cells, with multiple cells counted as a single cell. As with the typical region analysis, the RA Toolkit high setting appeared to over count TUNEL+ cells.
Fig. 3.
Immunofluorescence image (A) of a hotspot TUNEL (red, B) and DAPI (blue, C) region prior to cropping. The white box shows the region of analysis used in (B–H). The merged cropped region (D) was processed with the primary four methods: the ImagePro method (E), the RA Toolkit standard setting (F), the RA Toolkit high setting (G), and the MCT method (H). The corresponding individual total cell counts acquired with each method are shown in (I) where ‘E’ refers to ImagePro, ‘F’ refers to the RA Toolkit standard setting, ‘G’ refers to the RA Toolkit high setting, and ‘H’ refers to the MCT method. Scale bar denotes 50μm. Abbreviations: ONL – outer nuclear layer, INL – inner nuclear layer, GCL – ganglion cell layer.
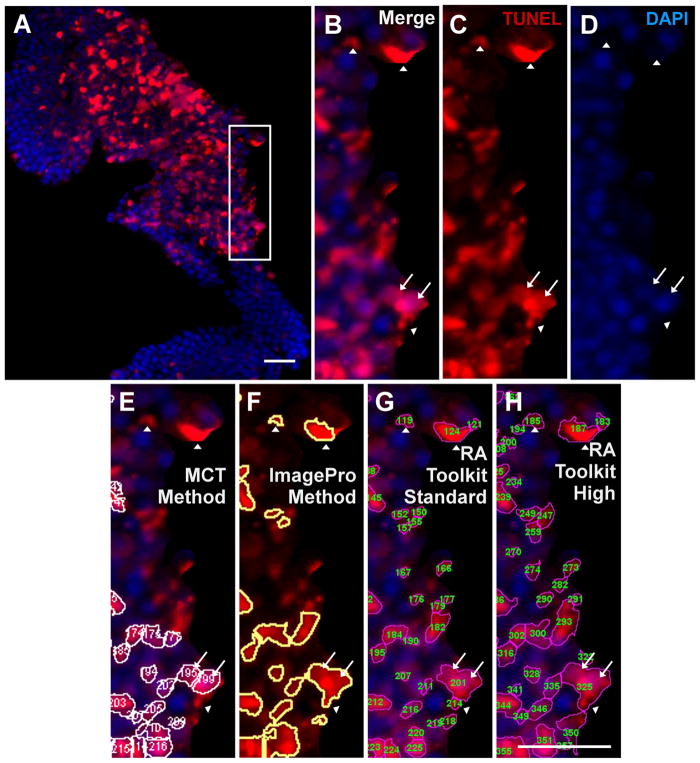
To further inspect whether the different methods identified co-localization of TUNEL with the nucleus, a side-by-side visual comparison of insets of merged images from each method was performed (Fig. 4). Typical examples of counting errors with the non-MCT methods are shown in a magnified region (Fig. 4B–H) which is an inset of the hotspot region from figure 3 (Fig. 4A). This figure highlights an example of an area counted as a TUNEL positive cell by one or more of the verified analysis methods, but not the MCT method, indicated with white arrowheads. These counts had no corresponding nuclear DAPI signal, indicating that the TUNEL signal we observed is likely to be an artifact rather than a legitimate cell. In addition, an example of a cluster of 2 DAPI positive cells that were counted as a single cell by the verified methods, but not the MCT method, is indicated by white arrows (Fig. 4B–H).
Fig. 4.
Immunofluorescence image (A) of the hotspot TUNEL region shown previously. The white box indicates the magnified region (B–H). The merged (B), TUNEL (C), and DAPI (D) channels are shown with no analysis overlays. The following analysis methods are shown with the counted cells overlaid with outlines: the manual MCT method (E), the ImagePro method (F), the RA Toolkit standard setting (G), and the RA Toolkit high setting (H). White arrowheads indicated regions where there exists positive TUNEL signal but no positive DAPI signal. White arrows indicate a regions of conjoined TUNEL signal but with two distinct nuclei. Scale bar denotes 50μm.
4.2 Analytic Results
Typical TUNEL regions
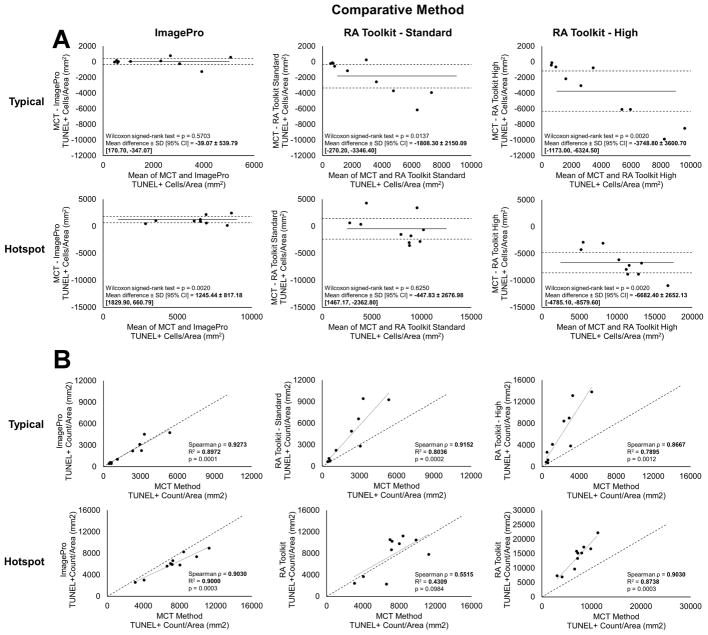
In typical TUNEL regions when using the Bland-Altman mean difference plot, the Image-Pro method showed good agreement with the MCT method, showing no significant difference (p = 0.5703, Fig 5A). Additionally, the two methods showed good correlation on linear regression analysis (p = 0.0001, R2 = 0.8972, Spearman ρ = 0.9273, Fig 5B) and were almost completely aligned with the 1:1 reference line. In contrast, the RA Toolkit, was significantly different in the mean difference test at both threshold sensitivities (standard: p = 0.0137, high: p = 0.0020, Fig 5A) with the MCT method counting fewer TUNEL+ cells than the RA Toolkit in both cases. The linear regression analysis still shows a significant correlation between the methods (standard: p = 0.0002, R2 = 0.8036, Spearman ρ = 0.9152, high: p = 0.0012, R2 = 0.7895, Spearman ρ = 0.8667, Fig 5B) but the MCT method counted fewer TUNEL+ cells than either RA Toolkit threshold sensitivity, as the regression fit line’s slope is greater than the 1:1 reference line.
Fig. 5.
Bland-Altman mean-difference plots for TUNEL+ cells//mm2 show agreement between the manually thresholded MCT method, the ImagePro method, and the RA Toolkit standard and high settings in both typical and hotspot image types (A). Solid lines represent the mean difference. Dashed lines represent the 95% limit of agreement (± 1.96 SD). Regression analysis of TUNEL+ cells/mm2 detected by the MCT method versus the ImagePro method and the RA Toolkit standard and high threshold settings in both typical and hotspot image types (B). Dotted lines represent the linear regression trendline. Dashed lines represent a perfect one-to-one correlation for comparison.
Hotspot TUNEL regions
In hotspot TUNEL regions when using the Bland-Altman mean difference plot, good agreement was found between the MCT method and RA Toolkit standard setting (p = 0.6250, Fig 5A) while the comparison between the MCT method and the ImagePro method shows a significant positive difference (p = 0.0020, Fig 5A). As with the typical regions, the RA Toolkit high setting shows a significant negative difference (p = 0.0020, Fig 5A). The linear regression shows significant correlation between the MCT method and both the ImagePro method and the RA Toolkit high setting (p = 0.0003, R2 = 0.9000, Spearman ρ = 0.9030; p = 0.0003, R2 = 0.8738, Spearman ρ = 0.9030, respectively, Fig 5B). The linear regression between the MCT method and the RA Toolkit standard setting has a fit line near the 1:1 reference line but was not significantly correlated (p = 0.0984, R2 = 0.4309, Spearman ρ = 0.5515, Fig 5B).
4.3 Algorithmic Processing
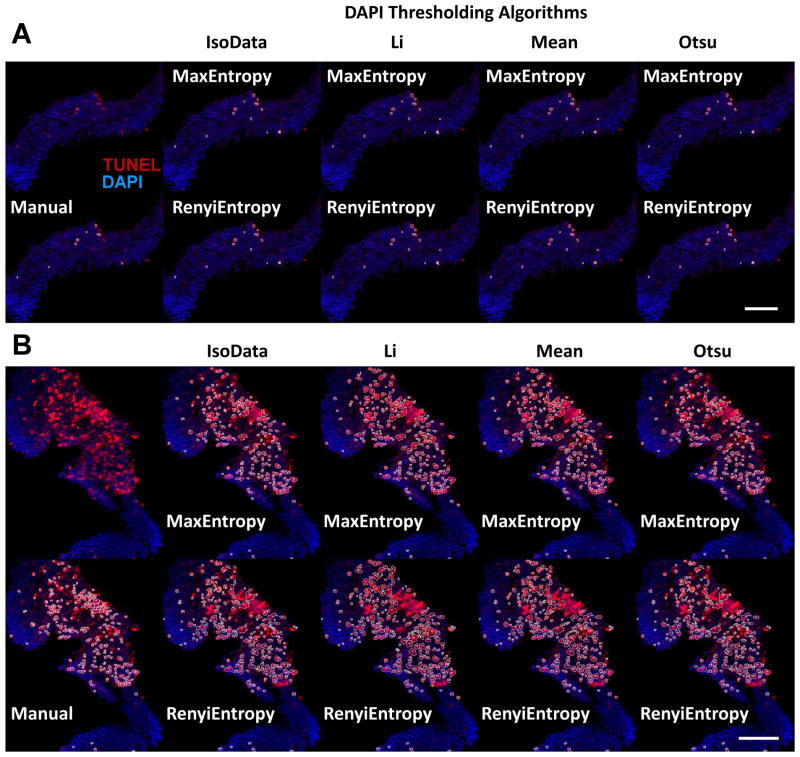
Further work was performed to improve the speed and efficiency of TUNEL analysis. With Image-Pro the analysis of cropped images took approximately 1 hour, while the manually-thresholded MCT method took approximately 2 hours to analyze all 20 images. Using an in-house macro for ImageJ (Appendix A), all 20 images were processed by all eight combinations of the four DAPI thresholding algorithms and the two TUNEL thresholding algorithms (Table 1) in under three minutes. The MCT method may require more time due to the process of manually inspecting the hotspot regions and separating any conjoined cells. The RA Toolkit is faster but still requires the user to open each file separately in ImageJ. The eight automated methods are compared to the manual MCT method in typical regions producing relatively similar counts (Fig. 6A). Hotspot region measurements were compared between the automated and manual MCT methods with more differing results (Fig. 6B). Most of the automated methods did not count any cells in the central region due to the watershed function being unable to reduce the size of that region within the set cell size limits.
Fig. 6.
Immunofluorescence images of typical TUNEL+ regions thresholded by manual and automated MCT methods (A). Immunofluorescence images of hotspot TUNEL+ regions thresholded by manual and automated MCT methods (B). For both A and B, the first column shows the cropped region with no analysis outlines (top) and the outlines of the manual MCT method (bottom). On subsequent columns the top row is thresholded with the MaxEntropy algorithm while the bottom row is thresholded with the RenyiEntropy algorithm. The second column uses the IsoData algorithm to threshold the DAPI+ cells, the third column uses the Li algorithm, the fourth column uses the Mean algorithm, and the fifth column uses the Otsu algorithm. Scale bar denotes 50μm.
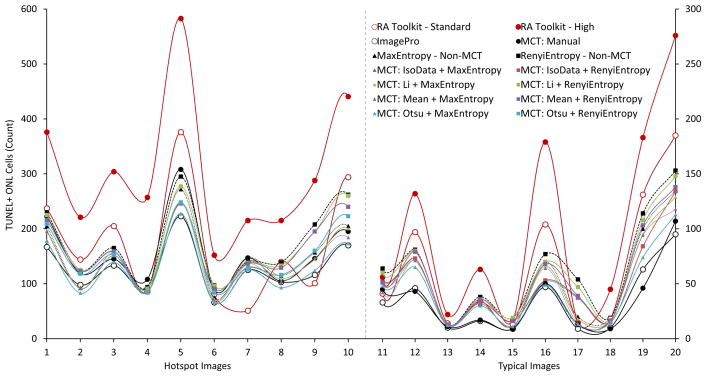
A full comparison of all 12 analysis methods including the two TUNEL thresholding algorithms without use of the MCT method (Fig. 7). Noticeably all automated MCT methods fall below their respective thresholding algorithm without using the MCT method. Additionally, the RA Toolkit high setting is almost always produces the highest count and the standard setting counts between the high setting and all the other methods around half of the time. The ImagePro method usually falls below the automated and manual MCT methods. The respective position of the manually thresholded MCT method and the automated MCT methods is difficult to draw any firm conclusions due to the high degree of variability between the various images.
Fig. 7.
TUNEL+ cell counts for all analysis methods. Images 1 through 10 represent hotspot regions while images 11 through 20 represent typical regions. Hotspot cell count scale to the left y-axis from 0 to 600 while typical cell counts scale to the right y-axis from 0 to 300. The primary analysis methods are represented by dots and full lines (RA Toolkit standard – open red circle, RA Toolkit high – filled red circle, ImagePro – open black circle, MCT: Manual – filled black circle). All methods utilizing the MaxEntropy algorithm are represented by triangles while methods utilizing the RenyiEntropy algorithm are represented by squares. The count using MaxEntropy without the MCT method is represented by a black triangle with a dotted line while the count using RenyiEntropy without the MCT method is represented by a black square with a dashed line. The subsequent automated MCT methods are colored according to the DAPI thresholding algorithm used (IsoData – Red, Li – Green, Mean – Purple, Otsu – Blue).
5. Potential Pitfalls and Trouble Shooting
Cell death and apoptosis are crucial components of many diseases of the eye, such as retinal detachment (RD)7, 20–22, diabetic retinopathy21, 23, 24, retinitis pigmentosa21, 25, and glaucoma21, 26. Measuring retinal apoptosis allows us to quantify disease severity, better understand pathogenesis, and test the effectiveness of potential therapeutic treatments.. Quantitating regions of high TUNEL density known as ‘hotspots’ without taking into account nuclear positivity may produce inaccurate results. Multiple adjacent cells can appear to be merged together decreasing the number of observed cells. In most cases, this can be remedied through the use of a ‘watershed’ function which splits the merged cells into individual, separate cells for a more accurate count27. However, watershedding alone cannot compensate for the high density observed in TUNEL hotspots, resulting in underestimated cell death totals. Additionally seemingly TUNEL+ cells will be counted without any corresponding nuclear stain indicating a potential staining artifact that is not a real cell.
In this study, we developed the MCT method, a technique that allows for increased confidence when counting TUNEL+ cells or potentially cells with other markers localized to the nucleus. When comparing the MCT method to an ImagePro based analysis method where a single threshold is taken at a consistent value on the channel representing the marker of interest, they appear identical in typical regions and the MCT method counts slightly more in hotspot regions. The very similar results in both methods may be due in large part to the use of identical threshold values which were manually entered inputs. In hotspot regions, the MCT method minimized undercounting in clusters of positive cells by selecting TUNEL+ nuclei that co-localize with the marker that may otherwise be counted as single large cells. The RA Toolkit “high” setting consistently over-counted the number of positive cells in both hotspots and typical images in our dataset, while the “standard” setting produced a similar count of cells as the MCT method in hotspot regions and over-counted in the typical regions. As the measured cell density increased, the differences between the RA Toolkit and the MCT method increased in kind.
To evaluate fully automated methods capable of batch processing, separate algorithms available in ImageJ were used to evaluate all 10 hotspot and 10 typical TUNEL images (Fig. 6). Two different sets of algorithms were used, one for blue DAPI thresholding and one for red TUNEL thresholding. The software is capable of using different algorithms for each channel for the MCT analysis. These algorithms were determined by running select images through every available algorithm in ImageJ and eliminating all that produced inaccurate or erroneous results for each color channel. The best four algorithms for thresholding the blue DAPI channel were: 1) IsoData, an algorithm that thresholds at the average of the average of all background pixels and all foreground pixels14, 2) Li, an algorithm that utilizes Kullback’s minimum cross-entropy principle where the cross-entropy between pixels in the background and the foreground are minimized15, 3) Mean, an algorithm that uses the mean grey level as the thresholding point16, and 4) Otsu, an algorithm that selects a thresholding point that minimizes the variance in the background pixels and the foreground pixels17. In the case of the red TUNEL channel, the two best algorithms were found to be 1) MaxEntropy, an algorithm that selects the thresholding point such that the entropy is maximized in both the background and foreground regions18, 19, and 2) RenyiEntropy, an algorithm that utilizes Renyi’s entropy28 to generate the thresholding point19.
Generally the lower the overall count of cells, the more closely the automated methods would match with the manual MCT measurement. When comparing all methods used we see that the RA Toolkit high setting (Fig. 7) is consistently the highest count, while the RA Toolkit standard setting is usually between the MCT methods and the RA Toolkit high setting. The Image-Pro method trended towards the bottom of the group in terms of cell count. The automated TUNEL analysis with DAPI thresholding had lower counts than those without the MCT DAPI selection (Fig. 7). It is difficult to say which method better encapsulates the true count for each image.
The manual MCT method uses direct user observation to select the thresholds and add additional cell separation as needed making it the closest method to the gold standard of fully manual cell counting. However, this can take more time than the other methods; it took twice as long as using ImagePro and 40 times as long as the automated methods to process all 20 images.
A major caveat in counting TUNEL+ hotspot regions is the presence of large contiguous areas that cannot be separated into individual cells through traditional methods. These areas can be caused by intense levels of cell death in close proximity or by oversaturation of a region due to efforts to maintain the same camera and exposure settings during image acquisition. When thresholding an image and converting to a black & white binary image, there is no mechanism for the program to isolate individual cells from a contiguous hotspot region. The region will be divided into one or a few large selections with sizes greater than the pre-set cell threshold size limits for quantitation. This results in undercounting the cells in these regions. This problem is directly observable in Fig. 3E and Fig 6B. Adding the nuclear stain into the analysis reduces this contiguous area into more manageable cell-shaped regions for easier separation during manual post-watershed adjustment. One reason the automated methods have difficulty with these areas is uneven DAPI staining across the retina. In most examples the DAPI is much brighter on the exterior edge of the ONL than the interior edge. This could lead to artifacts based on the anatomical location.
In retinal detachment research, TUNEL analysis is performed for the ONL since it is the retinal layer of interest for cell death. Many groups crop the layer of interest for image analysis. Although the RA Toolkit has an automatic ONL and INL separation feature, this feature did not work with our selected images, incorrectly selecting the entire retina for the ONL and INL counts. We had to use the manual freehand selection mode to select the cropped ONL region of interest. The background elimination step, which was performed uniformly for all images, was important to enhance the contrast in both channels. If this step was not completed, the RA Toolkit would falsely measure cells along the cropped edge where fluorescent signal from the background would be contiguous with the black background of the cropped region.
Future directions to improve ImageJ macros and eliminate artifacts could be developed in several areas. Incorporating the MCT DAPI selection method into the RA Toolkit would be a priority. The RA Toolkit was able to maintain a highly specific selection of the region of interest in hotspots (Fig. 4G). Combining this technique with the MCT method would produce a good selection of the entire cell and more confidently reflect the true count. Other areas of improvement could be the increased customization of macros, such as an option to pause the program to make custom adjustments before the program runs the final count analysis and an option to choose whether or not to run automatic layer selection.
In conclusion, we have developed a new method to more confidently and rapidly count nuclear co-localized markers using data from “real-world” images of TUNEL+ photoreceptors co-localized with a DAPI nuclear counter-stain in an experimental murine retinal detachment model. This method has application not only for the quantification of TUNEL+ cells to assess cell death but also to aid in the measurement of 1) other nuclear co-localized markers or 2) for markers that fit within a boundary of a second marker. Future work should include further development of the MCT method as a freely available, fully automatic, and user-friendly macro with either improvements to our in-house ImageJ macro or combination with other available analysis tools.
Supplementary Material
Highlights.
Current cell death analysis methods do not verify cells with nuclear counterstain
This can lead to artificial or false-positive results
Multichannel thresholding allows counting of nuclear verified cells
Compared favorably to multiple verified and published methods
Automated thresholding algorithms allows rapid and efficient batch analysis
Acknowledgments
The authors acknowledge funding support from NEI Award Number K08EY022672, OSU Department of Ophthalmology and Visual Science, the Ohio Lions Eye Research Foundation, and the Norbert Peiker Lions Eye Research Fellowship. The authors acknowledge support from the following research assistants: Anchshana Haridas and Olla Nayal.
Abbreviations
- DAPI
4′,6-Diamidino-2-Phenylindole, Dihydrochloride
- HA
Hyaluronic acid
- INL
Inner Nuclear Layer
- MCT
MultiChannel Thresholding
- ONL
Outer Nuclear Layer
- PBS
Phosphate buffered saline
- RD
Retinal Detachment
- TUNEL
terminal deoxynucleotidyl transferase (dUTP) nick end labeling
Footnotes
Publisher's Disclaimer: This is a PDF file of an unedited manuscript that has been accepted for publication. As a service to our customers we are providing this early version of the manuscript. The manuscript will undergo copyediting, typesetting, and review of the resulting proof before it is published in its final citable form. Please note that during the production process errors may be discovered which could affect the content, and all legal disclaimers that apply to the journal pertain.
References
- 1.Gavrieli Y, Sherman Y, Bensasson SA. Identification of programmed cell death in situ via specific labeling of nuclear DNA fragmentation. J Cell Biol. 1992;119(3):493–501. doi: 10.1083/jcb.119.3.493. [DOI] [PMC free article] [PubMed] [Google Scholar]
- 2.Graslkraupp B, Ruttkaynedecky B, Koudelka H, Bukowska K, Bursch W, Schultehermann R. In situ detection of fragmented DNA (TUNEL assay) fails to discriminate among apoptosis, necrosis, and autolytic cell death: a cautionary note. Hepatology. 1995;21(5):1465–8. doi: 10.1002/hep.1840210534. [DOI] [PubMed] [Google Scholar]
- 3.Schneider CA, Rasband WS, Eliceiri KW. NIH Image to ImageJ: 25 years of image analysis. Nat Methods. 2012;9(7):671–5. doi: 10.1038/nmeth.2089. [DOI] [PMC free article] [PubMed] [Google Scholar]
- 4.Tsai WH. Moment-Preserving Thresholding: A New Approach. Computer Vision Graphics and Image Processing. 1985;29(3):377–93. [Google Scholar]
- 5.Maidana DE, Tsoka P, Tian B, Dib B, Matsumoto H, Kataoka K, et al. A Novel ImageJ Macro for Automated Cell Death Quantitation in the Retina. Invest Ophthalmol Vis Sci. 2015;56(11):6701–8. doi: 10.1167/iovs.15-17599. [DOI] [PMC free article] [PubMed] [Google Scholar]
- 6.Fischer AJ, Scott MA, Zelinka C, Sherwood P. A Novel Type of Glial Cell in the Retina is Stimulated by Insulin-Like Growth Factor 1 and may Exacerbate Damage to Neurons and Muller Glia. Glia. 2010;58(6):633–49. doi: 10.1002/glia.20950. [DOI] [PMC free article] [PubMed] [Google Scholar]
- 7.Cebulla CM, Zelinka CP, Scott MA, Lubow M, Bingham A, Rasiah S, et al. A Chick Model of Retinal Detachment: Cone Rich and Novel. PLoS One. 2012;7(9):12. doi: 10.1371/journal.pone.0044257. [DOI] [PMC free article] [PubMed] [Google Scholar]
- 8.Gallina D, Zelinka CP, Cebulla CM, Fischer AJ. Activation of glucocorticoid receptors in Muller glia is protective to retinal neurons and suppresses microglial reactivity. Exp Neurol. 2015;273:114–25. doi: 10.1016/j.expneurol.2015.08.007. [DOI] [PMC free article] [PubMed] [Google Scholar]
- 9.Gallina D, Zelinka C, Fischer AJ. Glucocorticoid receptors in the retina, Muller glia and the formation of Muller glia-derived progenitors. Development. 2014;141(17):3340–51. doi: 10.1242/dev.109835. [DOI] [PMC free article] [PubMed] [Google Scholar]
- 10.Todd L, Palazzo I, Squires N, Mendonca N, Fischer AJ. BMP- and TGF beta-signaling regulate the formation of Muller glia-derived progenitor cells in the avian retina. Glia. 2017;65(10):1640–55. doi: 10.1002/glia.23185. [DOI] [PMC free article] [PubMed] [Google Scholar]
- 11.Todd L, Squires N, Suarez L, Fischer AJ. Jak/Stat signaling regulates the proliferation and neurogenic potential of Muller glia-derived progenitor cells in the avian retina. Scientific Reports. 2016;6:16. doi: 10.1038/srep35703. [DOI] [PMC free article] [PubMed] [Google Scholar]
- 12.Kim B, Abdel-Rahman MH, Wang T, Pouly S, Mahmoud AM, Cebulla CM. Retinal MMP-12, MMP-13, TIMP-1, and TIMP-2 Expression in Murine Experimental Retinal Detachment. Invest Ophthalmol Vis Sci. 2014;55(4):2031–40. doi: 10.1167/iovs.13-13374. [DOI] [PMC free article] [PubMed] [Google Scholar]
- 13.Kimball S, Mattis P. GNU Image Manipulation Program. 1997–2018 wwwgimporg.
- 14.Ridler TW, Calvard S. PICTURE THRESHOLDING USING AN ITERATIVE SELECTION METHOD. IEEE Trans Syst Man Cybern. 1978;8(8):630–2. [Google Scholar]
- 15.Li CH, Tam PKS. An iterative algorithm for minimum cross entropy thresholding. Pattern Recognit Lett. 1998;19(8):771–6. [Google Scholar]
- 16.Glasbey CA. AN ANALYSIS OF HISTOGRAM-BASED THRESHOLDING ALGORITHMS. Cvgip-Graphical Models and Image Processing. 1993;55(6):532–7. [Google Scholar]
- 17.Otsu N. A Threshold Selection Method from Gray-Level Histograms. IEEE Transactions on Systems, Man, and Cybernetics. 1979;9(1):62–6. [Google Scholar]
- 18.Kapur JN, Sahoo PK, Wong AKC. A NEW METHOD FOR GRAY-LEVEL PICTURE THRESHOLDING USING THE ENTROPY OF THE HISTOGRAM. Computer Vision Graphics and Image Processing. 1985;29(3):273–85. [Google Scholar]
- 19.Sahoo P, Wilkins C, Yeager J. Threshold selection using Renyi’s entropy. Pattern Recognition. 1997;30(1):71–84. [Google Scholar]
- 20.Fisher SK, Lewis GP, Linberg KA, Verardo MR. Cellular remodeling in mammalian retina: results from studies of experimental retinal detachment. Prog Retin Eye Res. 2005;24(3):395–431. doi: 10.1016/j.preteyeres.2004.10.004. [DOI] [PubMed] [Google Scholar]
- 21.Cuenca N, Fernandez-Sanchez L, Campello L, Maneu V, De la Villa P, Lax P, et al. Cellular responses following retinal injuries and therapeutic approaches for neurodegenerative diseases. Prog Retin Eye Res. 2014;43:17–75. doi: 10.1016/j.preteyeres.2014.07.001. [DOI] [PubMed] [Google Scholar]
- 22.Chang CJ, Lai WW, Edward DP, Tso MOM. Apoptotic Photoreceptor Cell-Death After Traumatic Retinal-Detachment in Humans. Arch Ophthalmol. 1995;113(7):880–6. doi: 10.1001/archopht.1995.01100070054025. [DOI] [PubMed] [Google Scholar]
- 23.Lieth E, Gardner TW, Barber AJ, Antonetti DA Penn State Retina Res G. Retinal neurodegeneration: early pathology in diabetes. Clin Exp Ophthalmol. 2000;28(1):3–8. doi: 10.1046/j.1442-9071.2000.00222.x. [DOI] [PubMed] [Google Scholar]
- 24.Abu El-Asrar AM, Dralands L, Missotten L, Al-Jadaan I, Geboes K. Expression of apoptosis markers in the retinas of human subjects with diabetes. Invest Ophthalmol Vis Sci. 2004;45(8):2760–6. doi: 10.1167/iovs.03-1392. [DOI] [PubMed] [Google Scholar]
- 25.Li ZY, Kljavin IJ, Milam AH. Rod photoreceptor neurite sprouting in retinitis pigmentosa. J Neurosci. 1995;15(8):5429–38. doi: 10.1523/JNEUROSCI.15-08-05429.1995. [DOI] [PMC free article] [PubMed] [Google Scholar]
- 26.Nork TM, Ver Hoeve JN, Poulsen GL, Nickells RW, Davis MD, Weber AJ, et al. Swelling and loss of photoreceptors in chronic human and experimental glaucomas. Arch Ophthalmol. 2000;118(2):235–45. doi: 10.1001/archopht.118.2.235. [DOI] [PubMed] [Google Scholar]
- 27.Soille P, Vincent L. In: Determining watersheds in digital pictures via flooding simulations. Kunt M, editor. Bellingham: Spie - Int Soc Optical Engineering; 1990. pp. 240–50. [Google Scholar]
- 28.Renyi A, editor. On Measures of Entropy and Information. Proceedings of the Fourth Berkeley Symposium on Mathematical Statistics and Probability, Volume 1: Contributions to the Theory of Statistics; 1961; Berkeley, Calif: University of California Press; [Google Scholar]
Associated Data
This section collects any data citations, data availability statements, or supplementary materials included in this article.


