

Abstract
Background:
Evidence suggests education is an important lifecourse determinant of health, but few studies examine differential returns to education by sociodemographic subgroup.
Methods:
Using National Longitudinal Survey of Youth 1979 (N=6,158) cohort data, we evaluate education attained by age 25 and mental (MCS) and physical (PCS) health component summary scores at age 50. Race/ethnicity, sex, geography, immigration status, and childhood socioeconomic status (cSES) were evaluated as effect modifiers in birth-year adjusted linear regression models.
Results:
The association between education and PCS was large among high cSES respondents (β=0.81 per year of education, 95%CI: 0.67,0.94), and larger among low cSES respondents (interaction β=0.39, 95%CI: 0.06,0.72). The association between education and MCS was imprecisely estimated among White men (β =0.44; 95%CI: −0.03,0.90), while, Black women benefited more from each year of education (interaction β =0.91; 95%CI: 0.19,1.64). Similarly, compared to socially advantaged groups, low cSES Blacks, and low and high cSES women benefited more from each year of education, while immigrants benefited less from each year of education.
Conclusions:
If causal, increases in educational attainment may reduce some social inequities in health.
Keywords: educational status, ethnic groups, immigrants, socioeconomic factors, health status disparities, sex
Introduction
Substantial evidence suggests education is an important social determinant of health over the lifecourse1,2, however, little work has examined potential differential returns to education by sociodemographic factors such as sex, race / ethnicity, socioeconomic status, geography, or immigration status. The implicit assumption in conventional analyses is that the effect of education is homogenous across diverse demographic groups; in addition to being at odds with current theories such as intersectionality3, there is also empirical evidence of differential returns to education. For example, compared to men, women benefit more from each year of education in predicting mental health4, while Black women benefit more than Black men and Whites from increases in education quality in predicting blood pressure5. Alternatively, Whites seem to benefit more than Blacks from education in predicting obesity6 and current smoking7, and the education-health gradient is flatter (i.e. lower health returns to education) for Hispanics / Latinos8,9 and immigrants10 than for other groups.
Although relatively little work examines differential returns to education by sociodemographic factors, we know health is strongly patterned by social factors such as childhood SES (cSES), race / ethnicity, sex, geography, and immigration status. Research on the “long arm” of childhood disadvantage demonstrates that individuals who experience low cSES also have worse health in adulthood11 and earlier mortality12, suggesting it may not be possible to fully ameliorate adverse exposures in early life. Racial disparities in a variety of health outcomes are well documented13,14. Women tend to live longer than men15, however, they experience worse mental health16. Health also varies by geography such that people in rural areas experience worse health than those in urban areas17, while individuals in the U.S. South experience worse health than individuals in other areas of the country18. Finally, health varies by immigration status such that Hispanic / Latino immigrants to the United States have lower mortality than native-born Hispanics / Latinos19,20.
Motivated by the theories of resource substitution4 and intersectionality3, we examine differential returns to education by sex, race / ethnicity, cSES, geography, and immigration status. Resource substitution suggests that individuals who are marginalized within society will benefit more from education because they are prevented from accessing alternative health-promoting resources such as power, authority, earnings, etc. (potential mediators of the education-health relationship; Figure 1), making socially marginalized groups more dependent on the resources to which they do have access (e.g. education). Resource substitution suggests socially vulnerable individuals will benefit more from each year of education (i.e. have larger differential returns to education) than socially advantaged individuals
Figure 1.

Pathways through which sociodemographic factors may lead to differential returns to education
Figure adapted from Cohen and Syme 2013.
Differential returns to education may arise because groups that are socially marginalized due to race / ethnicity, sex, childhood socioeconomic status (cSES), immigration status, and / or geography have less access to important health-promoting alternatives to education (quality or quantity), such as power, authority, earning, knowledge, etc., which are also potential mediators of the education – health relationship. Lack of access to alternative health-promoting resources may result in increased dependence on the resources to which one has access (e.g. education), potentially contributing to larger returns to education for socially marginalized groups.
Intersectionality offers a potential explanation for the non-additive effects of race and gender3, such as prior work suggesting structural racism is particularly punishing for Black men5,21–24.Intersectionality theory formalizes the idea that the experience of being both Black and male are unique from those of Blacks overall and males overall; that is, we cannot sum the regression coefficients of “Black” and “male” to understand the experiences of Black men. Given that race, sex, and socioeconomic status can intersect in complex ways25–27, we examine potential differential returns to education at the intersection of these identities.
Understanding differential returns to education is important for identifying solutions to health inequities. If certain vulnerable sociodemographic groups benefit more than socially advantaged groups (i.e. high SES White men) from each year of education in predicting health outcomes, programs and policies that increase educational attainment, such as Pell Grants, could be a powerful mechanism to reduce health inequities. If, on the other hand, certain sociodemographic groups benefit less then White men from each year of education in predicting health outcomes, programs and policies that increase educational attainment may lead to an exacerbation of health inequities.
Methods
Sample
Data come from the National Longitudinal Survey of Youth 1979 cohort; we use outcome data through the 2014 wave of data collection (N = 7,071 eligible for analysis). We excluded 83 individuals who were missing data on the exposure (i.e. did not report their educational attainment between ages 23– 25, see below for details), 74 who were missing data on the outcomes, 743 who were missing data on one or more of the confounders, and 13 individuals who reported less than 7 years of education (to reduce the effect these outliers would have on our results), yielding a total analytic sample of 6,158 (87.1%).
Exposure
We operationalized education as the highest level completed by age 25 years (0 – 20 years of education); if education was missing at age 25 (N = 683), we used highest level at age 24 (N = 624), then age 23 (N = 59). Because we were interested in evaluating effect modification, it was important to specify the best primary model for education. We considered several options for operationalizing the associations between education and each outcome motivated by prior literature, including nonparametric (i.e. an indicator variable for each year of education), continuous, credentials (i.e. less than high school, high school graduate, college graduate, etc.), and a spline with a knot at 12 years and allowing for a discontinuity at 16 years28. We also evaluated a data-driven approach (one for each outcome, see Appendix Figure 1 for details and plots) based on the mean outcome for each year of education ≥ 7 years (below 7 years were excluded due to data sparseness). The best model specification was selected based on the lowest Bayesian information criterion (BIC) and Akaike information criterion (AIC) for each outcome and interpretability (see Appendix Table 1 for details). We operationalized education continuously for the physical health component summary score (PCS), and used a data-driven approach for the mental health component summary score (MCS), with education linearly related to MCS until 13 years of school, and no additional benefit of education above 13 years (see Appendix Figure 1, and Appendix Table 1 for more information).
Outcomes
Our primary outcomes were the physical health component summary score (PCS) and mental health component summary score (MCS) from the 12-item short form survey (SF-12), at age 50. These self reported measures of physical health include such questions as (paraphrased): 1) Does your health now limit you from climbing several flights of stairs? response options: yes, limited a lot; yes, limited a little; no, not limited at all; and 2) During the past 4 weeks, how much of the time has your physical health or emotional problems interfered with your social activities (like visiting with friends, relatives, etc.)? response options: all of the time; most of the time; some of the time; a little of the time; none of the time. Both measures were found to have good reliability (two-week test-retest reliability ≥ 0.76) and validity29. We present results from age 40 in the appendix (Appendix Tables 3 and 4). Both PCS and MCS are standardized such that numbers above 50 indicate better health than the typical US respondent and numbers below 50 reflect poorer health than the typical US respondent30.
Effect modifiers
We examined demographic and geographic factors as potential effect modifiers of the relationship between education and the PCS and MCS at age 50. The demographic effect modifiers tested were female sex, race (non-Hispanic White = ref, non-Hispanic Black, Hispanic / Latino, and other Race / missing; Asians were combined with the other / missing category due to small numbers, N = 38), and low cSES (mother’s education < 12 years; results for father’s education < 12 years presented in the appendix). Because race, sex, and socioeconomic status may have intersectional effects3, we examined combined race-sex, cSES-sex, and race-cSES categories as potential effect modifiers. The geographic effect modifiers tested were Southern birth18, foreign birth (we refer to those who were born outside the US as “immigrants”), and rural residence at age 1417. For all potential effect modifiers, we also included main effect terms in the regression models. We set the most socially advantaged group (i.e. high cSES White men) as the reference group for these analyses to more clearly highlight differential returns among socially marginalized groups; because each analytic model (detailed below) varies in the interaction terms included, the interpretation of the main effect for education similarly varies across models.
Confounder
In addition to the effect modifiers, we adjusted all models for birth year; birth year ranged from 1957 to 1964.
Analysis
We used linear regression models to predict PCS and MCS adjusted for the confounder and all effect modifiers. The base model included the main effects only. In separate models, we then added twoway multiplicative interactions to the base model between education and: (1) sex; (2) race; (3) low cSES; (4) immigrants; (5) Southern birth; (6) rural residence at age 14. We next specified the intersectionality models, including indicator variables for each race-sex (7), cSES-race (8), and cSESsex (9) combination, then added education interactions for each race-sex (10), cSES-race (11), and cSES-sex (12) combination. All data cleaning and analyses were performed in Stata 15. All models were weighted to the US population in 2014. In additional analyses to examine the potential impact of clustering on variance, we estimated the design effect for all models to be < 9% (data not shown); therefore, no additional variance adjustment was necessary. These analyses were determined exempt by the University of California, San Francisco IRB.
Results
Sample
Respondents were, on average, born in 1961 (Table 1), completed 13 years of education by age 25, and most were White (76%). Almost 32% experienced low childhood SES, 32% were born in the South, and 22% lived in rural areas at age 14. They reported similar physical health to the typical person in the general US population (mean PCS = 50) and reported better mental health than the typical person in the general US population (mean MCS = 53). The mean educational attainment for each demographic subgroup is presented in Appendix Table 2.
Table 1.
Distribution of variables (N = 6,158)
| Variable | Unweighted N (%) / mean (SD) |
Weighted % / mean |
|---|---|---|
| Birth year (mean, SD) | 1960.7 (2.2) | 1960.5 |
| Educational attainment at 25 (years; mean, SD) | 12.8 (2.1) | 13.1 |
| Female (N, %) | 3,219 (52.3) | 49.4 |
| Race / ethnicity (N, %) | ||
| White | 3,159 (51.3) | 75.9 |
| Black | 1,888 (30.7) | 13.4 |
| Hispanic | 847 (13.8) | 4.5 |
| Other race / missing | 264 (4.3) | 6.2 |
| Low cSES (N, %) | 2,616 (42.5) | 31.8 |
| Immigrant (N, %) | 296 (4.8) | 3.0 |
| Southern birth (N, %) | 2,348 (38.1) | 31.5 |
| Rural residence at age 14 years (N, %) | 1,267 (20.6) | 22.4 |
| Outcomes | ||
| PCS at age 50 (mean, SD) | 49.4 (10.0) | 50.0 |
| MCS at age 50 (mean, SD) | 53.0 (8.8) | 53.0 |
Low cSES is low childhood socioeconomic status, defined as mother’s educational attainment < 12 years (sensitivity analyses examine father’s education < 12 years).
PCS is the physical health component summary score
MCS is the mental health component summary score
SD is standard deviation.
Differential returns to education
In main effects models, PCS (Table 2, base model) was predicted by years of education (β = 0.91; 95% CI: 0.78, 1.04), female sex (β= −1.71; 95% CI: −2.25, −1.17), and low childhood SES (β = 1.56; 95% CI: −2.25, −0.87). The interaction terms represent the additional difference in PCS for each year of education; positive interaction terms indicate the demographic group benefitted more from each year of education than the reference group (the most socially advantaged), while negative interaction terms indicate the demographic group benefitted less from each year of education than the reference group. In interaction models, the estimated effect of each year of education was large among high cSES respondents (β = 0.81; 95% CI: 0.67, 0.94), and larger among those who experienced low cSES (interaction β = 0.39; 95% CI: 0.06, 0.72). Geographic factors did not modify the relationship between education and PCS (Appendix Table 3). Results for PCS at age 40 were similar Appendix Tables 5 and 6).
Table 2.
PCS at age 50; main effects and demographic interactions, weighted to 2014
| Base Model: Main Effects | Female interaction | Race interaction | cSES interaction | Immigrant interaction | |||||||||||
|---|---|---|---|---|---|---|---|---|---|---|---|---|---|---|---|
| Variables | Beta | 95% CI | p-value | Beta | 95% CI | p-value | Beta | 95% CI | p-value | Beta | 95% CI | p-value | Beta | 95% CI | p-value |
| Constant | 50.62 | (50.11,51.13) | <0.0005 | 50.62 | (50.08,51.16) | <0.0005 | 50.61 | (50.08,51.14) | <0.0005 | 50.80 | (50.27,51.33) | <0.0005 | 50.63 | (50.11,51.14) | <0.0005 |
| Education | 0.91 | (0.78,1.04) | <0.0005 | 0.91 | (0.76,1.07) | <0.0005 | 0.92 | (0.77,1.07) | <0.0005 | 0.81 | (0.67,0.94) | <0.0005 | 0.91 | (0.77,1.04) | <0.0005 |
| Female | −1.71 | (−2.25,−1.17) | <0.0005 | −1.71 | (−2.38,−1.04) | <0.0005 | −1.71 | (−2.25,−1.17) | <0.0005 | −1.72 | (−2.26,−1.18) | <0.0005 | −1.71 | (−2.25,−1.17) | <0.0005 |
| Black | −0.45 | (−1.12,0.23) | 0.195 | −0.45 | (−1.13,0.23) | 0.195 | −0.36 | (−1.11,0.39) | 0.350 | −0.53 | (−1.21,0.15) | 0.126 | −0.45 | (−1.13,0.23) | 0.192 |
| Hispanic / Latino | 0.87 | (−0.12,1.86) | 0.085 | 0.87 | (−0.12,1.86) | 0.085 | 0.93 | (−0.11,1.97) | 0.079 | 0.85 | (−0.14,1.84) | 0.093 | 0.89 | (−0.10,1.89) | 0.079 |
| Other Race / missing |
0.62 | (−0.54,1.77) | 0.297 | 0.62 | (−0.54,1.77) | 0.297 | 0.33 | (−1.23,1.89) | 0.675 | 0.65 | (−0.50,1.80) | 0.269 | 0.60 | (−0.55,1.76) | 0.307 |
| Low cSES | −1.56 | (−2.25,−0.87) | <0.0005 | −1.56 | (−2.26,−0.87) | <0.0005 | −1.56 | (−2.25,−0.87) | <0.0005 | −1.71 | (−2.43,−1.00) | <0.0005 | −1.56 | (−2.25,−0.87) | <0.0005 |
| Southern birth | −0.95 | (−1.57,−0.32) | 0.003 | −0.95 | (−1.57,−0.32) | 0.003 | −0.94 | (−1.57,−0.31) | 0.003 | −0.89 | (−1.52,−0.27) | 0.005 | −0.95 | (−1.58,−0.33) | 0.003 |
| Immigrant | −0.20 | (−1.95,1.54) | 0.818 | −0.20 | (−1.95,1.54) | 0.818 | −0.21 | (−1.96,1.54) | 0.813 | −0.20 | (−1.94,1.55) | 0.824 | −0.45 | (−2.48,1.57) | 0.660 |
| Rural residence at 14 |
−0.15 | (−0.81,0.52) | 0.662 | −0.15 | (−0.81,0.52) | 0.662 | −0.14 | (−0.80,0.53) | 0.685 | −0.19 | (−0.85,0.48) | 0.581 | −0.15 | (−0.81,0.52) | 0.661 |
| Birth year | −0.01 | (−0.13,0.11) | 0.840 | −0.01 | (−0.13,0.11) | 0.840 | −0.01 | (−0.14,0.11) | 0.823 | −0.01 | (−0.13,0.11) | 0.885 | −0.01 | (−0.14,0.11) | 0.833 |
| Female * education |
−0.00 | (−0.25,0.24) | 0.992 | ||||||||||||
| Black * education |
−0.15 | (−0.43,0.13) | 0.301 | ||||||||||||
| Hispanic * education |
−0.14 | (−0.48,0.19) | 0.402 | ||||||||||||
| Other Race * education |
0.21 | (−0.31,0.73) | 0.419 | ||||||||||||
| Low cSES * education |
0.39 | (0.06,0.72) | 0.020 | ||||||||||||
| Immigrant * education |
0.24 | (−0.28,0.75) | 0.367 | ||||||||||||
PCS is physical health component summary score.
Education is centered at 12 years, and birth year is centered at 1960 so the constant is interpretable.
Education is coded linearly as years of education; a 1-unit increase in education is a 1-year increase in schooling.
The reference group is White men born in the U.S., outside the South, who lived in non-rural areas at age 14 years and whose mothers completed 12 or more years of schooling; because each analytic model varies in the interaction terms included, the interpretation of the main effect for education similarly varies across models.
Interaction term coefficients indicate the additional difference in PCS / MCS associated with each year of education; positive interaction terms indicate the demographic group benefited more from each year of education than the reference group, while negative interaction terms indicate the demographic group benefited less from each year of education than the reference group. To calculate the change in PCS / MCS for a one-year increase in education for a specific demographic group, sum the coefficient for the main effect for education with the coefficient for the interaction term.
In main effects models, MCS (Table 3, base model) was predicted by years of education (β = 0.73; 95% CI: 0.44, 1.02), female sex (β = −2.39; 95% CI: −2.90, −1.89), race / ethnicity (β for Hispanic Latino ethnicity = 1.17; 95% CI: 0.34, 2.00), low cSES (β = −0.61; 95% CI: −1.24, 0.02), and birth year (β = 0.16; 95% CI: 0.04, 0.27). The effect of each year of education was large among those born in the U.S. (β = 0.76; 95% CI: 0.46, 1.05), but smaller among immigrants to the US (interaction β = −0.94; 95% CI: −1.86, −0.02). Geographic factors did not modify the relationship between education and MCS (Appendix Table 4). Results for MCS at age 40 were smaller in magnitude, but in the same direction (Appendix Tables 7 and 8).
Table 3.
MCS at age 50; main effects and demographic interactions, weighted to 2014
| Base model | Female interaction | Race interaction | cSES interaction | Immigrant interaction | |||||||||||
|---|---|---|---|---|---|---|---|---|---|---|---|---|---|---|---|
| Variables | Beta | 95% CI | p-value | Beta | 95% CI | p-value | Beta | 95% CI | p-value | Beta | 95% CI | p-value | Beta | 95% CI | p-value |
| Constant | 53.88 | (53.42,54.33) | <0.0005 | 53.91 | (53.46,54.37) | <0.0005 | 53.88 | (53.42,54.34) | <0.0005 | 53.91 | (53.43,54.39) | <0.0005 | 53.87 | (53.42,54.32) | <0.0005 |
| Education | 0.73 | (0.44,1.02) | <0.0005 | 0.51 | (0.14,0.87) | 0.007 | 0.74 | (0.37,1.11) | <0.0005 | 0.65 | (0.24,1.07) | 0.002 | 0.76 | (0.46,1.05) | <0.0005 |
| Female | −2.39 | (−2.90,−1.89) | <0.0005 | −2.48 | (−3.01,−1.95) | <0.0005 | −2.39 | (−2.90,−1.89) | <0.0005 | −2.39 | (−2.90,−1.89) | <0.0005 | −2.40 | (−2.90,−1.89) | <0.0005 |
| Black | 0.26 | (−0.34,0.86) | 0.390 | 0.24 | (−0.35,0.84) | 0.422 | 0.26 | (−0.34,0.87) | 0.394 | 0.25 | (−0.35,0.85) | 0.417 | 0.26 | (−0.33,0.86) | 0.387 |
| Hispanic / Latino | 1.17 | (0.34,2.00) | 0.006 | 1.16 | (0.33,1.99) | 0.006 | 1.15 | (0.32,1.98) | 0.006 | 1.16 | (0.33,1.99) | 0.006 | 1.10 | (0.27,1.93) | 0.009 |
| Other Race / missing | 0.74 | (−0.30,1.77) | 0.162 | 0.71 | (−0.32,1.75) | 0.178 | 0.84 | (−0.26,1.95) | 0.134 | 0.75 | (−0.29,1.78) | 0.156 | 0.75 | (−0.28,1.79) | 0.153 |
| Low cSES | −0.61 | (−1.24,0.02) | 0.056 | −0.60 | (−1.23,0.03) | 0.061 | −0.62 | (−1.25,0.01) | 0.054 | −0.62 | (−1.26,0.01) | 0.054 | −0.61 | (−1.24,0.02) | 0.056 |
| Southern birth | 0.01 | (−0.57,0.59) | 0.968 | 0.01 | (−0.57,0.58) | 0.986 | −0.00 | (−0.58,0.58) | 0.993 | 0.02 | (−0.56,0.60) | 0.953 | 0.02 | (−0.56,0.60) | 0.944 |
| Immigrant | −0.61 | (−2.05,0.83) | 0.407 | −0.60 | (−2.03,0.84) | 0.415 | −0.61 | (−2.04,0.83) | 0.407 | −0.61 | (−2.05,0.83) | 0.408 | −0.43 | (−1.85,0.99) | 0.550 |
| Rural residence at 14 | 0.70 | (0.09,1.30) | 0.024 | 0.70 | (0.09,1.30) | 0.024 | 0.69 | (0.08,1.29) | 0.026 | 0.69 | (0.08,1.29) | 0.026 | 0.70 | (0.09,1.30) | 0.024 |
| Birth year | 0.16 | (0.04,0.27) | 0.009 | 0.16 | (0.04,0.27) | 0.009 | 0.16 | (0.04,0.27) | 0.009 | 0.15 | (0.04,0.27) | 0.009 | 0.16 | (0.04,0.27) | 0.009 |
| Female * education | 0.49 | (−0.06,1.04) | 0.082 | ||||||||||||
| Black * education | 0.25 | (−0.33,0.83) | 0.400 | ||||||||||||
| Hispanic * education | −0.19 | (−0.80,0.41) | 0.535 | ||||||||||||
| Other Race * education | −0.47 | (−1.54,0.59) | 0.386 | ||||||||||||
| cSES * education | 0.14 | (−0.44,0.71) | 0.635 | ||||||||||||
| Immigrant * education | −0.94 | (−1.86,−0.02) | 0.046 | ||||||||||||
MCS is mental health component summary score.
Education is centered at 12 years, and birth year is centered at 1960 so the constant is interpretable.
Education is coded linearly as years of education until 13 years, and flat thereafter (i.e. everything after 13 years of schooling is recoded as 13 years because we found this specification was the best fit for the MCS data). A 1unit increase in education is a 1-year increase in schooling until 13 years.
The reference group is White men born in the U.S., outside the South, who lived in non-rural areas at age 14 years and whose mothers completed 12 or more years of schooling; because each analytic model varies in the interaction terms included, the interpretation of the reference group similarly varies across models.
Interaction term coefficients indicate the additional difference in PCS / MCS associated with each year of education; positive interaction terms indicate the demographic group benefited more from each year of education than the reference group, while negative interaction terms indicate the demographic group benefited less from each year of education than the reference group. To calculate the change in PCS / MCS for a one-year increase in education for a specific demographic group, sum the coefficient for the main effect for education with the coefficient for the interaction term.
Intersectionality models
There was no evidence of differential returns in predicting PCS in models that examined intersectional effect modification by sex and race / ethnicity (Table 4). However, in predicting MCS, there was evidence of differential returns such that the association was imprecisely estimated for White men (β = 0.44; 95% CI: −0.03, 0.90), while Black women benefited from each year of education (interaction β = 0.91; 95% CI: 0.19, 1.64). Similarly, in intersectional models for effect modification by cSES and race / ethnicity, there was no evidence of differential effects of education in predicting PCS; for MCS, on the other hand, MCS improved with each year of education for high cSES Whites (β = 0.19; 95% CI: 0.03, 0.35) and improved more for low cSES Blacks (interaction β = 0.61; 95% CI: 0.21, 1.00). Finally, in intersectional models for effect modification by cSES and sex, there was no evidence of differential effects of education in predicting PCS; in predicting MCS, there was no relationship between education and MCS among high cSES men (β = 0.07; 95% CI: −0.39, 0.54), however high cSES women (β = 1.32; 95% CI: (0.46, 2.18)), and low cSES women (β = 0.75; 95% CI: 0.01, 1.49), benefited from each year of education.
Table 4.
Intersectionality models, weighted to 2014
| PCS | MCS | |||||||||||
|---|---|---|---|---|---|---|---|---|---|---|---|---|
| Intersectionality: race * sex | ||||||||||||
| Base model | Race * sex interactions | Base model | Race * sex interactions | |||||||||
| Variables | Beta | (95% CI) | p-value | Beta | (95% CI) | p-value | Beta | (95% CI) | p-value | Beta | (95% CI) | p-value |
| Constant (White men) | 50.62 | (50.08,51.16) | <0.0005 | 50.61 | (50.01,51.22) | <0.0005 | 53.95 | (53.47,54.43) | <0.0005 | 54.01 | (53.51,54.50) | <0.0005 |
| Education | 0.91 | (0.79,1.04) | <0.0005 | 0.92 | (0.73,1.10) | <0.0005 | 0.73 | (0.44,1.02) | <0.0005 | 0.44 | (−0.03,0.90) | 0.066 |
| White women | −1.73 | (−2.39,−1.08) | <0.0005 | −1.74 | (−2.58,−0.89) | <0.0005 | −2.54 | (−3.16,−1.91) | <0.0005 | −2.68 | (−3.35,−2.01) | <0.0005 |
| Black men | 0.09 | (−0.80,0.97) | 0.848 | 0.22 | (−0.76,1.19) | 0.661 | −0.11 | (−0.90,0.67) | 0.773 | −0.18 | (−0.96,0.61) | 0.658 |
| Black women | −2.72 | (−3.62,−1.83) | <0.0005 | −2.77 | (−3.81,−1.73) | <0.0005 | −1.89 | (−2.69,−1.10) | <0.0005 | −2.03 | (−2.84,−1.22) | <0.0005 |
| Hispanic / Latino men | 0.46 | (−0.70,1.63) | 0.437 | 0.48 | (−0.78,1.74) | 0.456 | 0.63 | (−0.41,1.68) | 0.234 | 0.58 | (−0.47,1.63) | 0.279 |
| Hispanic / Latino women | −0.50 | (−1.89,0.89) | 0.484 | −0.38 | (−1.84,1.08) | 0.612 | −0.86 | (−2.00,0.27) | 0.136 | −0.97 | (−2.10,0.17) | 0.095 |
| White women * education | 0.00 | (−0.29,0.30) | 0.990 | 0.65 | (−0.06,1.37) | 0.075 | ||||||
| Black men * education | −0.30 | (−0.68,0.08) | 0.119 | 0.22 | (−0.62,1.06) | 0.608 | ||||||
| Black women * education | 0.06 | (−0.33,0.45) | 0.763 | 0.91 | (0.19,1.64) | 0.014 | ||||||
| Hispanic men * education | 0.00 | (−0.44,0.43) | 0.983 | 0.36 | (−0.42,1.14) | 0.364 | ||||||
| Hispanic / Latino women * education | −0.29 | (−0.77,0.20) | 0.249 | −0.13 | (−0.99,0.74) | 0.775 | ||||||
| Intersectionality: cSES * race | ||||||||||||
| Base model | cSES * race interactions | Base model | cSES * race interactions | |||||||||
| Variables | Beta | (95% CI) | p-value | Beta | (95% CI) | p-value | Beta | (95% CI) | p-value | Beta | (95% CI) | p-value |
| Constant (White, high cSES) | 50.65 | (50.13, 51.18) | < 0.0005 | 50.77 | (50.20, 51.33) | < 0.0005 | 53.76 | (53.26, 54.26) | < 0.0005 | 53.90 | (53.37, 54.43) | < 0.0005 |
| Education | 0.91 | (0.78, 1.04) | < 0.0005 | 0.83 | (0.67, 0,99) | < 0.0005 | 0.26 | (0.14, 0.39) | < 0.0005 | 0.19 | (0.03, 0.35) | 0.023 |
| White, low cSES | −1.64 | (−2.51, −0.78) | < 0.0005 | −1.75 | (−2.65, −0.84) | < 0.0005 | −0.78 | (−1.59, 0.03) | 0.058 | −0.90 | (−1.74, −0.06) | 0.035 |
| Black, high cSES | −0.82 | (−1.63, −0.00) | 0.049 | −0.64 | (−1.66, 0.38) | 0.216 | 0.01 | (−0.74, 0.76) | 0.983 | −0.26 | (−1.17, 0.65) | 0.573 |
| Black, low cSES | −1.71 | (−2.63, −0.79) | < 0.0005 | −1.88 | (−2.85, −0.92) | < 0.0005 | −0.08 | (−0.85, 0.70) | 0.848 | −0.27 | (−1.09, 0.55) | 0.518 |
| Hispanic / Latino, high cSES | 0.84 | (−0.62, 2.30) | 0.259 | 1.15 | (−0.85, 2.15) | 0.261 | 1.68 | (0.51, 2.85) | 0.005 | 1.54 | (0.05, 3.04) | 0.043 |
| Hispanic / Latino, low cSES | −0.72 | (−1.83, 0.40) | 0.208 | −0.86 | (−1.99, 0.27) | 0.136 | 0.27 | (−0.67, 1.21) | 0.575 | 0.15 | (−0.81, 1.10) | 0.762 |
| White, low cSES * education | 0.38 | (−0.08, 0.83) | 0.105 | 0.21 | (−0.23, 0.65) | 0.356 | ||||||
| Black, high cSES * education | −0.21 | (−0.58, 0.15) | 0.254 | 0.19 | (−0.18, 0.57) | 0.309 | ||||||
| Black, low cSES * education | 0.19 | (−0.21, 0.58) | 0.354 | 0.61 | (0.21, 1.00) | 0.002 | ||||||
| Hispanic / Latino, high cSES *education | −0.22 | (−0.74, 0.30) | 0.415 | 0.08 | (−0.35, 0.51) | 0.725 | ||||||
| Hispanic / Latino, low cSES * education | 0.01 | (−0.49, 0.50) | 0.978 | 0.33 | (−0.09, 0.76) | 0.127 | ||||||
| Intersectionality: cSES * sex | ||||||||||||
| Base model | cSES * sex interactions | Base model | cSES * sex interactions | |||||||||
| Beta | (95% CI) | p-value | Beta | (95% CI) | p-value | Beta | (95% CI) | p-value | Beta | (95% CI) | p-value | |
| Constant (high cSES men) | 50.68 | (50.16, 51.21) | < 0.0005 | 50.87 | (50.27, 51.46) | < 0.0005 | 53.92 | (53.46, 54.38) | < 0.0005 | 54.19 | (53.70, 54.68) | < 0.0005 |
| Education | 0.91 | (0.78, 1.04) | < 0.0005 | 0.80 | (0.64, 0.96) | < 0.0005 | 0.73 | (0.44, 1.02) | < 0.0005 | 0.07 | (−0.39, 0.54) | 0.760 |
| High cSES women | −1.85 | (−2.47, −1.22) | < 0.0005 | −1.87 | (−2.76, −0.99) | < 0.0005 | −2.49 | (−3.09, −1.89) | < 0.0005 | −3.06 | (−3.83, −2.30) | < 0.0005 |
| Low cSES men | −1.78 | (−2.66, −0.90) | < 0.0005 | −1.92 | (−2.85, −0.99) | < 0.0005 | −0.77 | (−1.56, 0.02) | 0.056 | −1.02 | (−1.80, −0.23) | 0.012 |
| Low cSES women | −3.21 | (−4.10, −2.31) | < 0.0005 | −3.39 | (−4.34, −2.44) | < 0.0005 | −2.96 | (−3.78, −2.14) | < 0.0005 | −3.19 | (−4.02, −2.36) | < 0.0005 |
| High cSES women * education | 0.02 | (−0.26, 0.30) | 0.886 | 1.32 | (0.46, 2.18) | 0.003 | ||||||
| Low cSES men * education | 0.38 | (−0.05, 0.82) | 0.085 | 0.68 | (−0.04, 1.40) | 0.064 | ||||||
| Low cSES women * education | 0.41 | (−0.06, 0.89) | 0.086 | 0.75 | (0.01, 1.49) | 0.048 | ||||||
PCS is physical health component summary score; MCS is mental health component summary score.
Education is centered at 12 years, and birth year is centered at 1960 so the constant is interpretable.
For PCS, education is coded linearly as years of education; a 1-unit increase in education is a 1-year increase in schooling.
For MCS, education is coded linearly as years of education until 13 years, and flat thereafter (i.e. everything after 13 years of schooling is recoded as 13 years because found this specification was the best fit for the data). A 1unit increase in education is a 1-year increase in schooling until 13 years.
Models adjusted for all effect modifies and confounders; we modeled main effects and interactions for Other race men and Other race women but did not display these results due to ambiguity in interpretation.
The reference group is White men born in the U.S., outside the South, who lived in non-rural areas at age 14 years and whose mothers completed 12 or more years of schooling; because each analytic model varies in the interaction terms included, the interpretation of the reference group similarly varies across models.
Interaction term coefficients indicate the additional difference in PCS / MCS associated with each year of education; positive interaction terms indicate the demographic group benefited more from each year of education than the reference group, while negative interaction terms indicate the demographic group benefited less from each year of education than the reference group. To calculate the change in PCS / MCS for a one-year increase in education for a specific demographic group, sum the coefficient for the main effect for education with the coefficient for the interaction term.
Discussion
Among a national sample of U.S. middle-aged adults, we found evidence that the benefits of education for self-reported measures of physical and mental health differed across sociodemographic groups. In terms of physical health, individuals who experienced childhood socioeconomic disadvantage benefited more from each year of education than socially advantaged groups. In terms of mental health, immigrants to the U.S. benefitted less from each year of education while Black women, low cSES Blacks, and low and high cSES women benefitted more than socially advantaged groups. These findings have implications for addressing health inequities.
Work examining the Korean War and Vietnam War GI Bills, which provided generous college education subsidies to qualifying veterans, found that such education-promoting policies predicted smaller socioeconomic disparities in physical31, mental32, and cognitive33 health among older adults by disproportionately benefiting low cSES veterans. The current findings are consistent with those results for physical health and extend results to a middle-aged sample and more recent birth cohorts. This suggests that the disproportionate benefit from educational attainment for low cSES subgroups is not isolated to specific birth cohorts or age groups. Investing in programs and policies that facilitate increased educational attainment among low cSES groups in the present may pay dividends towards a future with smaller health inequities. Our results add additional weight to the argument that interventions to increase educational attainment could be a powerful mechanism for reducing health inequities among individuals who experienced socioeconomic adversity in early life.
We additionally found that immigrants to the US benefited less from each year of education in terms of their mental health. These findings could reflect that immigrants to the US, unlike their US-born peers, are made to navigate hostile environments, resulting in poorer mental health9. The chronic stress of possible deportation could deteriorate the mental health of immigrant communities as prior work suggests that immigration raids predict more stress, poorer self-rated health34, and higher rates of low birth weight babies35 among remaining community members following the raid. Our results may addtionally reflect that immigrants to the U.S. are employed in higher stress jobs, which have been linked to poorer mental health36, or that non-native English speakers gain less knowledge and skills from each year of education, resulting in smaller health returns to education.
Finally, in intersectionality models, we found that Black women, low cSES Blacks, and low and high cSES women benefited more in terms of their mental health from each year of education than socially advantaged groups, suggesting that programs and policies to increase educational attainment among these groups could reduce racial and socioeconomic inequities in mental health. These findings are particularly important given that Black women tend to have worse mental health than other groups37–39. Our finding that certain vulnerable subgroups benefit more from each year of education in terms of their mental health suggests these groups may be leveraging the additional skills and resources that come with each year of education to attain better mental health. These results are consistent with previous findings that women4, low cSES groups31–33, and Black women5 benefit more from education in predicting health.
Our analyses were motivated by a conceptual model of multiple pathways through which sociodemographic groups may be differentially impacted by educational attainment (Figure 1). Our findings that socially vulnerable groups (low cSES, Black women, low cSES Blacks, and high and low cSES women) benefit more than socially advantaged groups from each year of education is consistent with the resource substitution theory4. For example, resources including education (quality or quantity), power, authority, earnings, and knowledge all impact health such that more of these resources predicts better health. Socially marginalized groups have less access to all of these resources compared to socially advantaged groups, making marginalized groups more dependent on the resources to which they have access, such as education. This may explain why we found that certain population subgroups benefit more than socially advantaged groups from each year of schooling – because these resources can substitute for each other, those who have limited access to alternative resources are more dependent on education, and therefore they benefit more from each year of education4,5.
Differences in access to resources exist because certain groups are marginalized within society. We believe these larger societal determinants of health are the reason socially marginalized groups have fewer alternative resources such as empowerment, knowledge, and earnings. That is, we observe that socially marginalized groups benefit more from each year of education in predicting health because, on a population-level, society has created structural barriers to prevent them from accessing these healthpromoting alternatives.
We were surprised to find little evidence of a differential effect of education among Black men given prior work suggesting the effects of structural racism are particularly damaging for Black boys21,22 (i.e. we hypothesized that Black men would benefit less from each year of education than other groups5,23,24). It is possible that our self-reported outcome measures were not sensitive enough to detect these changes, that health differentials among Black men may not yet be detectable at age 50, or that the Black men most affected were excluded from our sample due to incarceration or early mortality40,41. Our analysis included birth cohorts from 1957 to 1964; substantial social changes associated with the Civil Rights Act of 1964 means these results may not be generalizable to older and younger populations. For these reasons, repeating these analyses in other populations with measured health outcomes is an important area forfuture research.
Limitations
There are some limitations to these analyses. Unmeasured confounding is a concern in this observational study so causal inferences merit substantial caution. The broad demographic categories we defined included heterogeneous individuals; for example, immigrants from high-, medium-, and low income countries were modeled together with a single indicator variable. All data were self-reported; repeating these analyses using objectively measured data to evaluate differential returns to education on health conditions that may not yet be noticed, and therefore cannot be self-reported, is an important area for future research. Because data on the primary sampling units were not available, the standard errors are likely biased downward; estimated design effects were small, suggesting clustering minimally impacted variance. Our analyses examined quantity of education, so we cannot comment on how variations in quality of education could impact these findings. Finally, we used a complete case approach, meaning those with missing data on the exposure, outcomes, or effect modifiers were excluded from analysis; prior work has argued that complete case approaches can exclude the most socially vulnerable, potentially biasing estimates42; given that only 13% of the eligible sample were excluded due to missing data, we expect these biases to be relatively small. Despite these limitations, our paper adds to the nascent literature on differential returns to education among socially vulnerable subgroups and is therefore an important contribution to the field.
Conclusion
We found that those who experienced socioeconomic adversity in childhood benefited more from each year of education in predicting physical health, while Black women, low cSES Blacks, and high and low cSES women benefited more from each year of education in predicting mental health compared to socially advantaged groups. We also found that immigrants benefited less from each year of education in predicting mental health compared to those born in the U.S.. Our results suggest policies and programs that increase quantity of education may help reduce population-level socioeconomic and racial health inequities. Our results further suggest that policies and programs that increase quantity of education will not reduce health inequities among immigrants. We suggest that these differential returns to education exist because of differential access to alternative resources, making socially marginalized groups more dependent on the resources to which they have access, such as education. Replicating these analyses in independent data sources with different birth cohorts and populations would be informative to assess if these findings persist across time, place, and population.
Acknowledgments
Funding: Research reported in this publication was supported by the National Institute of Aging under Award Number 1R01AG056360, PI: Yen.
Appendix
Figure 1.
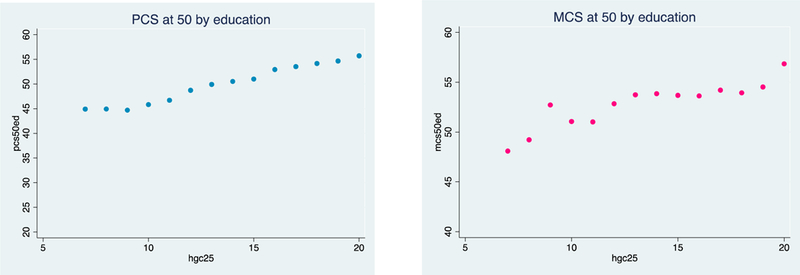
Scatterplots of mean PCS and MCS by each the highest grade attained at age 25
PCS appears to have a mostly linear relationship with education, although it may be flat under 9 years. The “data driven” approach we tested for PCS is flat under 9 years, then linear. For the MCS, the relationship with education is linear until 13 years, then flat, which is the “data driven” approach we tested for MCS.
Table 1.
Options for modelling education
| PCS | MCS | |||
|---|---|---|---|---|
| BIC | AIC | BIC | AIC | |
| Non-parametric | 507278.1a | 7.397166 | 390815.6a | 7.163119 |
| Continuous | 508023.1 | 7.394599 | 392894.8b | 7.163963b |
| Education credential |
510690.4b | 7.399685b | 392633.7 | 7.163696 |
| Montez spline | 507406.8 | 7.394471a | 391880.7 | 7.162639 |
| Data driven for PCS: flat relationship under 9 years, then linear1 |
507955.4 | 7.394478 | ||
| Data driven for MCS: flat relationship after 13 years2 |
391972.2 | 7.161882a | ||
Lower BICs and AICs indicate better model fit.
indicates the best model fit
indicates the worst model fit
For PCS, the AICs and BICs were similar across different operationalization’s of education. There was not persuasive evidence for or against any particular model; for this reason, we operationalized education continuously because it made the most sense in terms of interpretability.
For MCS, the AICs and BICs were similar across different operationalization’s of education, although both metrics indicated that continuous education had the worst model fit, so there was evidence not to use continuous. However, since results were not consistent on which model was best, we used the data driven approach for MCS since it makes sense in terms of the interpretability and it’s the best fit by AIC.
Table 2.
Mean educational attainment by age 25 for demographic subgroups analyzed
| Variable | Weighted
educational attainment at 25 |
|---|---|
| Race − sex subgroups | |
| Non-Hispanic White men | 13.24 |
| Non-Hispanic White women | 13.19 |
| Non-Hispanic Black men | 12.44 |
| Non-Hispanic Black women | 12.75 |
| Hispanic men | 12.38 |
| Hispanic women | 12.38 |
| Other Race men | 13.25 |
| Other Race women | 13.40 |
| Low cSES | 11.93 |
| High cSES | 13.65 |
| US born, but outside the South | 13.26 |
| Southern born | 12.78 |
| Immigrant | 13.03 |
| US urban residence at age 14 | 13.17 |
| US rural residence at age 14 | 12.54 |
Table 3.
PCS at 50 – Geographic interactions, weighted to 2014
| Southern birth interaction | Rural residence at 14 interaction | |||||
|---|---|---|---|---|---|---|
| Variables | Beta | 95%CI | p-value | Beta | 95%CI | p-value |
| Constant | 50.67 | (50.14,51.19) | <0.0005 | 50.60 | (50.07,51.12) | <0.0005 |
| Education | 0.87 | (0.72,1.03) | <0.0005 | 0.93 | (0.79,1.07) | <0.0005 |
| Female | −1.72 | (−2.26,−1.18) | <0.0005 | −1.71 | (−2.25,−1.17) | <0.0005 |
| Non-Hispanic Black | −0.44 | (−1.12,0.23) | 0.200 | −0.44 | (−1.12,0.24) | 0.203 |
| Hispanic | 0.86 | (−0.13,1.85) | 0.089 | 0.88 | (−0.11,1.88) | 0.081 |
| Other Race / missing | 0.64 | (−0.52,1.79) | 0.282 | 0.61 | (−0.55,1.77) | 0.300 |
| Childhood SES | −1.55 | (−2.24,−0.86) | <0.0005 | −1.56 | (−2.26,−0.87) | <0.0005 |
| Southern birth | −1.05 | (−1.79,−0.31) | 0.005 | −0.95 | (−1.58,−0.33) | 0.003 |
| Immigrant | −0.21 | (−1.96,1.53) | 0.810 | −0.21 | (−1.95,1.54) | 0.817 |
| Rural residence at 14 | −0.15 | (−0.81,0.52) | 0.661 | −0.05 | (−0.85,0.74) | 0.895 |
| Birth year | −0.01 | (−0.14,0.11) | 0.830 | −0.01 | (−0.13,0.11) | 0.853 |
| Southern birth *
education |
0.11 | (−0.15,0.36) | 0.415 | |||
| Rural residence at 14 * education |
−0.10 | (−0.40,0.20) | 0.518 | |||
PCS is physical health component summary score.
Education is centered at 12, and birth year is centered at 1960 so the constant is interpretable.
Education is coded linearly as years of education; a 1-unit increase in education is a 1-year increase in schooling.
Table 4.
MCS at 50 – Geographic interactions, weighted to 2014
| Southern birth interaction | Rural residence at 14 interaction | |||||
|---|---|---|---|---|---|---|
| Variables | Beta | 95%CI | p-value | Beta | 95%CI | p-value |
| Constant | 53.91 | (53.44,54.37 ) |
<0.000 5 |
53.86 | (53.40,54.32) | <0.000 5 |
| Education | 0.63 | (0.24,1.03) | 0.002 | 0.80 | (0.47,1.13) | <0.000 5 |
| Female | −2.40 | (−2.90,−1.89) | <0.000 5 |
−2.39 | (−2.90,−1.89) | <0.000 5 |
| Non-Hispanic Black |
0.26 | (−0.34,0.85) | 0.401 | 0.26 | (−0.33,0.86) | 0.387 |
| Hispanic | 1.15 | (0.31,1.98) | 0.007 | 1.18 | (0.35,2.01) | 0.005 |
| Other Race / missing |
0.76 | (−0.27,1.80) | 0.148 | 0.72 | (−0.31,1.75) | 0.172 |
| Childhood SES | −0.62 | (−1.25,0.01) | 0.054 | −0.61 | (−1.24,0.02) | 0.057 |
| Southern birth | −0.01 | (−0.60,0.58) | 0.975 | 0.01 | (−0.57,0.59) | 0.971 |
| Immigrant | −0.62 | (−2.05,0.82) | 0.400 | −0.61 | (−2.05,0.83) | 0.409 |
| Rural residence at 14 | 0.69 | (0.09,1.30) | 0.025 | 0.73 | (0.11,1.36) | 0.022 |
| Birth year | 0.15 | (0.04,0.27) | 0.009 | 0.16 | (0.04,0.27) | 0.008 |
| Southern birth *
education |
0.20 | (−0.35,0.75) | 0.474 | |||
| Rural residence at 14 * education |
−0.31 | (−0.93,0.32) | 0.335 | |||
MCS is mental health component summary score.
Education is centered at 12, and birth year is centered at 1960 so the constant is interpretable.
Education is coded linearly as years of education until 13 years, and flat thereafter (i.e. everything after 13 years of schooling is recoded as 13 years because we found this specification was the best fit for the MCS data). A 1-unit increase in education is a 1-year increase in schooling until 13 years.
Table 5.
PCS at 40 – main effects and demographic interactions, weighted to 2004 (N = 5,682)
| Base model | Female interaction | Race interaction | cSES interaction | |||||||||
|---|---|---|---|---|---|---|---|---|---|---|---|---|
| Variables | Beta | 95%CI | p-value | Beta | 95%CI | p-value | Beta | 95%CI | P-value | Beta | 95%CI | p-value |
| Constant | 52.8 8 |
(52.45,53.31) | <0.000 5 |
52.9 1 |
(52.45,53.36) | <0.000 5 |
52.8 4 |
(52.40,53.29) | <0.000 5 |
53.04 | (52.60,53.48) | <0.000 5 |
| Education (yrs) | 0.57 | (0.46,0.68) | <0.000 5 |
0.54 | (0.41,0.67) | <0.000 5 |
0.59 | (0.46,0.72) | <0.000 5 |
0.47 | (0.36,0.59) | <0.000 5 |
| Female | −1.34 | (−1.78,−0.90) | <0.000 5 |
−1.40 | (−1.96,−0.83) | <0.000 5 |
−1.33 | (−1.77,−0.89) | <0.000 5 |
−1.35 | (−1.79,−0.91) | <0.000 5 |
| Non-Hispanic Black |
−0.12 | (−0.65,0.42) | 0.672 | −0.12 | (−0.66,0.42) | 0.662 | 0.03 | (−0.58,0.63) | 0.924 | −0.19 | (−0.72,0.34) | 0.488 |
| Hispanic | 0.74 | (0.03,1.44) | 0.040 | 0.74 | (0.03,1.44) | 0.040 | 0.81 | (0.06,1.56) | 0.035 | 0.73 | (0.03,1.43) | 0.042 |
| Other Race / missing |
0.60 | (−0.21,1.41) | 0.147 | 0.60 | (−0.21,1.41) | 0.149 | 0.49 | (−0.62,1.60) | 0.385 | 0.64 | (−0.18,1.45) | 0.124 |
| Childhood SES | −1.06 | (−1.63,−0.49) | <0.000 5 |
−1.05 | (−1.63,−0.48) | <0.000 5 |
−1.06 | (−1.63,−0.49) | <0.000 5 |
−1.20 | (−1.80,−0.60) | <0.000 5 |
| Southern birth | −0.33 | (−0.84,0.17) | 0.196 | −0.34 | (−0.84,0.17) | 0.195 | −0.33 | (−0.84,0.17) | 0.198 | −0.28 | (−0.79,0.22) | 0.272 |
| Immigrant | 1.00 | (0.13,1.87) | 0.025 | 1.00 | (0.13,1.88) | 0.025 | 1.00 | (0.13,1.88) | 0.024 | 1.00 | (0.13,1.87) | 0.024 |
| Rural residence at 14 |
0.41 | (−0.11,0.92) | 0.123 | 0.41 | (−0.11,0.92) | 0.123 | 0.42 | (−0.10,0.93) | 0.115 | 0.37 | (−0.14,0.89) | 0.157 |
| Birth year | −0.00 | (−0.10,0.09) | 0.925 | −0.01 | (−0.10,0.09) | 0.921 | −0.01 | (−0.10,0.09) | 0.919 | −0.00 | (−0.10,0.10) | 0.968 |
| Female * education |
0.05 | (−0.16,0.26) | 0.649 | |||||||||
| Non-Hispanic Black * education |
−0.22 | (−0.45,0.01) | 0.063 | |||||||||
| Hispanic * education |
−0.13 | (−0.41,0.14) | 0.340 | |||||||||
| Other Race * education |
0.08 | (−0.28,0.43) | 0.667 | |||||||||
| cSES * education |
0.35 | (0.07,0.62) | 0.013 | |||||||||
PCS is physical health component summary score.
Education is centered at 12, and birth year is centered at 1960 so the constant is interpretable.
Education is coded linearly as years of education; a 1-unit increase in education is a 1-year increase in schooling.
Table 6.
PCS at 40 – geographic interactions, weighted to 2004 (N = 5,682)
| Immigrant interaction | Southern birth interaction | Rural residence at 14 interaction | |||||||
|---|---|---|---|---|---|---|---|---|---|
| Variables | Beta | 95%CI | p-value | Beta | 95%CI | p-value | Beta | 95%CI | p-value |
| Constant | 52.87 | (52.44,53.29) | <0.0005 | 52.87 | (52.43,53.32 ) |
<0.0005 | 52.88 | (52.44,53.3 2) |
<0.0005 |
| Education (yrs) | 0.58 | (0.47,0.69) | <0.0005 | 0.57 | (0.45,0.70) | <0.0005 | 0.57 | (0.44,0.69) | <0.0005 |
| Female | −1.34 | (−1.78,−0.90) | <0.0005 | −1.34 | (−1.78,−0.90) | <0.0005 | −1.34 | (−1.78,− 0.90) |
<0.0005 |
| Non-Hispanic Black |
−0.11 | (−0.65,0.43) | 0.686 | −0.12 | (−0.66,0.42) | 0.670 | −0.12 | (−0.65,0.42) | 0.673 |
| Hispanic | 0.70 | (−0.00,1.40) | 0.050 | 0.74 | (0.04,1.44) | 0.039 | 0.74 | (0.03,1.44) | 0.041 |
| Other Race / missing | 0.63 | (−0.18,1.43) | 0.129 | 0.60 | (−0.22,1.41) | 0.151 | 0.60 | (−0.21,1.41) | 0.148 |
| Childhood SES | −1.06 | (−1.63,−0.49) | <0.0005 | −1.06 | (−1.63,−0.49) | <0.0005 | −1.06 | (−1.63,− 0.49) |
<0.0005 |
| Southern birth | −0.33 | (−0.84,0.18) | 0.205 | −0.31 | (−0.94,0.31) | 0.329 | −0.33 | (−0.84,0.17) | (0.196 |
| Immigrant | 1.48 | (0.59,2.37) | 0.001 | 1.00 | (0.13,1.88) | 0.025 | 1.00 | (0.13,1.87) | 0.025 |
| Rural residence at 14 |
0.41 | (−0.11,0.92) | 0.121 | 0.41 | (−0.11,0.92) | 0.123 | 0.41 | (−0.24,1.05) | 0.218 |
| Birth year | −0.00 | (−0.10,0.09) | 0.944 | −0.00 | (−0.10,0.09) | 0.930 | −0.00 | (−0.10,0.09) | 0.926 |
| Immigrant * education | −0.43 | (−0.79,−0.07) | 0.020 | ||||||
| Southern birth * education | −0.02 | (−0.25,0.20) | 0.840 | ||||||
| Rural residence at 14 * education |
−0.00 | (−0.24,0.24) | 0.994 | ||||||
PCS is physical health component summary score.
Education is centered at 12, and birth year is centered at 1960 so the constant is interpretable.
Education is coded linearly as years of education; a 1-unit increase in education is a 1-year increase in schooling.
Table 7.
MCS at 40 – main effects and demographic interactions, weighted to 2004 (N = 5,682)
| Base model | Female interaction | Race interaction | cSES interaction | |||||||||
|---|---|---|---|---|---|---|---|---|---|---|---|---|
| Variables | Beta | 95%CI | p-value | Beta | 95%CI | p-value | Beta | 95%CI | P− value |
Beta | 95%CI | P-value |
| Constant | 54.0 9 |
(53.64,54.54) | <0.000 5 |
54.0 9 |
(53.63,54.55) | <0.000 5 |
54.0 5 |
(53.59,54.51) | <0.000 5 |
54.08 | (53.63,54.53) | <0.000 5 |
| Education (yrs) | 0.59 | (0.31,0.87) | <0.000 5 |
0.56 | (0.18,0.95) | (0.004 | 0.71 | (0.33,1.08) | <0.000 5 |
0.60 | (0.25,0.94) | 0.001 |
| Female | −2.21 | (−2.68,−1.73) | <0.000 5 |
−2.22 | (−2.72,−1.71) | <0.000 5 |
−2.20 | (−2.68,−1.72) | <0.000 5 |
−2.21 | (−2.68,−1.73) | <0.000 5 |
| Non-Hispanic Black |
0.63 | (0.05,1.21) | 0.034 | 0.63 | (0.04,1.21) | 0.035 | 0.66 | (0.07,1.25) | 0.029 | 0.63 | (0.05,1.21) | 0.033 |
| Hispanic | 1.20 | (0.38,2.03) | 0.004 | 1.20 | (0.38,2.03) | 0.004 | 1.18 | (0.36,2.00) | 0.005 | 1.20 | (0.38,2.03) | 0.004 |
| Other Race / missing |
0.81 | (−0.09,1.70) | 0.076 | 0.81 | (−0.09,1.70) | 0.078 | 0.90 | (−0.04,1.85) | 0.062 | 0.81 | (−0.09,1.70) | 0.077 |
| Childhood SES | −0.89 | (−1.48,−0.29) | 0.003 | −0.88 | (−1.48,−0.29) | 0.003 | −0.87 | (−1.46,−0.28) | 0.004 | −0.88 | (−1.48,−0.29) | 0.004 |
| Southern birth | 0.13 | (−0.42,0.67) | 0.651 | 0.12 | (−0.42,0.67) | 0.654 | 0.12 | (−0.42,0.67) | 0.653 | 0.12 | (−0.42,0.67) | 0.653 |
| Immigrant | −0.88 | (−2.25,0.49) | 0.210 | −0.88 | (−2.25,0.49) | 0.210 | −0.87 | (−2.24,0.50) | 0.215 | −0.88 | (−2.25,0.49) | 0.210 |
| Rural residence at 14 |
0.25 | (−0.33,0.84) | 0.394 | 0.25 | (−0.33,0.84) | 0.394 | 0.25 | (−0.34,0.84) | 0.402 | 0.26 | (−0.33,0.84) | 0.392 |
| Birth year | 0.02 | (−0.09,0.12) | 0.772 | 0.02 | (−0.09,0.12) | 0.772 | 0.02 | (−0.09,0.12) | 0.741 | 0.02 | (−0.09,0.12) | 0.771 |
| Female * education |
0.05 | (−0.49,0.59) | 0.862 | |||||||||
| Non-Hispanic Black * education |
−0.33 | (−0.85,0.19) | 0.218 | |||||||||
| Hispanic * education |
−0.46 | (−1.07,0.16) | 0.144 | |||||||||
| Other Race * education |
−0.43 | (−1.32,0.47) | 0.349 | |||||||||
| cSES * education |
−0.02 | (−0.55,0.52) | 0.953 | |||||||||
MCS is mental health component summary score.
Education is centered at 12, and birth year is centered at 1960 so the constant is interpretable.
Education is coded linearly as years of education until 13 years, and flat thereafter (i.e. everything after 13 years of schooling is recoded as 13 years because we found this specification was the best fit for the MCS data). A 1-unit increase in education is a 1-year increase in schooling until 13 years.
Table 8.
MCS at 40 –geographic interactions, weighted to 2004 (N = 5,682)
| Southern birth interaction | Immigrant interaction | Rural residence at 14 interaction | |||||||
|---|---|---|---|---|---|---|---|---|---|
| Variables | Beta | 95%CI | p-value | Beta | 95%CI | p-value | Beta | 95%CI | p-value |
| Constant | 54.08 | (53.63,54.53) | <0.0005 | 54.09 | (53.62,54.56) | <0.0005 | 54.07 | (53.61,54.52 ) |
<0.0005 |
| Education | 0.60 | (0.31,0.88) | <0.0005 | 0.57 | (0.16,0.97) | 0.006 | 0.67 | (0.35,0.99) | <0.0005 |
| Female | −2.21 | (−2.69,−1.73) | <0.0005 | −2.21 | (−2.69,−1.73) | <0.0005 | −2.21 | (−2.68,−1.73) | <0.0005 |
| Non-Hispanic Black | 0.63 | (0.05,1.21) | 0.034 | 0.63 | (0.04,1.21) | 0.035 | 0.63 | (0.05,1.21) | 0.034 |
| Hispanic | 1.18 | (0.36,2.01) | 0.005 | 1.20 | (0.37,2.03) | 0.005 | 1.23 | (0.40,2.06) | 0.004 |
| Other Race / missing | 0.81 | (−0.08,1.71) | 0.074 | 0.81 | (−0.08,1.71) | 0.074 | 0.78 | (−0.11,1.68) | 0.086 |
| Childhood SES | −0.89 | (−1.48,−0.29) | 0.003 | −0.89 | (−1.48,−0.29) | 0.003 | −0.88 | (−1.48,−0.29) | 0.003 |
| Southern birth | 0.13 | (−0.41,0.67) | 0.643 | 0.12 | (−0.44,0.68) | 0.671 | 0.13 | (−0.42,0.67) | 0.648 |
| Immigrant | −0.81 | (−2.18,0.56) | 0.248 | −0.88 | (−2.25,0.49) | 0.209 | −0.87 | (−2.25,0.50) | 0.211 |
| Rural residence at 14 |
0.25 | (−0.33,0.84) | 0.393 | 0.25 | (−0.33,0.84) | 0.398 | 0.31 | (−0.29,0.91) | 0.317 |
| Birth year | 0.02 | (−0.09,0.12) | 0.768 | 0.02 | (−0.09,0.12) | 0.775 | 0.02 | (−0.09,0.12) | 0.745 |
| Immigrant * education |
−0.33 | (−1.49,0.84) | 0.585 | ||||||
| Southern birth * education |
0.04 | (−0.51,0.59) | 0.884 | ||||||
| Rural residence at 14 * education |
−0.37 | (−0.99,0.24) | 0.231 | ||||||
MCS is mental health component summary score.
Education is centered at 12, and birth year is centered at 1960 so the constant is interpretable.
Education is coded linearly as years of education until 13 years, and flat thereafter (i.e. everything after 13 years of schooling is recoded as 13 years because we found this specification was the best fit for the MCS data). A 1-unit increase in education is a 1-year increase in schooling until 13 years.
Table 9.
Differential returns to education by cSES, with cSES operationalized as father’s education (N = 5,417)
| PCS | MCS | |||||||||||
|---|---|---|---|---|---|---|---|---|---|---|---|---|
| Base model | cSES interaction | Base model | cSES interaction | |||||||||
| Beta | 95%CI | p-value | Beta | 95%CI | P-value | Beta | 95%CI | p-value | Beta | 95%CI | p-value | |
| Constant (high cSES) |
50.60 | (50.07, 51.14) |
< 0.0005 | 50.81 | (50.25, 51.37) |
< 0.0005 |
53.88 | (53.39, 54.37) |
< 0.0005 |
53.82 | (53.29, 54.35) |
< 0.0005 |
| Education | 0.93 | (0.79, 1.06) | < 0.0005 | 0.81 | (0.67, 0.96) | < 0.0005 |
0.83 | (0.51, 1.16) |
< 0.0005 |
0.95 | (0.45, 1.44) |
< 0.0005 |
| Low cSES | −1.17 | (−1.85, −0.49) | 0.001 | −1.38 | (−2.13,
− 0.64) |
< 0.0005 |
−0.31 | (−0.95, 0.32) |
0.337 | −0.28 | (−0.94, 0.38) |
0.400 |
| Low cSES*education |
0.37 | (0.05, 0.68) | 0.022 | −0.19 | (−0.83, 0.46) |
0.570 | ||||||
PCS is physical health component summary score; MCS is mental health component summary score.
Education is centered at 12, and birth year is centered at 1960 so the constant is interpretable.
For PCS, education is coded linearly as years of education; a 1-unit increase in education is a 1-year increase in schooling.
For MCS, education is coded linearly as years of education until 13 years, and flat thereafter (i.e. everything after 13 years of schooling is recoded as 13 years because found this specification was the best fit for the data). A 1-unit increase in education is a 1-year increase in schooling until 13 years. Models adjusted for cSES, birth place, and rural residence at age 14; we modeled main effects and interactions for Other race men and Other race women but did not display these results due to ambiguity in interpretation.
There were N = 741 individuals missing father’s education, so the sample size for this analysis was smaller than the main analysis. Those missing father’s education were disproportionately Black (55%).
Footnotes
Publisher's Disclaimer: This is a PDF file of an unedited manuscript that has been accepted for publication. As a service to our customers we are providing this early version of the manuscript. The manuscript will undergo copyediting, typesetting, and review of the resulting proof before it is published in its final citable form. Please note that during the production process errors may be discovered which could affect the content, and all legal disclaimers that apply to the journal pertain.
References
- 1.Cohen AK, Syme SL. Education: A missed opportunity for public health intervention. Am J Public Health 2013;103(6):997–1001. 10.2105/AJPH.2012.300993. [DOI] [PMC free article] [PubMed] [Google Scholar]
- 2.Zajacova A, Lawrence EM. The Relationship Between Education and Health: Reducing Disparities Through a Contextual Approach 2018. [DOI] [PMC free article] [PubMed]
- 3.Bauer GR. Incorporating intersectionality theory into population health research methodology: Challenges and the potential to advance health equity. Soc Sci Med 2014;110:10–17. 10.1016/j.socscimed.2014.03.022. [DOI] [PubMed] [Google Scholar]
- 4.Ross CE, Mirowsky J. Sex differences in the effect of education on depression: Resource multiplication or resource substitution? Soc Sci Med 2006;63(5):1400–1413. 10.1016/j.socscimed.2006.03.013. [DOI] [PubMed] [Google Scholar]
- 5.Liu SY, Manly JJ, Capistrant BD, Glymour MM. Historical differences in school term length and measured blood pressure: Contributions to persistent racial disparities among US-born adults. PLoS One 2015;10(6):1–13. 10.1371/journal.pone.0129673. [DOI] [PMC free article] [PubMed] [Google Scholar]
- 6.Cohen AK, Rehkopf DH, Deardorff J, Abrams B. Education and obesity at age 40 among American adults. Soc Sci Med 2013;78:34–41. [DOI] [PMC free article] [PubMed] [Google Scholar]
- 7.Assari S, Mistry R. Educational Attainment and Smoking Status in a National Sample of American Adults ; Evidence for the Blacks ‘ Diminished Return. Int J Environ Res Public Health 2018;15(763). 10.3390/ijerph15040763. [DOI] [PMC free article] [PubMed] [Google Scholar]
- 8.Goldman N, Kimbro RT, Turra CM, Pebley AR. Socioeconomic gradients in health for White and Mexican-origin populations. Am J Public Health 2006;96(12):2186–2193. 10.2105/AJPH.2005.062752. [DOI] [PMC free article] [PubMed] [Google Scholar]
- 9.Turra CM, Goldman N. Socioeconomic Differences in Mortality Among U.S. Adults: Insights Into the Hispanic Paradox. Journals Gerontol Ser B Psychol Sci Soc Sci 2007;62(3):S184–S192. 10.1093/geronb/62.3.S184. [DOI] [PubMed] [Google Scholar]
- 10.Kimbro RT, Bzostek S, Goldman N, Rodríguez G. Race, ethnicity, and the education gradient in health. Health Aff 2008;27(2):361–372. 10.1377/hlthaff.27.2.361. [DOI] [PubMed] [Google Scholar]
- 11.Haas S Trajectories of functional health: The “long arm” of childhood health and socioeconomic factors. Soc Sci Med 2008;66(4):849–861. 10.1016/j.socscimed.2007.11.004. [DOI] [PubMed] [Google Scholar]
- 12.Hayward MD, Gorman BK. The long arm of childhood: the influence of early-life social conditions on men’s mortality. Demography 2004;41(1):87–107. 10.1353/dem.2004.0005. [DOI] [PubMed] [Google Scholar]
- 13.Wong MD, Shapiro MF, Boscardin WJ, Ettner SL. Contribution of Major Diseases to Disparities in Mortality. N Engl J Med 2002;347(20):1585–1592. 10.1056/NEJMsa012979. [DOI] [PubMed] [Google Scholar]
- 14.Satcher D, Fryer GE, McCann J, Troutman A, Woolf SH, Rust G. What if we were equal? A comparison of the black-white mortality gap in 1960 and 2000. Health Aff 2005;24(2):459–464. 10.1377/hlthaff.24.2.459. [DOI] [PubMed] [Google Scholar]
- 15.Barford A, Dorling D, Smith GD, Shaw M. Life expectancy: women now on top everywhere: During 2006, even in the poorest countries, women can expect to outlive men. BMJ Br Med J 2006;332(7545):808 10.1136/bmj.332.7545.808. [DOI] [PMC free article] [PubMed] [Google Scholar]
- 16.Eaton NR, Keyes KM, Krueger RF, et al. An Invariant Dimensional Liability Model of Gender Differences in Mental Disorder Prevalence : Evidence from a National Sample. J Abnorm Psychol 2012;121(1):282–288. 10.1037/a0024780.An. [DOI] [PMC free article] [PubMed] [Google Scholar]
- 17.Moy E, Garcia MC, Bastian B, et al. Leading Causes of Death in Nonmetropolitan and Metropolitan Areas— United States, 1999–2014. MMWR Surveill Summ 2017;66(SS-1). 10.15585/mmwr.ss6601a1. [DOI] [PMC free article] [PubMed] [Google Scholar]
- 18.Glymour MM, Avendaño M, Berkman LF. Is the “Stroke Belt” worn from childhood? Risk of first stroke and state of residence in childhood and adulthood. Stroke 2007;38(9):2415–2421. 10.1161/STROKEAHA.107.482059. [DOI] [PubMed] [Google Scholar]
- 19.Palloni A, Arias E. Paradox Lost: Explaining the Hispanic Adult Mortality Advantage 2004;41(3):385–415. [DOI] [PubMed] [Google Scholar]
- 20.Hummer RA, Rogers RG, Nam CB, Leclere FB. Race/Ethnicity, Nativity, and U.S. Adult Mortality 2018;80(1):136–153. [Google Scholar]
- 21.Krieger N, Waterman PD, Kosheleva A, et al. Exposing Racial Discrimination: Implicit & Explicit Measures-The My Body, My Story Study of 1005 US-Born Black & White Community Health Center Members. PLoS One 2011;6(11). 10.1371/journal.pone.0027636. [DOI] [PMC free article] [PubMed] [Google Scholar]
- 22.Chetty R, Hendren N, Jones MR, Porter SR. Race and Economic Opportunity in the United States: An Intergenerational Perspective; 2018. doi:http://www.nber.org/papers/w24441.
- 23.Kaplan GA, Ranjit N, Burgard S. Lifting Gates ‐‐ Lengthening Lives: Did Civil Rights Policies Improve the Health of African ‐ American Women in the 1960ʹs and 1970ʹs? In: Schoeni RF, House JS, Kaplan GA, Pollack H, eds. Making Americans Healthier: Social and Economic Policy as Health Policy New York, NY: Russell Sage Foundation; 2008:145–172. [Google Scholar]
- 24.Collins WJ. The labor market impact of state-level anti-discrimination laws, 1940 – 1960. Ind Labor Relations Rev 2003;56(2):244–272. [Google Scholar]
- 25.Bécares L, Priest N. Understanding the Influence of Race / Ethnicity, Gender, and Class on Inequalities in Academic and Non-Academic Outcomes among Eighth-Grade Students: Findings from an Intersectionality Approach 2015:1–17. 10.1371/journal.pone.0141363. [DOI] [PMC free article] [PubMed]
- 26.McGraw R, Lubienski ST, Strutchens ME. A Closer Look at Gender in NAEP Mathematics Achievement and Affect Data: Intersections with Achievement, Race / Ethnicity, and Socioeconomic Status 2018;37(2):129–150. [Google Scholar]
- 27.Coley RJ. Differences in the Gender Gap: Comparisons Across Racial / Ethnic Groups in Education and Work 2001.
- 28.Montez JK, Hummer RA, Hayward MD. Educational Attainment and Adult Mortality in the United States: A Systematic Analysis of Functional Form. Demography 2012;49(1):315–336. 10.1007/s13524-011-0082-8. [DOI] [PMC free article] [PubMed] [Google Scholar]
- 29.Ware J, Kosinski M, Keller SD. A 12-Item Short-Form Health Survey: Construction of Scales and Preliminary Tests of Reliability and Validity A. Med Care 1996;34(3):220–233. [DOI] [PubMed] [Google Scholar]
- 30.NLSY79 Appendix 19: SF-12 Health Scale Scoring The. https://www.nlsinfo.org/content/cohorts/nlsy79/other-documentation/codebooksupplement/nlsy79-appendix-19-sf-12-health-scale. Published 1978. Accessed March 9, 2018.
- 31.Vable AM, Kiang M V., Basu S, et al. Military Service, Childhood Socio-Economic Status, and Late-Life Lung Function: Korean War Era Military Service Associated with Smaller Disparities. Mil Med 2018;(epub ahead of print). 10.1093/milmed/usx196. [DOI] [PMC free article] [PubMed] [Google Scholar]
- 32.Vable AM, Canning D, Glymour MMM, Kawachi I, Jimenez MPMP, Subramanian SVS V. Can social policy influence socioeconomic disparities? Korean War GI Bill eligibility and markers of depression. Ann Epidemiol 2016;26(2):129–135.e3. 10.1016/j.annepidem.2015.12.003. [DOI] [PMC free article] [PubMed] [Google Scholar]
- 33.Vable AM, Eng CW, Mayeda ER, et al. Mother’s education and late-life disparities in memory and dementia risk among US military veterans and non-veterans. J Epidemiol Community Heal 2018;0:1–6. 10.1136/jech-2018-210771. [DOI] [PMC free article] [PubMed] [Google Scholar]
- 34.Lopez WD, Kruger DJ, Delva J, et al. Health Implications of an Immigration Raid_ Findings from a Latino Community in the Midwestern United States. J Immigr Minor Heal 2017;19(3):702–708. 10.1007/s10903-016-0390-6. [DOI] [PMC free article] [PubMed] [Google Scholar]
- 35.Novak NL, Geronimus AT, Martinez-Cardoso AM. Change in birth outcomes among infants born to Latina mothers after a major immigration raid. Int J Epidemiol 2017;46(3):839–849. 10.1093/ije/dyw346. [DOI] [PMC free article] [PubMed] [Google Scholar]
- 36.Covington-Ward Y, Agbemenu K, Matambanadzo A. “We Feel like It Was Better Back Home” Stress, Coping, and Health in a U.S. Dwelling African Immigrant Community Vol 29; 2018. 10.1353/hpu.2018.0018. [DOI] [PubMed] [Google Scholar]
- 37.Somervell PD, Leaf PJ, Weissman MM, Blazer DG, Bruce ML. The prevalence of major depression in black and white adults in five United States communities. Am J Epidemiol 1989;130(4):725–735. http://www.ncbi.nlm.nih.gov/entrez/query.fcgi?cmd=Retrieve&db=PubMed&dopt=Citation&list_uids=2788995. [DOI] [PubMed] [Google Scholar]
- 38.Riolo SA, Nguyen TA, Greden JF, King CA. Prevalence of depression by race/ethnicity: Findings from the national health and nutrition examination survey III. Am J Public Health 2005;95(6):998–1000. 10.2105/AJPH.2004.047225. [DOI] [PMC free article] [PubMed] [Google Scholar]
- 39.Dunlop DD, Song J, Lyons JS, Manheim LM, Chang RW. Racial/Ethnic Differences in Rates of Depression among Preretirement Adults. Am J Public Health 2003;93(11):1945–1952. 10.2105/AJPH.93.11.1945. [DOI] [PMC free article] [PubMed] [Google Scholar]
- 40.Bibbins-Domingo K, Pletcher MJ, Lin F, et al. Racial Differences in Incident Heart Failure among Young Adults. Perspective 2010;363(1):1–3. 10.1056/NEJMp1002530. [DOI] [PMC free article] [PubMed] [Google Scholar]
- 41.Wolfers J, Leonhardt D, Quealy K. 1.5 Million Missing Black Men. The Upshot: The New York Times https://www.nytimes.com/interactive/2015/04/20/upshot/missing-black-men.html. Published 2015.
- 42.Vable AM, Gilsanz P, Nguyen TT, Kawachi I, Glymour MM. Validation of a theoretically motivated approach to measuring childhood socioeconomic circumstances in the Health and Retirement Study. PLoS One 2017;12(10):e0185898 10.1371/journal.pone.0185898. [DOI] [PMC free article] [PubMed] [Google Scholar]