Abstract
Cholangiocarcinoma is a life‐threatening disease with a poor prognosis. Although genome analysis unraveled some genetic mutation profiles in cholangiocarcinoma, it remains unknown whether such genetic abnormalities relate to the effects of anticancer drugs. Mutations in isocitrate dehydrogenase 1 and 2 (IDH1/2) are exclusively found in almost 20% of intrahepatic cholangiocarcinoma (ICC). Recently, the anticancer effects of BET inhibitors including JQ1 have been shown in various tumors. In the present study, we report that the antigrowth effect of JQ1 differs among ICC cells and IDH1 mutation sensitizes ICC cells to JQ1. RBE cells harboring IDH1 mutation was more sensitive to JQ1 than HuCCT1 or HuH28 cells with wild‐type IDH1. JQ1 induced apoptosis only in RBE cells through the upregulation of proapoptotic genes BAX and BIM. We found that the antigrowth effect was not attributed to downregulation of the MYC gene as a well‐known target of JQ1 in various cancer cells. Notably, the forced expression of mutant IDH1 successfully sensitized HuCCT1 cells to JQ1. In addition, AGI‐5198, a selective inhibitor of mutant IDH1 partially reversed the decrease in viability after JQ1 treatment and also suppressed the JQ1‐induced apoptosis in RBE cells. These data suggest that IDH1 mutation contributed to the growth inhibitory effect of JQ1 in RBE cells. Furthermore, given that the effect of mutant IDH1 was not recapitulated in glioblastoma cells, the enhancement of JQ1 sensitivity by IDH1 mutation seems to be specific for ICC cells. Our findings propose a new stratified therapeutic strategy based on IDH1 mutation in ICC.
Keywords: apoptosis, BET inhibitor, cholangiocarcinoma, IDH mutation, MYC
1. INTRODUCTION
Biliary tract cancer (BTC) is classified by anatomical location into intrahepatic (ICC), extrahepatic (ECC) cholangiocarcinoma, and gallbladder cancer.1 Although congenital biliary malformations, hepatobiliary flukes, and chronic inflammation, including primary sclerosing cholangitis or viral hepatitis, are known as risk factors, a large proportion of BTC often arise without obvious causes.2, 3 Although the incidence of BTC has gradually increased, its prognosis remains unfavorable and the 5‐year survival rate is less than 5%‐10%.4, 5 This is because few effective antitumor regimens exist for advanced BTC.2, 4, 6
Recent sequence studies have identified genomic abnormalities in BTC, with clear distinctions among the different anatomical BTC subtypes.1, 7, 8, 9 Somatic gene alterations in kinase‐RAS modules (EGFR, ERBB3, and PTEN) are specifically seen in gallbladder cancers.1 This is in agreement with our previous reports that the combinatorial inhibition of MAPK and PI3K mammalian target of rapamycin pathways exerted antigrowth effects in gallbladder cancer cells.10 TP53 and SMAD4 genes are more frequently mutated in a set of liver fluke‐associated BTC. In contrast, somatic mutations in some chromatin remodeling genes, including BAP1, IDH1/2, ARID1A, and PBRM1 are found in non‐infection‐associated BTC,7, 8, 9 which suggests the possibility that the dysregulation of chromatin remodeling might be involved in the development of BTC.
Isocitrate dehydrogenase (IDH) is the enzyme responsible for the conversion of isocitrate to α‐ketoglutarate (α‐KG) in the cytosol (IDH1) and mitochondria (IDH2).11 When the mutation occurs in the catalytic site of the enzyme, a specific metabolite R(–)‐2‐hydroxyglutarate (2‐HG) is produced from α‐KG.12 2‐HG inhibits the activity of α‐KG‐dependent histone and DNA demethylases, which leads to epigenetic alterations.13, 14 It is reported that 2‐HG‐mediated epigenetic dysregulation may lead to impaired differentiation of various progenitor cells and, ultimately, to carcinogenesis.15, 16, 17, 18 Consistently, IDH1/2 mutations have been identified in several types of malignancies, including glioma, acute myeloid leukemia, and cartilage tumors.19, 20, 21 In BTC, IDH1/2 mutations occur in 8%‐25% of ICC, but not in ECC or gallbladder cancers. Interestingly, IDH1/2‐mutant ICC were accumulated in the cohorts of patients without chronic hepatobiliary disease,1, 8, 22 which may suggest the substantial role of IDH1/2 mutations in the pathogenesis or treatment of ICC. Indeed, recent reports have shown that the activity of SRC kinase played a pivotal role in the growth of ICC with mutant IDH and that the SRC inhibitor dasatinib was specifically effective for ICC cell lines with mutant IDH.23
Bromodomain and extraterminal domain (BET) family proteins (BRD2, BRD3, BRD4, and BRDT) recognize acetylated lysine residues on histone tails and facilitate transcriptional activation through the recruitment of transcriptional regulatory complexes.24 Recent reports proposed that JQ1, a selective inhibitor of BET proteins, exerts antigrowth effects in many types of cancer, inducing cell cycle arrest in cancer cells followed by the downregulation of the MYC oncogene.25, 26, 27, 28, 29, 30 However, the efficacy of JQ1 for BTC remains unknown.30 In the present study, we investigated the therapeutic efficacy of JQ1 for ICC cells and identified the possible involvement of mutant IDH1 in the sensitivity to JQ1.
2. MATERIALS AND METHODS
2.1. Cell lines
HuCCT1 and HuH28 cells were obtained from JCRB cell bank (Osaka, Japan). RBE cells were obtained from Riken Cell Bank (Tsukuba, Japan). U‐87MG and IDH1 mutant‐U87 isogenic cells were obtained from ATCC (Manassas, VA, USA). HuCCT1, HuH28 and RBE cells were cultured in RPMI‐1640 (Sigma‐Aldrich, St Louis, MO, USA) media supplemented with 10% FBS (Invitrogen, Carlsbad, CA, USA), 100 units/mL penicillin, and 100 μg/mL streptomycin. U‐87MG and IDH1 mutant‐U87 isogeneic cells were cultured in E‐MEM (Wako Pure Chemical Corp., Osaka, Japan) media supplemented with 10% FBS (Invitrogen), 100 units/mL penicillin, and 100 μg/mL streptomycin. All cells were maintained at 37°C and 5% CO2.
2.2. Reagents
(+)‐JQ1 (JQ1) was purchased from MedChem Express (Princeton, NJ, USA). AGI‐5198 was purchased from Cayman Chemical (Ann Arbor, MI, USA).
2.3. Cell viability and proliferation assay
Cell proliferation was assessed using CCK‐8 (Dojindo, Kumamoto, Japan). HuCCT1, HuH28, and RBE cells were seeded at 2 × 10³ to 4 × 10³ cells per well in 96‐well plates. On the following day, all cells were treated with the indicated concentrations of drugs. After 24, 48, and 72 hours, viable cells were quantified by using a CCK‐8 assay in accordance with the manufacturer's protocol. Briefly, CCK‐8 solution was added and incubated for 2 hours. Viable cells were determined by measurement of the absorbance at 450 nm.
2.4. Cell cycle analysis
HuCCT1 and RBE cells (5 × 10⁵ cells) were seeded into 60‐mm culture dishes. The next day, all cells were treated with DMSO or JQ1 (1 μmol/L). After 24 hours, the cells were harvested, washed in ice‐cold PBS and fixed with 70% ethanol at –20°C for 3 hours. After the cells were washed, RNase (10 μg/mL) treatment was applied and stained with propidium iodide (5 μg/mL) at room temperature for 10 minutes. Flow cytometry (FCM) was carried out using a Guava EasyCyte Plus (Millipore, Burlington, MA, USA), and cell cycle distribution was calculated by using Cytosoft (Millipore). All experiments were carried out in triplicate.
2.5. Western blot analysis
Whole cell lysates were prepared in RIPA lysis buffer supplemented with protease inhibitor cocktail (Complete Mini; Roche, Basel, Switzerland). The lysates were sonicated for 5 minutes, centrifuged at 12 000 × g for 20 minutes at 4°C, and the supernatants were collected. Immunoblotting was carried out as previously described.29 The following primary antibodies were used at the indicated dilutions: anti‐β‐actin (1:10 000, A5441; Sigma‐Aldrich), anti‐p21 (1:1000, Sc‐397; Santa Cruz Biotechnology, Dallas, TX, USA), anti‐cleaved poly ADP‐ribose polymerase (PARP, 1:1000, #9541; Cell Signaling Technology, Danvers, MA, USA), anti‐IDH1 (1:200, 014‐24061; Wako), and anti‐IDH1‐R132S (1:200, 015‐24091; Wako).
2.6. Quantitative reverse transcription‐polymerase chain reaction (qRT‐PCR)
Total RNA was extracted from the cultured cells by using an RNeasy Mini Kit (Qiagen, Hilden, Germany) in accordance with the manufacturer's protocol. qRT‐PCR was carried out on the StepOnePlus Real‐Time PCR System (Applied Biosystems, Foster City, CA, USA) using THUNDERBIRD SYBR qPCR Mix (Toyobo Co. Ltd, Osaka, Japan). Values were normalized to the expression of ACTB mRNA. Primers used in this study are shown in Table S1.
2.7. Caspase‐3/7 activity
Cells were seeded at 2 × 10³ cells per well in 96‐well plates. On the following day, the cells were treated with JQ1, AGI‐5198, or a combination of both at the indicated concentration. After 48 hours, caspase‐3/7 activity was assessed by using a Caspase‐Glo 3/7 Assay (G8090; Promega, Madison, WI, USA) in accordance with the manufacturer's protocol.
2.8. DNA sequencing
Genomic DNA was extracted from incubated cells using a QIAamp DNA Mini Kit (Qiagen) in accordance with the manufacturer's protocol. Extracted DNA was amplified by PCR. The primer sequences used to amplify IDH1 exon 4 (R132) were 5′‐TCAGAGAAGCCATTATCTGCAAAAATAT‐3′ (forward) and 5′‐GGCCATGAAAAAAAAAACATGC‐3′ (reverse). The PCR cycling conditions were 95°C for 10 minutes, 40 cycles of (95°C for 30 seconds, 50°C for 30 seconds, 72°C for 30 seconds), and 72°C for 7 minutes. Successfully amplified DNA was analyzed by using the direct sequence method.
2.9. Lentiviral‐mediated gene knockdown
For knockdown experiments, the lentiviral plasmids expressing specific shRNAs were obtained from Open Biosystems (Huntsville, AL, USA). The clones used were as follows: sh‐MYC‐1 (TRCN0000174055) and sh‐MYC‐2 (TRCN0000039640). Viral particles were produced in 293T cells as previously described.31 Lentiviruses expressing shRNAs were infected to RBE cells in the media with polybrene (8 μg/mL). After 24 hours, transfected cells were selected with puromycin (4 μg/mL).
2.10. Forced expression of mutant IDH1
Human wild‐type IDH1 expression vector (pFN21AE0433) was purchased from Kazusa DNA Research Institutes (Chiba, Japan). The IDH1 R132S mutant was generated from wild‐type IDH1ORF in this plasmid using a QuikChange Site‐Directed Mutagenesis Kit (Agilent Technologies, Santa Clara, CA, USA) and primers 5′‐GATCCCCATAAGCATGACTACCTATGATGATAGGTTC‐3′ for sense and 5′‐GAACCTATCATCATAGGTAGTCATGCTTATGGGGATC‐3′ for antisense. The wild‐type and mutant IDH1 were ligated into the multiple cloning sites of pLVSIN‐CMV Vector (TAKARA Bio Inc., Kusatsu, Japan). Viral particles were produced in 293T cells as previously described.31 HuCCT1 cells were infected with lentiviruses for 12‐16 hours and selected with hygromycin (800 μg/mL).
2.11. Chromatin immunoprecipitation
Chromatin immunoprecipitation was carried out as described previously.29 Briefly, HuCCT1 and RBE cells (2 × 10⁶ cells) were seeded into 10‐mm culture dishes and treated with DMSO or JQ1 (1 μmol/L) for 36 hours. All cells were cross‐linked in 1% formaldehyde/PBS and quenched by 0.125 mol/L glycine. Cross‐linked cells were resuspended in lysis buffer and extracted nuclear pellets were sonicated by using Bioruptor UCD‐250 (Cosmo Bio, Tokyo, Japan). Soluble chromatin lysate was immunoprecipitated by using the following antibodies: anti‐Tri‐Methyl‐histone H3 lysine 4 (ab8580; Abcam, Cambridge, UK) and control IgG (#2729; Cell Signaling Technology). Extracted DNA was analyzed by quantitative real‐time PCR, and the data were presented as percentage of input. Primer sequences for target regions are listed in Table S2.
2.12. Statistical analysis
Data are presented as means ± standard error of the mean (SEM). Statistical significance was evaluated by two‐tailed Student's t test. Differences were considered statistically significant at P < 0.05.
3. Results
3.1. Sensitivity to JQ1 differs among ICC cell lines
Three ICC cell lines; RBE, HuCCT1, and HuH28, were treated with JQ1 for 72 hours. JQ1 suppressed the viability of RBE cells in a dose‐dependent method. IC50 of JQ1 in RBE cells was below 0.5 μmol/L (Figure 1A). In contrast, the viability of HuCCT1 cells was only affected by a high dose over 5 μmol/L JQ1 (Figure 1A). Huh28 cells were refractory to JQ1 (Figure 1A). Treatment of 1 μmol/L JQ1 inhibited the growth of RBE cells, but not of HuCCT1 cells (Figure 1B). These data indicated that the sensitivity to JQ1 differed considerably among ICC cells.
Figure 1.
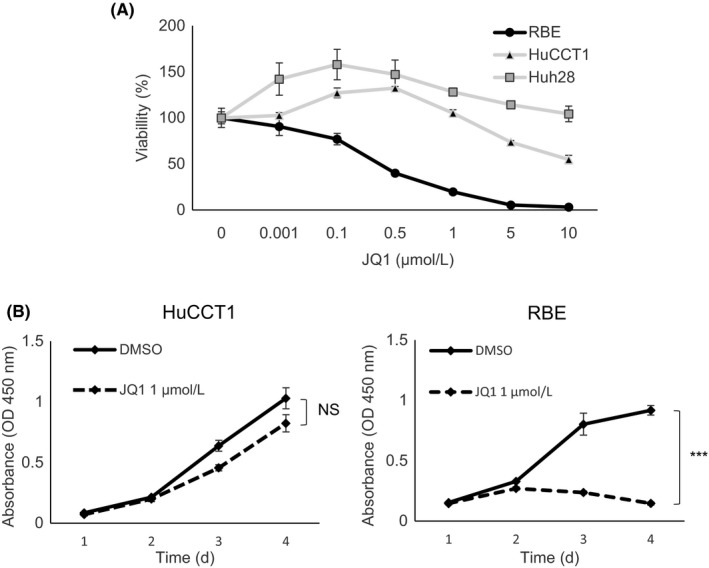
Effect of JQ1 against human intrahepatic cholangiocarcinoma (ICC) cell lines. A, Dose‐response curves illustrate the effect of JQ1 on the growth of HuCCT1, HuH28, and RBE cells. Cells were treated with JQ1 at the indicated concentrations for 72 h, and viability was assessed by using the CCK‐8 assay. B, Proliferation of HuCCT1 and RBE cells in DMSO or JQ1 (1 μmol/L) was assessed by CCK‐8 assay over 4 days. Data are presented as the mean ± SEM (n = 4, ***P < 0.001; NS, not significant, Student's t test)
3.2. JQ1 suppresses G1/S transition in ICC cells regardless of the subsequent antigrowth effect
It is reported that the antitumor effects of JQ1 occur mainly in a cytostatic way in various cancer cells.26, 27 Cell cycle analysis showed that JQ1 suppressed G1/S transition not only in RBE cells, but also in HuCCT1 cells (Figure 2A). Consistent with the cell cycle analysis, expression of the CDK inhibitor gene p21 was upregulated in both cell lines (Figure 2B). Western blotting also confirmed the induction of p21 protein in both the JQ1‐treated cell lines (Figure 2C). However, given the subsequent growth in HuCCT1 cells (Figure 1B), it was clear that the difference of antiproliferative effects between the two cell lines could not be explained by the alteration of cell cycle kinetics.
Figure 2.
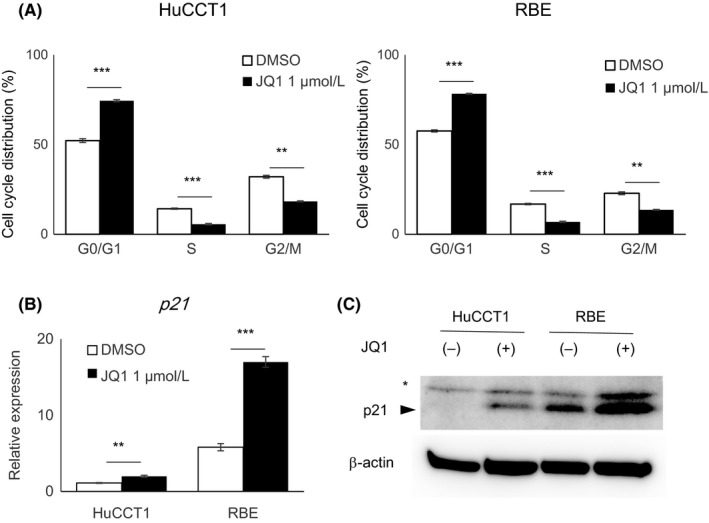
Deceleration of the cell cycle in HuCCT1 and RBE cells by JQ1. A, HuCCT1 and RBE cells were treated with DMSO or JQ1 (1 μmol/L) for 24 h and stained with propidium iodide (PI) for cell cycle analysis by flow cytometry. Data are presented as mean ± SEM (n = 3, **P < 0.01, ***P < 0.001, Student's t test). B, Gene expression of p21, relative to ACTB, was determined by qRT‐PCR. Data are presented as the mean ± SEM (n = 4, **P < 0.01, ***P < 0.001, Student's t test). C, Protein expression level of p21 was assessed by western blotting. Asterisk indicates a non‐specific band
3.3. JQ1 induces apoptosis in RBE but not in HuCCT1 cells
Despite the similar suppression of G1/S transition, only RBE cells, but not HuCCT1 cells, were detached from the culture dish after 48 hours of JQ1 treatment (Figure 3A). From these phenomena, we estimated the induction of apoptotic cell death in JQ1‐treated RBE cells and analyzed caspase‐3/7 activity in both cell lines. Caspase‐3/7 was activated after JQ1 treatment in RBE cells, but not in HuCCT1 cells (Figure 3B). Western blotting confirmed that the cleavage of PARP, which is catalyzed by caspase‐3 in apoptosis, was increased by JQ1 treatment in RBE cells only (Figure 3C). These data suggested that the induction of apoptosis contributed to the antigrowth effect of JQ1 in RBE cells. qRT‐PCR showed upregulation of the proapoptotic genes BIM and BAX after JQ1 treatment in RBE cells only, but not in HuCCT1 cells (Figure 3D). ChIP confirmed the increased level of the active transcription marker, histone H3 lysine 4 trimethylation (H3K4me3), at the promoter region of the two genes (Figure 3E,F).
Figure 3.
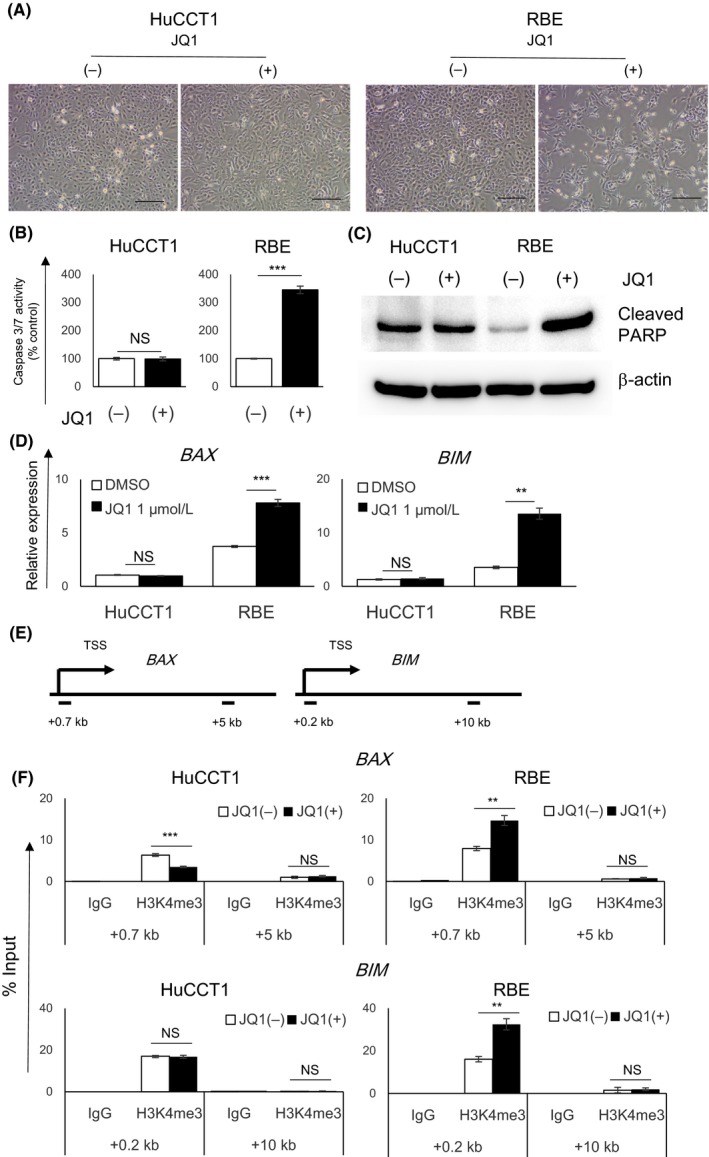
JQ1 induced apoptosis in RBE cells, but not in HuCCT1 cells. A, Representative images of HuCCT1 and RBE cells treated with DMSO or 1 μmol/L JQ1 for 48 h. Scale bar, 250 μm. B, Caspase 3/7 activity of HuCCT1 and RBE cells treated with JQ1 (1 μmol/L) for 48 h relative to DMSO‐treated control. Data are presented as mean ± SEM (n = 4, ***P < 0.001; NS, not significant, Student's t test). C, Cleavage of PARP was assessed by western blotting. D, Gene expression of BAX or BIM was determined by qRT‐PCR. Data are presented as the mean ± SEM (n = 4, **P < 0.01, ***P < 0.001, NS, not significant, Student's t test). E,F, Level of H3K4me3 at the promotor region of BAX or BIM gene was analyzed by ChIP analysis in HuCCT1 and RBE cells treated with DMSO or JQ1 (1 μmol/L) for 36 h. Transcriptional start site (TSS) and amplicons (0.7 and 5 kb downstream regions of TSS in BAX gene, and 0.2 and 10 kb downstream regions in BIM gene) are shown in a diagram (E) and data are presented by qPCR (F), relative to the input DNA
3.4. MYC gene is not a main target of JQ1 in RBE cells
The antiproliferative effects of JQ1 often depend on the suppression of MYC oncogene in various tumors.26, 27 As the downregulation of MYC expression by JQ1 treatment was more evident in HuCCT1 cells than in RBE cells (Figure 4A), it was unlikely that the antigrowth effect of JQ1 in RBE cells was attributed to MYC downregulation. To further investigate the possibility that the downregulation of MYC was involved in the mechanism of the antiproliferative effects of JQ1, MYC was stably knocked down in RBE cells (Figure S1A,B). Suppression of MYC inhibited cell proliferation in RBE cells (Figure 4B). MYC knockdown also activated caspase‐3/7; however, the effect was not as great as that of JQ1 treatment and upregulation of BAX or BIM was not seen (Figures 3B and 4C,D). These findings indicated that the knockdown of MYC did not fully recapitulate the effects of JQ1 treatment, emphasizing the notion that MYC suppression was not a main mechanism of the antigrowth effect of JQ1 in RBE cells.
Figure 4.
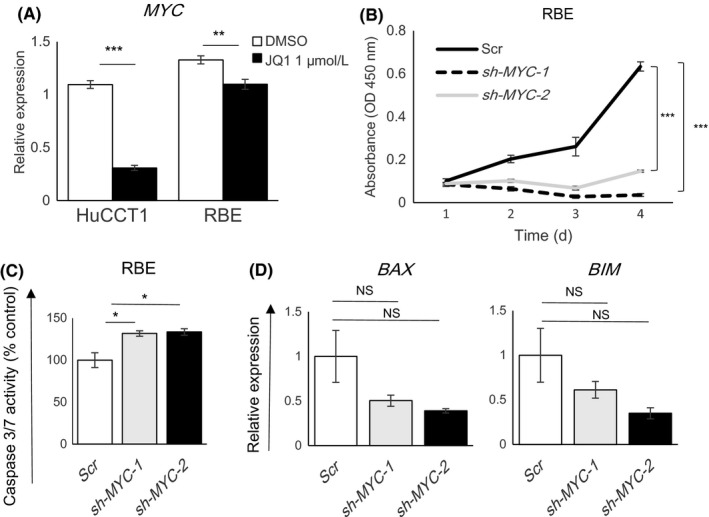
Suppression of the MYC gene did not fully recapitulate the effects of JQ1 in RBE cells. A, Gene expression levels of MYC in HuCCT1 and RBE cells were determined by qRT‐PCR after treatment for 24 h with DMSO or JQ1 (1 μmol/L). Data are presented as mean ± SEM (n = 4, **P < 0.01, ***P < 0.001, Student's t test). B, Proliferation of RBE cells was assessed after stable knockdown of MYC. Scr is the scrambled control shRNA. sh‐MYC‐1 and sh‐MYC‐2 are two different MYC‐knockdown shRNAs. Cell proliferation was measured by CCK‐8 assay over 4 days. Data are presented as the mean ± SEM (n = 4, ***P < 0.001, Student's t‐test). C, Caspase 3/7 activity of RBE cells after MYC knockdown relative to the scramble control. Data are presented as mean ± SEM (n = 4, *P < 0.05, Student's t test). D, Gene expression of BAX or BIM after MYC knockdown in RBE cells was determined by qRT‐PCR. Data are presented as mean ± SEM (n = 3, NS, not significant, Student's t test)
3.5. IDH1 mutation enhances JQ1 sensitivity in ICC cells
As previously reported,23 RBE cells, but not HuCCT1 cells, harbor an IDH1 mutation (Figure S2). To examine the possibility that IDH1 mutation affects cellular sensitivity to JQ1, we first treated RBE cells with AGI‐5198, a specific inhibitor of the IDH1 R132H mutant.32 AGI‐5198 itself did not affect the growth of RBE cells, even at a high dose (20 μmol/L; Figure 5A). Cotreatment of AGI‐5198 with 1 μmol/L JQ1 slightly reversed the suppressive effects of JQ1 on RBE cell viability in a dose‐dependent method (Figure 5A). In addition, 20 μmol/L AGI‐5198 inhibited the activation of caspase‐3/7 after JQ1 treatment in RBE cells (Figure 5B). These findings suggested a possibility that the IDH1 mutation was involved in the mechanism of JQ1‐induced apoptosis in RBE cells. Upregulation of BAX or BIM expression was not affected by the treatment of AGI‐5198 (Figure S3).
Figure 5.
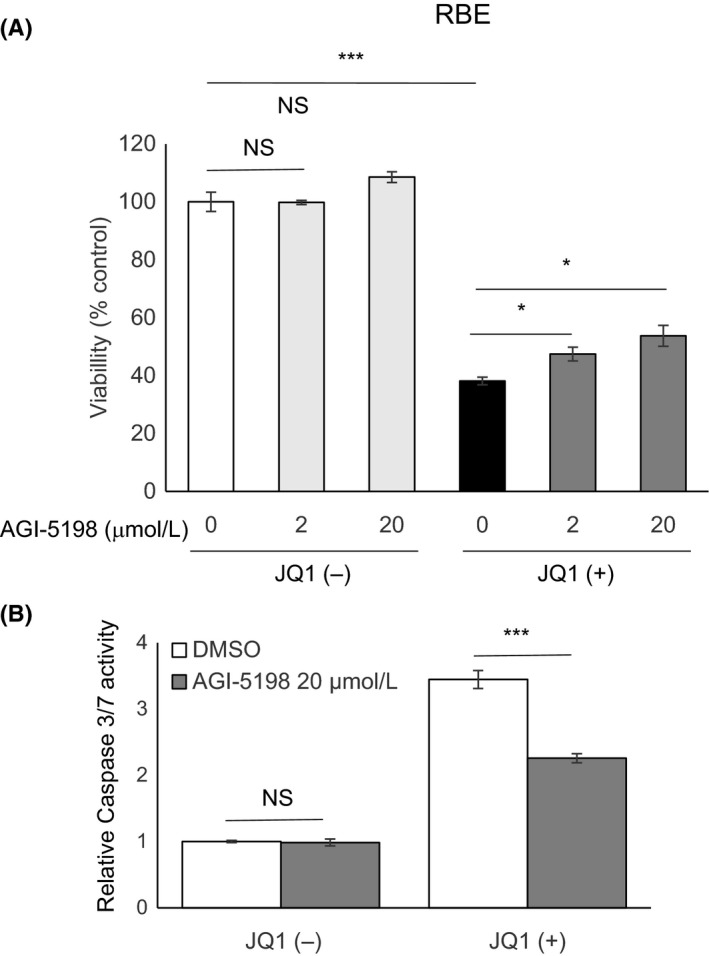
Blockade of mutant isocitrate dehydrogenase 1 (IDH1) attenuated JQ1‐induced apoptosis in RBE cells. A, Viabilities of RBE cells after treatment for 48 h with the indicated doses of AGI‐5198 in combination with DMSO or JQ1 (1 μmol/L). Viability of each group was assessed relative to the DMSO‐treated control by using CCK‐8 assay. B, Effect of AGI‐5198 on caspase 3/7 activity in RBE cells. Cells were treated with vehicle or AGI‐5198 (20 μmol/L) in combination with DMSO or JQ1 (1 μmol/L) for 48 h. Data are presented as mean ± SEM (n = 4, *P < 0.05, ***P < 0.001, NS, not significant, Student's t test)
To confirm whether IDH1 mutation directly enhances JQ1 sensitivity in ICC cells, we established HuCCT1 cells stably expressing wild‐type IDH1 or mutant IDH1 R132S, respectively (Figure 6A). Evidently, the forced expression of mutant IDH1 sensitized HuCCT1 cells to JQ1, compared to that of wild‐type IDH1 (Figure 6B). Mutant IDH1 activated caspase‐3/7 after JQ1 treatment in HuCCT1 cells, but wild‐type IDH1 did not (Figure 6C). These data indicated that IDH1 mutation has the potential to sensitize ICC cells to JQ1. Finally, to further validate whether mutant IDH1‐dependent enhancement of JQ1 sensitivity is a common phenomenon regardless of cancer cell type, we analyzed the sensitivity of JQ1 in glioblastoma cells. We used U‐87MG glioblastoma cells harboring wild‐type IDH1 and IDH1 mutant‐U‐87 isogeneic cells where mutant IDH1 R132H was knocked‐in by CRISPR/Cas9 systems (Figure S4A). Interestingly, the sensitivity was comparable between those isogenic glioblastoma cell lines (Figure S4B). These results indicate that the enhancement of JQ1 sensitivity by mutant IDH1 is not always applicable to other cancer cells, but might be specific for ICC cells.
Figure 6.
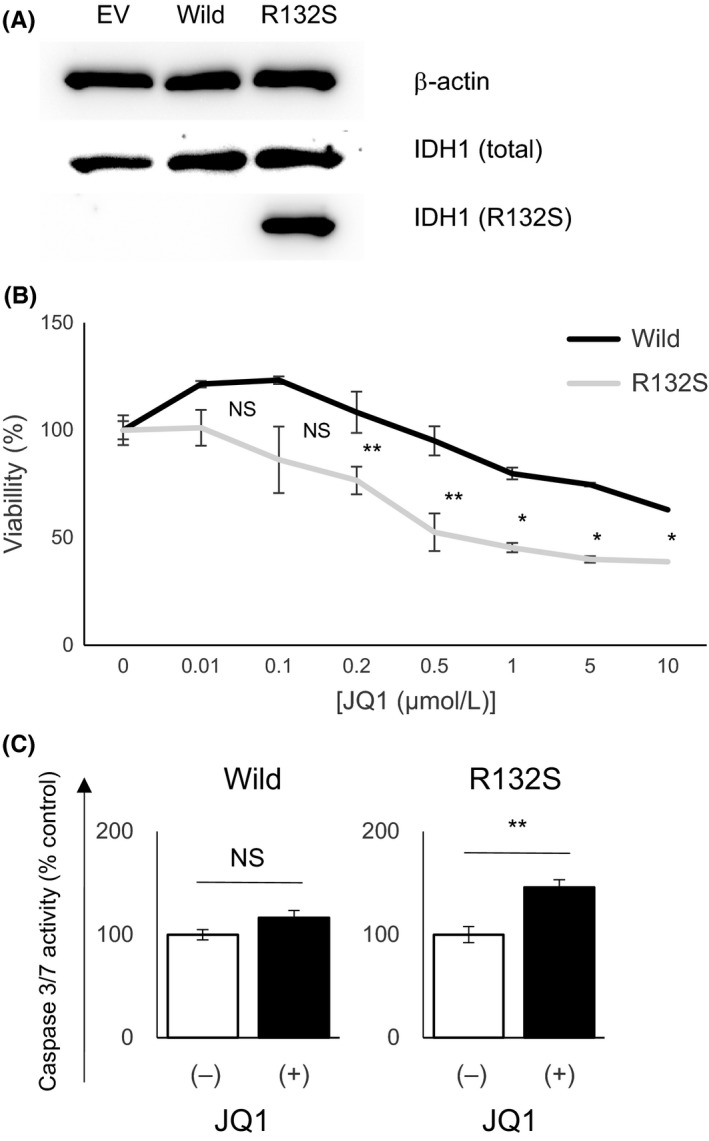
Forced expression of mutant isocitrate dehydrogenase 1 (IDH1) enhanced the sensitivity of HuCCT1 cells to JQ1. A, Protein expression levels of total IDH1 and mutant IDH1 R132S were assessed by western blotting in HuCCT1 cells stably transfected with empty vector (EV), wild‐type IDH1 (Wild) and mutant IDH1 (R132S). B, Dose‐response curves show the effect of JQ1 on the growth of HuCCT1 cells stably transfected with wild‐type IDH1 (Wild) or mutant IDH1 (R132S). Cells were treated with JQ1 at the indicated concentrations for 72 h, and viability was assessed by using CCK‐8 assay. C, Caspase‐3/7 activity of HuCCT1 cells stably transfected with wild‐type IDH1 (Wild) or mutant IDH1 (R132S) were assessed after treatment with DMSO or JQ1 (1 μmol/L) for 48 h. DMSO control = 1. Data are presented as mean ± SEM (n = 4, *P < 0.05, **P < 0.01, NS, not significant, Student's t test)
4. DISCUSSION
In the present study, we showed the possibility that JQ1 exerts a growth inhibitory effect on human ICC cells with an IDH1 mutation. In BTC, standard chemotherapy using a combination of gemcitabine and cisplatin, has only limited therapeutic efficacy.33 Recently, some specific therapies targeting newly identified molecular aberrations, such as fibroblast growth factor receptor 2 (FGFR2) gene fusion, have been proposed in ICC.34, 35, 36 Based on preclinical studies showing that BTC harboring FGFR2 gene fusions are sensitive to FGFR inhibition,37 several small molecule kinase inhibitors of FGFR have proceeded to clinical trials.38, 39 Given that molecular targeting therapies rely on the targeted molecular status on which cancer cells depend, it is reasonable to stratify cancer cells based on their genomic profiles. In the present study, we propose that the IDH1 mutation is a factor for treatment stratification of ICC. There are other reports that mutant IDH increases the dependency of specific molecules, including BCL‐2, NAMPT, and SRC.23, 40, 41 Mutant IDH2 increased the susceptibility of leukemia cells to BET protein inhibition.42 AGI‐6780, a selective mutant IDH2 inhibitor, showed significant efficacy in IDH2‐mutant leukemia cells through the induction of differentiation.43 AGI‐5198 inhibited the mutant IDH1‐driven gliomagenesis from immortalized human astrocytes, but showed no effects on the growth of transformed cells.44 Likewise, in this study, AGI‐5198 itself did not affect the viability of IDH1‐mutant ICC cells (Figure 5A). AGI‐5198 may be insufficient to inhibit the function of R132S mutant IDH1 whereas that was confirmed in R132H mutant IDH1.32, 45 Thus, the development of more potent, and pan‐IDH1 mutant inhibitors are expected.
In the present study, sensitivity to JQ1 was determined by apoptosis and occurred in a MYC‐independent way. Recent studies have also shown that BET inhibitors induce apoptosis in cancer cells independently of MYC.46, 47, 48, 49 BET inhibition upregulates gene expression of the pro‐apoptotic protein BIM and activates the apoptotic pathway in several malignancies.50, 51 These findings were consistent with our data that JQ1 upregulated the expression of BIM and BAX in RBE cells through enrichment of the transcriptionally active histone mark H3K4me3 at the promoter region of the genes (Figure 3D‐F).
More than 40% of BTC, especially ICC, have genetic abnormalities of at least one chromatin remodeling gene.9 Therefore, epigenetic targeting drugs may be useful in the therapeutic treatment of ICC. Small molecular inhibitors of epigenetic enzymes, including histone deacetylase (HDAC) and DNA methyltransferase (DNMT), have already been approved by the FDA.52 In addition, inhibitors of chromatin readers, such as BET proteins, have recently been developed and are now in preclinical and clinical trials. The present study has elucidated the novel therapeutic potential of a BET inhibitor in ICC with IDH1 mutation.
DISCLOSURE
Authors declare no conflicts of interest for this article.
Supporting information
ACKNOWLEDGMENTS
We thank Sayaka Ito for providing assistance with cell culture and all lab members for their helpful comments. This work was supported by JSPS KAKENHI (15K09043, 16K09391).
Fujiwara H, Tateishi K, Kato H, et al. Isocitrate dehydrogenase 1 mutation sensitizes intrahepatic cholangiocarcinoma to the BET inhibitor JQ1. Cancer Sci. 2018;109:3602–3610. 10.1111/cas.13784
REFERENCES
- 1. Nakamura H, Arai Y, Totoki Y, et al. Genomic spectra of biliary tract cancer. Nat Genet. 2015;47:1003‐1010. [DOI] [PubMed] [Google Scholar]
- 2. Razumilava N, Gores GJ. Cholangiocarcinoma. Lancet 2014;383(9935):2168‐2179. [DOI] [PMC free article] [PubMed] [Google Scholar]
- 3. Tyson GL, El‐Serag HB. Risk factors for cholangiocarcinoma. Hepatology. 2011;54(1):173‐184. [DOI] [PMC free article] [PubMed] [Google Scholar]
- 4. Rizvi S, Gores GJ. Pathogenesis, diagnosis, and management of cholangiocarcinoma. Gastroenterology. 2013;145(6):1215‐1229. [DOI] [PMC free article] [PubMed] [Google Scholar]
- 5. Misra S, Chaturvedi A, Misra NC, Sharma ID. Carcinoma of the gallbladder. Lancet Oncol. 2003;4(3):167‐176. [DOI] [PubMed] [Google Scholar]
- 6. Rizvi S, Gores GJ. Emerging molecular therapeutic targets for cholangiocarcinoma. J Hepatol. 2017;67(3):632‐644. [DOI] [PMC free article] [PubMed] [Google Scholar]
- 7. Ong CK, Subimerb C, Pairojkul C, et al. Exome sequencing of liver fluke‐associated cholangiocarcinoma. Nat Genet. 2012;44(6):690‐693. [DOI] [PubMed] [Google Scholar]
- 8. Chan‐on W, Nairismagi M‐L, Ong CK, et al. Exome sequencing identifies distinct mutational patterns in liver fluke‐related and non‐infection‐related bile duct cancers. Nat Genet. 2013;45(12):1474‐1478. [DOI] [PubMed] [Google Scholar]
- 9. Jiao Y, Pawlik TM, Anders RA, et al. Exome sequencing identifies frequent inactivating mutations in BAP1, ARID1A and PBRM1 in intrahepatic cholangiocarcinomas. Nat Genet. 2013;45(12):1470‐1473. [DOI] [PMC free article] [PubMed] [Google Scholar]
- 10. Mohri D, Ijichi H, Miyabayashi K, et al. A potent therapeutics for gallbladder cancer by combinatorial inhibition of the MAPK and mTOR signaling networks. J Gastroenterol. 2016;51(7):711‐721. [DOI] [PubMed] [Google Scholar]
- 11. Cairns RA, Mak TW. Oncogenic isocitrate dehydrogenase mutations: mechanisms, models, and clinical opportunities. Cancer Discov. 2013;3(7):730‐741. [DOI] [PubMed] [Google Scholar]
- 12. Dang L, White DW, Gross S, et al. Cancer‐associated IDH1 mutations produce 2‐hydroxyglutarate. Nature. 2009;462(7274):739‐744. [DOI] [PMC free article] [PubMed] [Google Scholar]
- 13. Chowdhury R, Yeoh KK, Tian YM, et al. The oncometabolite 2‐hydroxyglutarate inhibits histone lysine demethylases. EMBO Rep. 2011;12(5):463‐469. [DOI] [PMC free article] [PubMed] [Google Scholar]
- 14. Xu W, Yang H, Liu Y, et al. Oncometabolite 2‐hydroxyglutarate is a competitive inhibitor of α‐ketoglutarate‐dependent dioxygenases. Cancer Cell. 2011;19(1):17‐30. [DOI] [PMC free article] [PubMed] [Google Scholar]
- 15. Lu C, Ward PS, Kapoor GS, et al. IDH mutation impairs histone demethylation and results in a block to cell differentiation. Nature. 2012;483(7390):474‐478. [DOI] [PMC free article] [PubMed] [Google Scholar]
- 16. Sasaki M, Knobbe CB, Munger JC, et al. IDH1(R132H) mutation increases murine haematopoietic progenitors and alters epigenetics. Nature. 2012;488(7413):656‐659. [DOI] [PMC free article] [PubMed] [Google Scholar]
- 17. Saha SK, Parachoniak CA, Ghanta KS, et al. Mutant IDH inhibits HNF‐4[agr] to block hepatocyte differentiation and promote biliary cancer. Nature. 2014;513:110‐114. [DOI] [PMC free article] [PubMed] [Google Scholar]
- 18. Ogawara Y, Katsumoto T, Aikawa Y, et al. IDH2 and NPM1 mutations cooperate to activate Hoxa9/Meis1 and hypoxia pathways in acute myeloid leukemia. Can Res. 2015;75(10):2005‐2016. [DOI] [PubMed] [Google Scholar]
- 19. Yan H, Parsons DW, Jin G, et al. IDH1 and IDH2 mutations in gliomas. N Engl J Med. 2009;360(8):765‐773. [DOI] [PMC free article] [PubMed] [Google Scholar]
- 20. Mardis ER, Ding L, Dooling DJ, et al. Recurring mutations found by sequencing an acute myeloid leukemia genome. N Engl J Med. 2009;361(11):1058‐1066. [DOI] [PMC free article] [PubMed] [Google Scholar]
- 21. Pansuriya TC, van Eijk R, d'Adamo P, et al. Somatic mosaic IDH1 and IDH2 mutations are associated with enchondroma and spindle cell hemangioma in Ollier disease and Maffucci syndrome. Nat Genet. 2011;43(12):1256‐1261. [DOI] [PMC free article] [PubMed] [Google Scholar]
- 22. Fujimoto A, Furuta M, Shiraishi Y, et al. Whole‐genome mutational landscape of liver cancers displaying biliary phenotype reveals hepatitis impact and molecular diversity. Nat Commun. 2015;6:6120. [DOI] [PubMed] [Google Scholar]
- 23. Saha SK, Gordan JD, Kleinstiver BP, et al. Isocitrate dehydrogenase mutations confer dasatinib hypersensitivity and src dependence in intrahepatic cholangiocarcinoma. Cancer Discov. 2016;6(7):727‐739. [DOI] [PMC free article] [PubMed] [Google Scholar]
- 24. Zeng L, Zhou MM. Bromodomain: an acetyl‐lysine binding domain. FEBS Lett. 2002;513(1):124‐128. [DOI] [PubMed] [Google Scholar]
- 25. Filippakopoulos P, Qi J, Picaud S, et al. Selective inhibition of BET bromodomains. Nature. 2010;468(7327):1067‐1073. [DOI] [PMC free article] [PubMed] [Google Scholar]
- 26. Delmore JE, Issa GC, Lemieux ME, et al. BET bromodomain inhibition as a therapeutic strategy to target c‐Myc. Cell. 2011;146(6):904‐917. [DOI] [PMC free article] [PubMed] [Google Scholar]
- 27. Mertz JA, Conery AR, Bryant BM, et al. Targeting MYC dependence in cancer by inhibiting BET bromodomains. Proc Natl Acad Sci USA. 2011;108(40):16669‐16674. [DOI] [PMC free article] [PubMed] [Google Scholar]
- 28. Dong X, Hu X, Chen J, Hu D, Chen LF. BRD4 regulates cellular senescence in gastric cancer cells via E2F/miR‐106b/p21 axis. Cell Death Dis. 2018;9(2):203. [DOI] [PMC free article] [PubMed] [Google Scholar]
- 29. Yamamoto K, Tateishi K, Kudo Y, et al. Stromal remodeling by the BET bromodomain inhibitor JQ1 suppresses the progression of human pancreatic cancer. Oncotarget. 2016;7(38):61469‐61484. [DOI] [PMC free article] [PubMed] [Google Scholar]
- 30. Garcia PL, Miller AL, Gamblin TL, et al. JQ1 induces DNA damage and apoptosis, and inhibits tumor growth in a patient‐derived xenograft model of cholangiocarcinoma. Mol Cancer Ther. 2018;17(1):107‐118. [DOI] [PMC free article] [PubMed] [Google Scholar]
- 31. Yamamoto S, Tateishi K, Kudo Y, et al. Histone demethylase KDM4C regulates sphere formation by mediating the cross talk between Wnt and Notch pathways in colonic cancer cells. Carcinogenesis. 2013;34(10):2380‐2388. [DOI] [PubMed] [Google Scholar]
- 32. Rohle D, Popovici‐Muller J, Palaskas N, et al. An inhibitor of mutant IDH1 delays growth and promotes differentiation of glioma cells. Science. 2013;340(6132):626‐630. [DOI] [PMC free article] [PubMed] [Google Scholar]
- 33. Valle J, Wasan H, Palmer DH, et al. Cisplatin plus gemcitabine versus gemcitabine for biliary tract cancer. New Engl J Med. 2010;362(14):1273‐1281. [DOI] [PubMed] [Google Scholar]
- 34. Wu YM, Su F, Kalyana‐Sundaram S, et al. Identification of targetable FGFR gene fusions in diverse cancers. Cancer Discov. 2013;3(6):636‐647. [DOI] [PMC free article] [PubMed] [Google Scholar]
- 35. Arai Y, Totoki Y, Hosoda F, et al. Fibroblast growth factor receptor 2 tyrosine kinase fusions define a unique molecular subtype of cholangiocarcinoma. Hepatology. 2014;59(4):1427‐1434. [DOI] [PubMed] [Google Scholar]
- 36. Sia D, Losic B, Moeini A, et al. Massive parallel sequencing uncovers actionable FGFR2‐PPHLN1 fusion and ARAF mutations in intrahepatic cholangiocarcinoma. Nat Commun. 2015;6:6087. [DOI] [PubMed] [Google Scholar]
- 37. Rizvi S, Yamada D, Hirsova P, et al. A hippo and fibroblast growth factor receptor autocrine pathway in cholangiocarcinoma. J Biol Chem. 2016;291(15):8031‐8047. [DOI] [PMC free article] [PubMed] [Google Scholar]
- 38. Javle M, Lowery M, Shroff RT, et al. Phase II study of BGJ398 in patients with FGFR‐altered advanced cholangiocarcinoma. J Clin Oncol. 2018;36(3):276‐282. [DOI] [PMC free article] [PubMed] [Google Scholar]
- 39. Tabernero J, Bahleda R, Dienstmann R, et al. Phase I dose‐escalation study of JNJ‐42756493, an oral pan‐fibroblast growth factor receptor inhibitor, in patients with advanced solid tumors. J Clin Oncol. 2015;33(30):3401‐3408. [DOI] [PubMed] [Google Scholar]
- 40. Chan SM, Thomas D, Corces‐Zimmerman MR, et al. Isocitrate dehydrogenase 1 and 2 mutations induce BCL‐2 dependence in acute myeloid leukemia. Nat Med. 2015;21(2):178‐184. [DOI] [PMC free article] [PubMed] [Google Scholar]
- 41. Tateishi K, Wakimoto H, Iafrate AJ, et al. Extreme vulnerability of IDH1 mutant cancers to NAD+ depletion. Cancer Cell. 2015;28(6):773‐784. [DOI] [PMC free article] [PubMed] [Google Scholar]
- 42. Chen C, Liu Y, Lu C, et al. Cancer‐associated IDH2 mutants drive an acute myeloid leukemia that is susceptible to Brd4 inhibition. Genes Dev. 2013;27(18):1974‐1985. [DOI] [PMC free article] [PubMed] [Google Scholar]
- 43. Wang F, Travins J, DeLaBarre B, et al. Targeted inhibition of mutant IDH2 in leukemia cells induces cellular differentiation. Science. 2013;340(6132):622‐626. [DOI] [PubMed] [Google Scholar]
- 44. Johannessen TA, Mukherjee J, Viswanath P, et al. Rapid conversion of mutant IDH1 from driver to passenger in a model of human gliomagenesis. Mol Cancer Res. 2016;14(10):976‐983. [DOI] [PMC free article] [PubMed] [Google Scholar]
- 45. Li L, Paz AC, Wilky BA, et al. Treatment with a small molecule mutant idh1 inhibitor suppresses tumorigenic activity and decreases production of the oncometabolite 2‐hydroxyglutarate in human chondrosarcoma cells. PLoS ONE. 2015;10(9):e0133813. [DOI] [PMC free article] [PubMed] [Google Scholar]
- 46. Baker EK, Taylor S, Gupte A, et al. BET inhibitors induce apoptosis through a MYC independent mechanism and synergise with CDK inhibitors to kill osteosarcoma cells. Sci Rep. 2015;5:10120. [DOI] [PMC free article] [PubMed] [Google Scholar]
- 47. Hogg SJ, Newbold A, Vervoort SJ, et al. BET inhibition induces apoptosis in aggressive B‐cell lymphoma via epigenetic regulation of BCL‐2 family members. Mol Cancer Ther. 2016;15(9):2030‐2041. [DOI] [PubMed] [Google Scholar]
- 48. Ambrosini G, Sawle AD, Musi E, Schwartz GK. BRD4‐targeted therapy induces Myc‐independent cytotoxicity in Gnaq/11‐mutant uveal melanoma cells. Oncotarget. 2015;6(32):33397‐33409. [DOI] [PMC free article] [PubMed] [Google Scholar]
- 49. Yao W, Yue P, Khuri FR, Sun SY. The BET bromodomain inhibitor, JQ1, facilitates c‐FLIP degradation and enhances TRAIL‐induced apoptosis independent of BRD4 and c‐Myc inhibition. Oncotarget. 2015;6(33):34669‐34679. [DOI] [PMC free article] [PubMed] [Google Scholar]
- 50. Patel AJ, Liao CP, Chen Z, Liu C, Wang Y, Le LQ. BET bromodomain inhibition triggers apoptosis of NF1‐associated malignant peripheral nerve sheath tumors through Bim induction. Cell Rep. 2014;6(1):81‐92. [DOI] [PMC free article] [PubMed] [Google Scholar]
- 51. Gallagher SJ, Mijatov B, Gunatilake D, et al. The epigenetic regulator I‐BET151 induces BIM‐dependent apoptosis and cell cycle arrest of human melanoma cells. J Invest Dermatol. 2014;134(11):2795‐2805. [DOI] [PubMed] [Google Scholar]
- 52. Dawson Mark A, Kouzarides T. Cancer epigenetics: from mechanism to therapy. Cell. 2012;150(1):12‐27. [DOI] [PubMed] [Google Scholar]
Associated Data
This section collects any data citations, data availability statements, or supplementary materials included in this article.
Supplementary Materials


