Abstract
Androgen receptor (AR), an androgen‐activated transcription factor, belongs to the nuclear receptor superfamily. AR plays an important role in the development and progression of prostate cancer (PCa). However, the role of AR in PCa metastasis is not fully understood. To investigate the role of AR in PCa metastasis, we examined AR expression level in primary and metastatic PCa by analyzing gene array data of 378 primary prostate tumors and 120 metastatic prostate tumors from Oncomine, as well as carrying out immunohistochemical (IHC) staining of 56 prostate cancer samples. Expression of mRNA and protein of AR as well as its target gene prostate‐specific antigen (PSA) was much higher in metastatic prostate tumors than in primary prostate tumors. Knockdown of AR with siRNA or treating with anti‐androgen Casodex reduced migration and invasion ability of C4‐2B PCa cells. Knockdown of AR increased protein expression of E‐cadherin and AR coregulator KAT5 but reduced expression of epithelial‐mesenchymal transition (EMT) marker proteins Slug, Snail, MMP‐2, vimentin, and β‐catenin. Knockdown of KAT5 increased migration of C4‐2B cells, whereas overexpression of KAT5 suppressed cell migration. KAT5 knockdown rescues the suppressive effect of AR knockdown on migration of C4‐2B cells. Gene expression level of AR and KAT5 showed a negative correlation. PCa patients with higher AR expression or lower KAT5 expression correlated with shorter recurrence‐free survival. Our study suggested that elevation of AR expression and AR signaling in prostate tumors promotes PCa metastasis by induction of EMT and reduction of KAT5.
Keywords: androgen receptor, epithelial‐mesenchymal transition, KAT5, metastasis, prostate cancer
1. INTRODUCTION
Androgen receptor (AR), an androgen‐activated transcription factor, belongs to the nuclear receptor superfamily. Testosterone is the main circulating androgen in the human body, whereas dihydrotestosterone (DHT) is a more potent androgen that has a five‐fold higher affinity for AR compared to testosterone.1, 2, 3 When testosterone enters prostate cells, 90% is converted to DHT by the enzyme 5α‐reductase.3 Binding of androgen to AR induces dissociation of AR from heat‐shock proteins (HSP) and stimulates AR phosphorylation.4 AR dimerizes, translocates into the nucleus, and binds to androgen‐response elements (ARE) in the promoter regions of target genes.4 Co‐activators and co‐repressors bind the AR complex, facilitating or preventing the transcription of AR target genes. These proteins regulate AR for the activation or repression of target genes which regulate the growth, survival, and the production of prostate‐specific antigen (PSA) in prostate cells.5, 6
Androgen receptor plays essential roles in the development and progression of prostate cancer (PCa).4, 7 In PCa cells, AR modulates the expression of proteins regulating cell cycle, survival, and growth.8, 9, 10 Increase in AR mRNA and protein are observed in hormone‐refractory prostate tumors compared to the primary prostate tumors.11, 12, 13, 14, 15, 16, 17, 18, 19 Amplification of the AR locus was reported in nearly one‐third of patients developing castration‐resistant prostate cancer (CRPC).13, 16, 20, 21, 22 Increase of AR mRNA was the only change consistently associated with the development of the castration‐resistant phenotype.23 However, the role of AR in PCa metastasis is not fully understood. We therefore investigated the expression profile of AR in different PCa progression stages, as well as the mechanisms of how AR affects PCa metastasis.
2. MATERIALS AND METHODS
2.1. Patients and specimens
A series of 56 patients with prostate cancer having transurethral resection of the prostate (TURP) at Taichung Veterans General Hospital, Taichung, Taiwan, were enrolled (January 1999 to December 2001). Further examination of biopsy specimens or resected tissue confirmed the diagnosis of prostate cancer. Paraffin‐embedded tissues were composed of cancerous parts and surrounding noncancerous prostate tissue. These patients were followed for an average of 44.0 ± 19.6 months. Thirty patients (53.6%) were confirmed to have metastases 6 to 66 months after the diagnosis of the primary prostate cancer. Pathological and clinical features of these patients were analyzed, and the TNM system was used for evaluation of primary tumor, regional lymph nodes, distant metastasis, histological grade (Gleason score), and overall staging. Among the patients, at the time of TURP, 11 received no treatment, four received radiotherapy, one received chemotherapy, one received chemotherapy plus radiotherapy, 19 received hormone therapy, 20 received hormone therapy and orchiectomy (including four patients also having chemotherapy and three patients also having radiotherapy). At the end of the follow up, 17 patients were alive with disease, 23 patients were alive without disease, and 16 patients had died of disease. Prostate tumor samples and serum PSA were collected before the diagnosis and treatments. This study was approved by the Institutional Review Board of Taichung Veterans General Hospital.
2.2. Immunohistochemical analysis
Immunohistochemistry staining was carried out on paraffin‐embedded sections with an automatic immunostaining device and UltraView detection kit (Ventana XT Medical Systems, Tucson, AZ, USA). Antigen retrieval was carried out automatically by the device according to the manufacturer's instruction (BenchMark XT Roche, NJ, USA). Amount of AR protein in tissue sections was analyzed using an AR antibody from Epitomics (Burlingame, CA, USA) (Cat number: 3184‐1, Lot: ER179‐2), 50× dilution. Antigen retrieval reagent: MCC1 at 37°C for 32 minutes. For detection, UltraView Universal DAB Detection Kit from Ventana Medical Systems was used. Prostate cancer tissues with known AR expression level were used as positive or negative control. Intensity of immunostaining was scored semiquantitatively using a Quick score (Q‐score) method based on intensity and heterogeneity. Briefly, the staining intensity was scored as 0 (negative), 1 (weak), 2 (moderate), or 3 (strong). For heterogeneity staining, the proportion of tumor cells stained for AR was scored as 0, 1 (1%‐25%), 2 (26%‐50%), 3 (51%‐75%), or 4 (76%‐100%). The Q‐score of a given tissue sample is the sum of the intensity and heterogeneity scores and ranges from 0 to 7. Those rare cases with <5% weakly stained tissue were considered negative. Scoring of each sample was made independently and blindly by two pathologists (Drs Jan and Wang).
2.3. Oncomine and PubMed Gene Expression Omnibus datasets
Online gene array datasets were downloaded from Oncomine (http://www.oncomine.org/resource/login.html) for AR gene expression analysis. Chandran Prostate dataset includes 10 primary prostate tumors and 21 metastatic prostate carcinomas. Expression of AR gene was detected by CodeLink UniSet Human 20K I Bioarray (reporter: GE58203).24 Grasso Prostate dataset includes 59 primary prostate tumors and 35 metastatic prostate carcinomas. Expression of AR gene was detected by RefSeq Genes (reporter: 23‐066770721).25 Holzbeierlein Prostate dataset includes 36 primary prostate tumors and seven metastatic prostate carcinomas. Expression of AR gene was detected by Human Genome U95A‐Av2 Array (reporter: 1577_at).17 Lapointe Prostate dataset includes 58 primary prostate tumors and seven metastatic prostate carcinomas. Expression of AR gene was detected by self‐constructed prostate cancer tissue microarray comprising an independent set of 225 formalin‐fixed, paraffin‐embedded primary prostate tumor cases collected at Stanford University (reporter: IMAGE:2250839).26 Ramaswamy Prostate dataset27 and dataset228 include 10 primary prostate tumors and three (dataset1) or four (dataset2) metastatic prostate carcinomas. Expression of AR gene was detected by HumanGeneFL Array, Hu35KsubA Array (reporter: M23263_at). Taylor Prostate dataset includes 131 primary prostate tumors and 19 metastatic prostate carcinomas. Expression of AR gene was detected by Affymetrix Human Exon 1.0 ST arrays (reporter: 31).29 Yu Prostate dataset includes 64 primary prostate tumors and 24 metastatic prostate carcinomas. Expression of AR gene was detected by Human Genome U95A‐Av2 Array (reporter: 1577_at).30 Expression of KAT5 gene in normal prostate tissues free of pathological alteration, primary prostate tumors, and metastatic prostate tumors was analyzed using PubMed Gene Expression Omnibus (GEO) profile dataset GDS 2545 (HG‐U95A), reporter: GPL8300, 465_at; gene ID: 10524. There were 18 normal prostate tissues free of pathological alteration, 65 primary prostate tumors, and 25 metastatic prostate tumors.
2.4. SurvExpress Web resource for biomarker comparison
Parameter setting was as follows: Selection for target gene “AR” or “KAT5” in the Genes column, “prostate” in tissue, and Taylor MSKCC Prostate as database for Cox Survival Analysis, “Average: All probes sets/records will be averaged per sample” and “Original (Quantile‐Normalized)” for Option. Then select Censored: Recurrence Months and Maximum risk groups on http://bioinformatica.mty.itesm.mx:8080/Biomatec/SurvivaX.jsp.
2.5. Transwell migration and invasion assay
Migration assays for control, AR siRNA knockdown, or Casodex‐treated (5 μmol/L Casodex treatment for three passages) C4‐2B cells were carried out following the instructions of the Transwell kit purchased from BD Bioscience (Franklin Lakes, NJ, USA) as previously described.31 Cells were seeded at a concentration of 2 × 10⁴ in 500 μL serum‐free RPMI medium into the upper compartment of Transwell. The lower compartment of Transwell was filled with 500 μL RPMI medium containing 10% FBS. After 18 hours incubation, cells that migrated to the lower surface of the filter were fixed with 100% methanol and stained with 1% Giemsa solution. Total migrated cells were counted following standard procedures. Invasion assay of control or AR siRNA knockdown C4‐2B cells was carried out with Growth Factor Reduced BD BioCoat Matrigel invasion chambers according to the manufacturer's instructions (BD Bioscience) as previously described.31 Cells were seeded at a concentration of 2 × 10⁴ in 500 μL serum‐free RPMI medium into the upper compartment of Transwell. The lower compartment of Transwell was filled with 500 μL RPMI medium containing 10% FBS. After 18 hours incubation, cells that migrated to the lower surface of the filter were fixed with 100% methanol and stained with 1% Giemsa solution. Total migrated cells were counted following standard procedures.
2.6. Quantitative real‐time PCR
mRNA level of AR, CDH1, MMP2, SNAI2, SNAI1, and ACTB was analyzed by ABI PRISM 7500 (Applied Biosystems/Life Technologies, Carlsbad, CA, USA). Primers were designed using software on http://frodo.wi.mit.edu/primer3/. Sequences of primers for RT‐qPCR are as follows: AR: AR‐F: ccctttcaagggaggttacac; AR‐R: tgctccggacttgtagagaga. CDH1
CDH1‐F: agaaacaggatggctgaaggt; CDH1‐R: tctccattggatcctcaactg. MMP2: MMP2‐F: cactttcctgggcaacaaata; MMP2‐R: cttgcggtcatcatcgtagtt. SNAI2: SNAI2‐F: acagagcatttgcagacaggt; SNAI2‐R: gttttggagcagtttttgcac. SNAI1: SNAI1‐F: tttaccttccagcagcccta; SNAI1‐R: gacagagtcccagatgagcatt.
ACTB: ACTB‐F: gtaccactggcatcgtgatggact; ACTB‐R: ccgctcattgccaatggtgat. HSP90AA1: HSP90AA1‐F: cagaaattgcccagttgatgt; HSP90AA1‐R: cataccggattttgtccaatg. MDM2: MDM2‐F: catggcaaaacaggacatctt; MDM2‐R: acatactgggcagggcttatt. KAT5: KAT5‐F: atcctccaggcaatgagattt; KAT5‐R: gaaacacttggccaaaagaca. CAV1: CAV1‐F: ccaccttcactgtgacgaaat; CAV1‐R: aggaaagagagaatggcgaag. GSN: GSN‐F: agattggacgttttgtgatcg; GSN‐R: aatcctttccaacccagacaa. The KAT5 mRNA level of human prostate tissue and different stages of prostate cancer was determined on TissueScan Prostate Tissue qPCR Array HPRT101~103 (OriGene Technologies, Rockville, MD, USA) according to the manufacturer's instructions with Maxima SYBR Green/ROX qPCR Master Mix (2×) (Fermentas, Glen Burnie, MA, USA) and analyzed by Applied Biosystems 7500 Real‐Time PCR system (Thermo Scientific, Waltham, MA, USA). The mRNA expression level was normalized to β‐actin.
2.7. Western blotting analysis
Cells were lysed in SDS lysis buffer (240 mmol/L Tris‐acetate, 1% SDS, 1% glycerol, 5 mmol/L EDTA pH 8.0) with DTT, protease inhibitors, and a cocktail of phosphatase inhibitors. Anti‐rabbit and anti‐mouse IgG secondary antibodies were from Invitrogen (Carlsbad, CA, USA) and LI‐COR BioSciences (Lincoln, NE, USA). Antibodies detecting AR, Snail, MMP‐2, and vimentin were purchased from Abcam (Abcam, Cambridge, UK). The antibody detecting E‐cadherin was purchased from BD BioSciences (BD BioSciences, San Jose, CA, USA). The antibodies detecting Slug and β‐catenin were purchased from Cell Signaling Technology (Cell Signaling Technology, Danvers, MA, USA). Antibody detecting KAT5 (Tip60) was from Abnova (Taipei, Taiwan) and GeneTex (Irvine, CA, USA). Antibody detecting CAV1 was from Millipore (Burlington, MA, USA). The antibody detecting β‐actin was purchased from Novus (Novus, Littleton, CO, USA).
2.8. Fractionation of cytoplasmic and nuclear proteins
Subcellular fractionation of cellular proteins was done with two steps of differential extraction. Cytoplasmic protein samples were extracted by a using low percentage of NP‐40 lysis buffer (50 mmol/L Tris‐HCl, pH 7.5, 5 mmol/L MgCl2 and 0.4% NP‐40) with 1× proteinase and phosphatase inhibitors cocktail at 4°C. Cytoplasmic lysate and intact cell nuclei were separated at 4°C and centrifuged at 3500 g for 5 minutes. Clear suspensions were transferred to new 1.5 mL tubes and pellets were washed once with 0.1% NP‐40 buffer. Finally, the nuclear part of protein samples was extracted by using Buffer C (20 mmol/L HEPES, pH 7.9, 1.5 mmol/L MgCl2, 420 mmol/L NaCl, 0.2 mmol/L EDTA, 50% glycerol and 0.5 mmol/L DTT) with 1× proteinase and phosphatase inhibitors cocktail at 4°C. Nuclear protein samples were collected at 4°C and centrifuged at 17 700 g for 30 minutes.
2.9. KAT5 plasmid overexpression
Cells were seeded at 3 × 10⁵ cells in 6‐well plates cultured with RPMI containing 10% FBS and rested for 18‐24 hours. After plating overnight, C4‐2B cells were transfected with KAT5 (Myc‐DDK‐tagged, RC215979; Origene) and control vector (pCMV6‐Entry) individually. PolyJet (SignaGen Laboratories, Rockville, MD, USA) was used for in vitro DNA transfection.
2.10. KAT5 siRNA knockdown
Cells were seeded at 2 × 10⁵ cells in 6‐well plates cultured with RPMI containing 10% FBS and rested for 18‐24 hours. After plating overnight, C4‐2B cells were knocked down by KAT5 siRNA (ON‐TARGETplus KAT5 siRNA L‐006301; Dharmacon, Lafayette, CO, USA) and negative control siRNA (ON‐TARGETplus Non‐targeting pool) individually. Lipofectamine RNAiMAX (Invitrogen) was used for siRNA knockdown. Opti‐MEM (31985; ThermoFisher Scientific, Waltham, MA, USA) was used for diluting RNAi duplexes and Lipofectamine.
2.11. Data analysis
Data are presented as the mean ± SD of at least three experiments or are representative of experiments repeated at least three times. Student's t test (two‐tailed, unpaired) was used to evaluate the statistical significance of results from proliferation assay experiments.
3. RESULTS
3.1. Expression of mRNA and protein of AR was much higher in metastatic prostate tumors than in primary prostate tumors
To determine the role of AR in PCa metastasis, we examined the relative expression levels of AR mRNA in primary and metastatic prostate tumors using Oncomine datasets. We analyzed eight different Oncomine datasets, including Chandran PCa dataset (Figure 1A), Grasso PCa dataset (Figure 1B), Holzbeierlein PCa dataset (Figure 1C), Lapointe PCa dataset (Figure 1D), Ramaswamy PCa dataset (Figure 1E), Ramaswamy PCa dataset 2 (Figure 1F), Taylor PCa dataset (Figure 1G), and Yu PCa dataset (Figure 1H). Among the 378 primary prostate tumor tissues and 120 metastatic PCa tissues being analyzed, AR mRNA expression level was higher in metastatic prostate tumors in all eight datasets as compared to primary prostate tumors. To determine whether AR protein level shows the same trend of increase in metastatic prostate tumors, we compared the AR protein expression level in 56 PCa samples from 56 different PCa patients before treatment using immunohistochemical (IHC) staining. The 56 PCa samples included 10 stage I, 14 stage II, two stage III, and 30 stage IV tumors (Figure 2A). Among these PCa samples, 37 had paired nearby non‐malignant prostate epithelial tissues. Among these 56 PCa samples, there were 15 Gleason score <7 prostate tumors, 18 Gleason score 7 prostate tumors, and 23 Gleason score >7 prostate tumors (Figure 2B). Our analysis indicated that prostate tumors with higher staging or higher Gleason scores before treatment expressed higher AR protein expression (Figure 2A,B) and higher pre‐diagnostic serum PSA level (Figure 2C,D). A set of representative images indicated that AR protein level in non‐malignant prostate tissues adjacent to prostate tumors was slightly higher in stages II, III, and IV (Figure 3A) as compared to stage I. However, AR protein level in prostate tumors increased dramatically in higher stages, especially in stage IV prostate tumor (Figure 3B).
Figure 1.
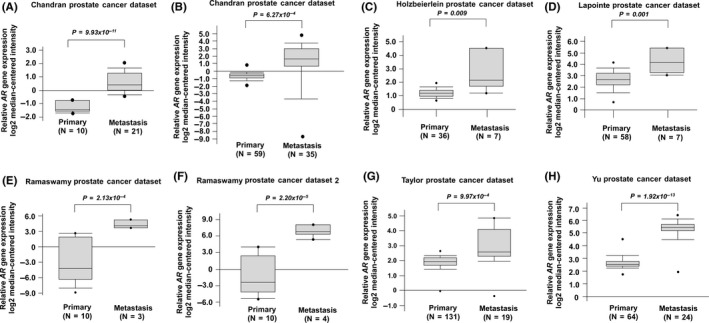
Expression levels of androgen receptor (AR) mRNA in primary vs metastatic prostate cancer tissues. AR gene expression in A, Chandran Prostate dataset, B, Grasso Prostate dataset, C, Holzbeierlein Prostate dataset, D, Lapointe Prostate dataset, E, Ramaswamy Prostate dataset, F, Ramaswamy Prostate dataset 2, G, Taylor Prostate dataset and H, Yu Prostate dataset was analyzed from Oncomine
Figure 2.
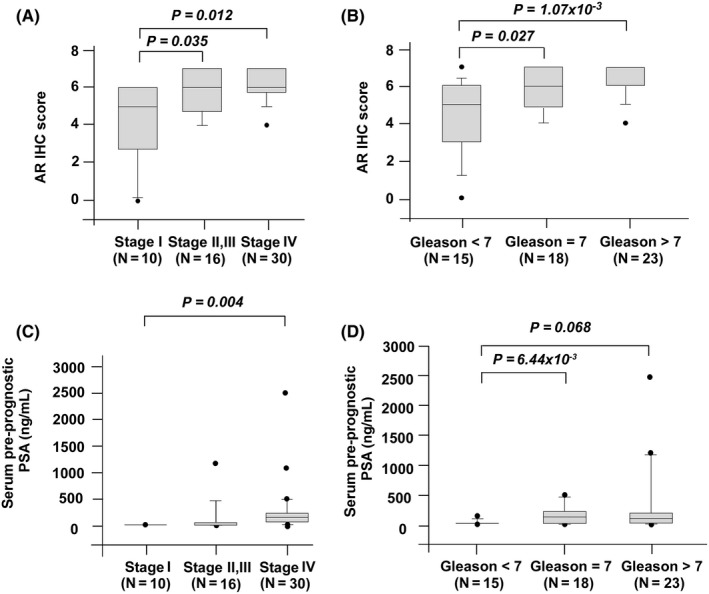
Androgen receptor (AR) protein expression in prostate cancer tissues vs surrounding normal prostate tissues. Protein expression of AR was assayed by immunohistochemical (IHC) staining in prostate cancer tissues (before treatments) at different stages (stage I, N = 10; stage II, N = 14; stage III, N = 2, stage IV, N = 30) (A) or different Gleason score (Gleason score <7, N = 15; Gleason score = 7, N = 18; Gleason score >7, N = 23) (B). Pre‐diagnostic serum prostate‐specific antigen (PSA) levels of patients at their first visit to the urology department in Taichung Veterans General Hospital were recorded and analyzed according to different stages (C) or different Gleason score (D), respectively
Figure 3.
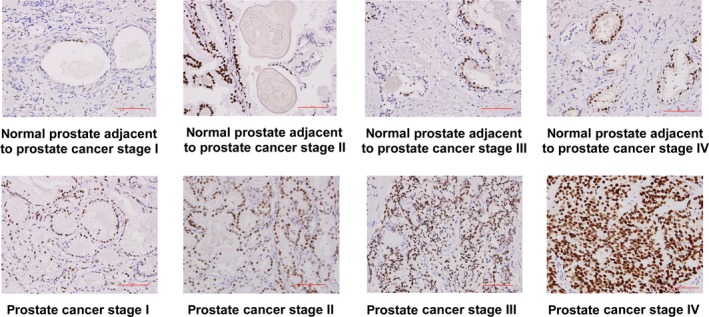
Androgen receptor (AR) protein expression level in paired prostate cancer (PCa) tissues and surrounding normal prostate tissues. Levels of AR protein in paired samples of PCa tissues before treatment (N = 10 for stage I, N = 12 for stage II and III, and N = 15 for stage IV) and nearby non‐malignant prostate tissues were determined by immunohistochemical (IHC) staining. Original magnification of IHC staining is 200×. Red scale bar in the figure represents 50 μm
3.2. Knockdown of AR reduced migration and invasion ability of PCa cells
To determine whether elevation of AR contributes to migration and invasion of PCa cells, we used siRNA to knock down AR in C4‐2B PCa cells. Compared to control C4‐2B cells, knockdown AR with siRNA suppressed migration and invasion ability of C4‐2B cells (Figure 4A‐C). In contrast, overexpression of AR in PC‐3 cells in the presence of androgen promoted the migration and invasion of PC‐3 cells (data not shown). Blocking AR signaling in C4‐2B cells with Casodex reduced migration of C4‐2B cells (Figure 4D).
Figure 4.
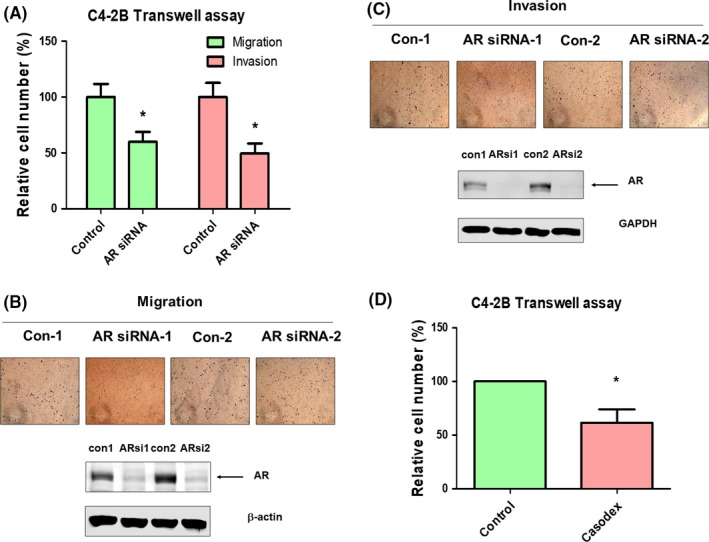
Knockdown of androgen receptor (AR) or blocking AR signaling reduces migration and invasion of C4‐2B cells. A, Knockdown of AR with siRNA reduced migration and invasion of C4‐2B cells as determined by Transwell assay. Images of Transwell migration assay and Transwell invasion assay as well as western blotting confirming the knockdown of AR are shown in (B) and (C), respectively. D, Treating C4‐2B cells with 5 μmol/L Casodex (bicalutamide) reduced cell migration as determined by Transwell assay. Asterisk represents statistical significance P < 0.05 between the two groups being compared
3.3. Knockdown of AR affected EMT marker proteins in PCa cells
We next examined whether alteration of AR expression level affected cancer metastasis‐related signaling proteins. Knockdown of AR with siRNA significantly increased gene expression (Figure 5A) and protein level (Figure 5B) of E‐cadherin, as well as reduced protein expression of Slug, Snail, MMP‐2, β‐catenin, and vimentin (Figure 5B).
Figure 5.
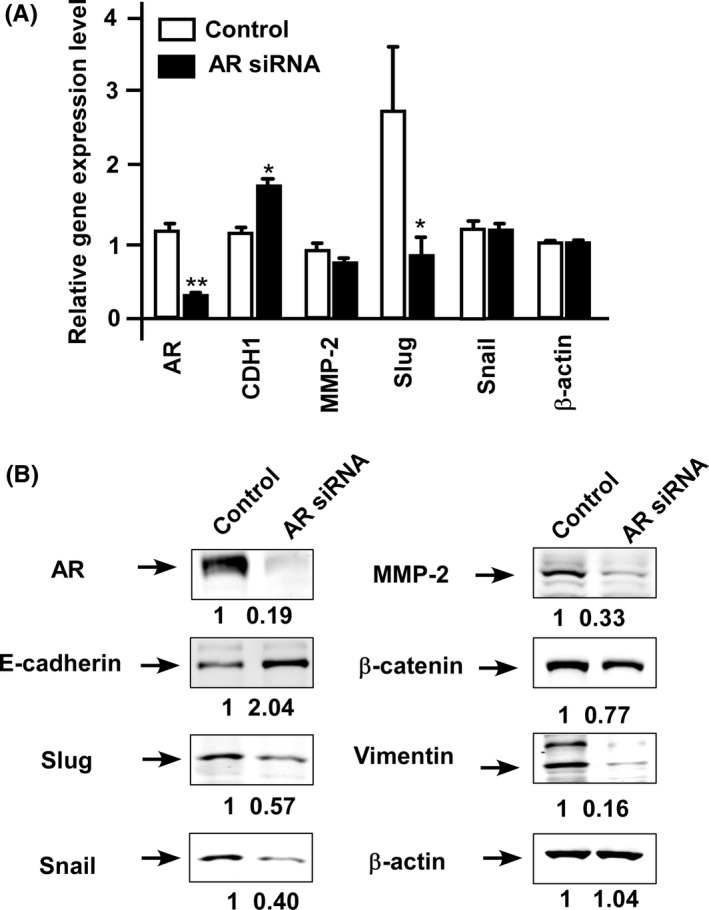
Knockdown of androgen receptor (AR) affects proteins regulating migration and invasion. A, Gene expression level of AR, CDH1 (E‐cadherin), MMP‐2, Slug, and SNAIL was determined in control C4‐2B cells (□) and C4‐2B with AR siRNA knockdown (■) using qRT‐PCR. Asterisks * and ** represent statistically significant difference P < 0.05 and P < 0.001, respectively, between the two groups being compared. B, Protein expression level of AR, E‐cadherin, Slug, Snail, MMP‐2, β‐catenin, and vimentin proteins was determined by western blotting in control C4‐2B cells and C4‐2B cells with siRNA knockdown of AR. β‐Actin protein was used as loading control
3.4. Knockdown of AR affected expression of AR coregulators
As several AR coregulators are also involved in regulation of PCa progression of cancer metastasis, we examined whether alteration of AR expression level affected expression level of AR coregulators. Knockdown of AR in C4‐2B cells increased gene expression level of CREBBP, NCOA3, NCOR1, NCOR2, SMARCA4, SP1, BRCA1, NR0B2, KAT5, NCOA4, CAV1, and GSN whereas it decreased gene expression level of HSP90AA1, BAG1, and RACK1 (Figure 6A). As KAT5 and CAV1 have previously been reported to be involved in the regulation of PCa metastasis,32,33 we compared the abundance of these proteins in control and AR knockdown C4‐2B cells. Knockdown of AR decreased protein level of CAV1 (Figure S1) but increased abundance of KAT5 protein (Figure 6B). As the change of KAT5, but not CAV1, showed a similar pattern for mRNA and protein in AR knockdown C4‐2B cells as compared to control C4‐2B cells, we determined whether alteration of KAT5 protein abundance can actually affect the migration of C4‐2B cells. Indeed, knockdown of KAT5 increased the migration of C4‐2B cells, whereas overexpression of KAT5 suppressed migration of C4‐2B cells (Figure 6C). Consistent with the observation that knockdown of AR increased protein expression of KAT5, knockdown of KAT5 rescued the suppressive effect of AR knockdown on migration of C4‐2B cells (Figure 6D). However, overexpression of KAT5 inhibited C4‐2B migration along with AR knockdown (Figure 6D). We noticed that knockdown of AR elevated the protein expression of KAT5; therefore, KAT5 siRNA can only slightly decrease KAT5 protein level in C4‐2B cells with AR siRNA knockdown (Figure 6D).
Figure 6.
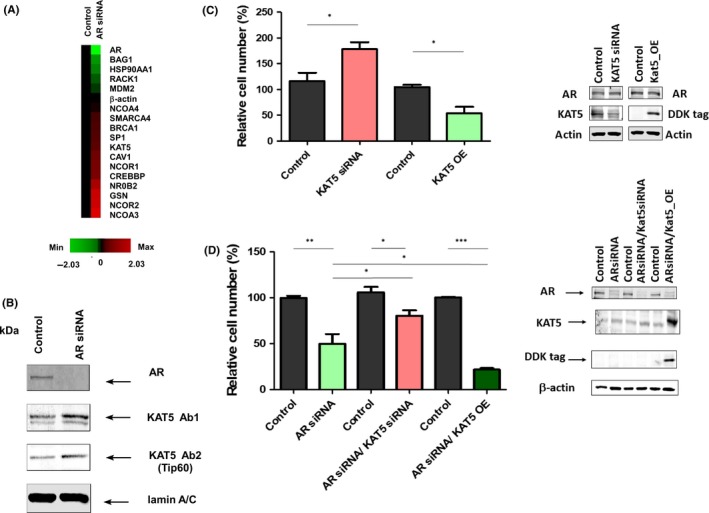
Knockdown of androgen receptor (AR) decreases expression of AR coregulators KAT5 and downregulation of KAT5 promotes migration of prostate cancer cells. A, Gene expression of AR coregulators CREBBP, HSP90AA1, MDM2, NCOA3, NCOR1, NCOR2, SMARCA4, SP1, BRCA1, NR0B2, BAG1, KAT5, NCOA4, CAV1, GSN, and RACK1 in control and AR siRNA knockdown C4‐2B cells was determined by qRT‐PCR. Red and green color indicates increase and decrease of gene expression in AR siRNA knockdown C4‐2B cells as compared to control cells. B, Protein expression of KAT5 in nuclear extract of cell lysates in control and AR siRNA knockdown C4‐2B cells as determined by western blotting. Lamin A/C is used as loading control. C, Effect of siRNA knockdown of KAT5 or overexpression of KAT5 on migration of C4‐2B cells as compared to control cells. D, Effect of knockdown or overexpression of KAT5 on migration of C4‐2B cells with AR siRNA knockdown was determined by Transwell assay. Asterisks *, ** represent statistically significant difference P < 0.05, P < 0.01, respectively, between the two groups being compared
3.5. Prostate cancer patients with higher AR expression or lower KAT5 expression correlated with shorter recurrence‐free survival
As knockdown of KAT5 promoted C4‐2B migration, we examined whether KAT5 expression level was lower in metastatic prostate tumors. Gene level of KAT5 was lower in metastatic prostate tumors as compared to normal prostate tissues or primary prostate tumors (Figure 7A). Prostate tumors with low Gleason score (<7) expressed a higher level of KAT5 gene as compared to tumors with Gleason score equal to or greater than 7 (Figure 7B). Analysis of Oncomine gene array data in Chandran PCa dataset (Figure 8A) and Grasso PCa dataset (Figure 8B) indicated that KAT5 gene showed a negative correlation with the AR gene in PCa patients. We therefore predicted that PCa patients with higher AR or lower KAT5 expression level will have a worse prognosis. Analysis of online PCa survival database from SurvExpress for 140 PCa cases from Taylor MSKCC PCa dataset29 showed that PCa patients with higher AR expression (N = 17) correlated with a worse relapse‐free rate as compared to PCa patients with lower AR expression level (N = 123) (P = 0.0032) (Figure 8C). PCa patients with lower KAT5 expression (N = 14) correlated with a worse relapse‐free rate as compared to PCa patients with higher KAT5 expression level (N = 126) (P = 0.0127) (Figure 8D). To determine whether AR or KAT5 is an independent prognostic or predictive factor for survival, we carried out univariant analysis on the correlation between AR level, KAT5 level, Gleason score, age, pathological stage and relapse‐free time using Taylor MSKCC prostate dataset.29 We discovered that pathological staging and Gleason score are very good prognostic markers for patients’ relapse‐free time with very low P values (Figure S2). AR mRNA level, but not KAT5 gene level, is an effective prognostic marker for relapse‐free time, although not as good as pathological staging or Gleason score.
Figure 7.
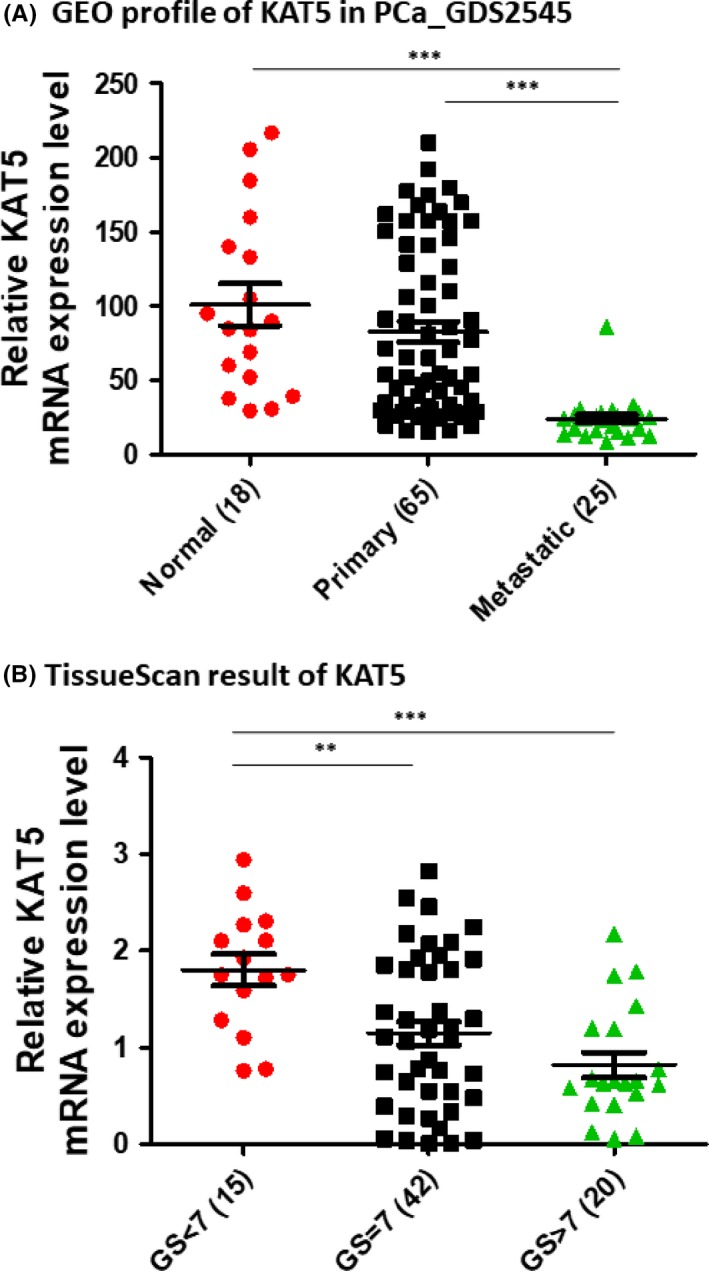
Expression of KAT5 is lower in metastatic prostate cancer. (A) Expression of KAT5 gene in normal prostate tissues free of pathological alteration, primary prostate tumors, and metastatic prostate tumors was analyzed using PubMed Gene Expression Omnibus (GEO) profile dataset GDS 2545 (HG‐U95A). B, Expression of KAT5 mRNA gene in prostate tumors of different Gleason score was determined on TissueScan Prostate Tissue qPCR Array. Asterisks **, *** represent statistically significant difference P < 0.01, P < 0.001, respectively, between the two groups being compared
Figure 8.
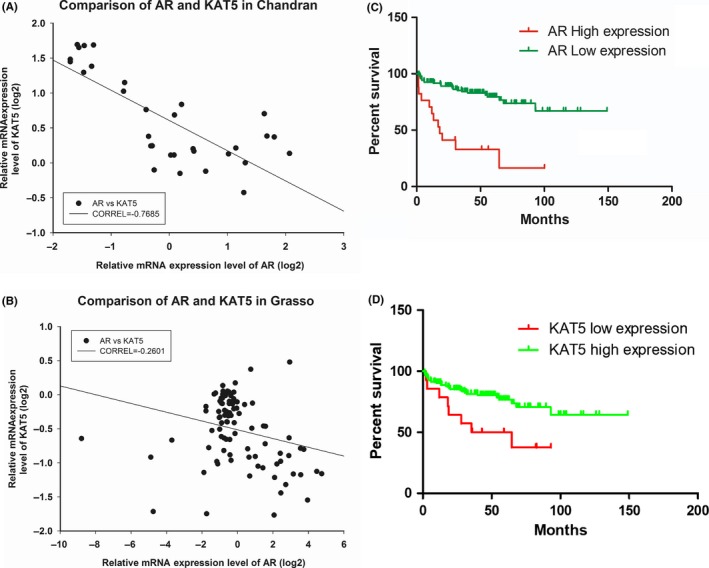
Gene expression level of androgen receptor (AR) and KAT5 shows negative correlation and correlates with prostate cancer (PCa) patient survival. Correlation between gene expression of KAT5 and AR was determined using Oncomine gene array result from Chandran PCa dataset (A) and Grasso PCa dataset (B). Correlation between AR (C) or KAT5 (D) and PCa survival was analyzed using Taylor MSKCC Prostate database on SurvExpress Website
4. DISCUSSION
Our study indicated that both mRNA and protein level of AR increase during PCa progression. AR mRNA (Figure 1) and protein (Figures 2‐3) levels are both higher in metastatic PCa as compared to primary PCa. These observations suggested that elevation of AR may promote PCa metastasis. Serum PSA level is higher in metastatic PCa as compared to primary PC (Figure 2), implying that AR in metastatic PCa are functional. These results confirmed the oncogenic role of AR in PCa metastasis.
Knockdown of AR with siRNA (Figure 4A‐C) or blocking AR signaling with anti‐androgen Casodex (Figure 4D) significantly reduced migration and invasion of C4‐2B cells. Overexpression of AR in PC‐3 increased migration and invasion of C4‐2B cells (data not shown). These results confirmed that elevation of AR in prostate tumors promotes cancer metastasis. Analysis of protein expression showed that AR promotes PCa metastasis by induction of EMT regulatory proteins Slug, Snail, MMP‐2, β‐catenin, and vimentin and the decrease of E‐cadherin (Figure 5).
Epithelial‐mesenchymal transition plays an essential role in the regulation of metastasis and disease progression of cancer.34 During EMT there is a series alteration of protein expression, including upregulation of N‐cadherin, vimentin, Snail, Slug, Twist, MMP‐2, MMP‐3, and MMP‐9 proteins as well as downregulation of E‐cadherin, cytokeratin, and occluding proteins. Additionally, the activity of integrin‐linked kinase (ILK), glycogen synthase kinase 3 beta (GSK‐3β), and Rho as well as nuclear accumulation of β‐catenin, Smad‐2/3, nuclear factor kappa B, Snail, Slug, and Twist proteins also increased.35 Our results implied that elevation of AR expression and AR signaling in prostate tumors promotes PCa metastasis through induction of EMT.
We observed that knockdown of AR with siRNA in C4‐2B cells increased both gene and protein expression levels of KAT5 (Figure 6A,B). Knockdown of KAT5 increased the migration of C4‐2B cells, whereas overexpression of KAT5 suppressed cell migration (Figure 6C). Knockdown of KAT5 rescued the suppressive effect of AR knockdown on migration of C4‐2B cells, whereas overexpression of KAT5 inhibited C4‐2B migration along with AR knockdown (Figure 6D). These observations suggested that elevation of AR promotes PCa cell migration, at least partially, by reducing KAT5 expression level. KAT5, also known as Tip60, is a protein belonging to the MYST family of histone acetyl transferases (HAT). KAT5, an AR coregulator, directly acetylates AR and promotes AR transcription.36 Elevation of nuclear accumulation of KAT5 was observed in castration‐resistant prostate cancer (CRPC).37 Additionally, androgen withdrawal promotes upregulation of KAT5 as well as nuclear accumulation in LNCaP cells. In contrast, androgen exposure resulted in a decrease and cytoplasmic localization of KAT5 expression.37 KAT5 promotes prostate cancer cell proliferation by translocation of androgen receptor into the nucleus.38 KAT5‐specific inhibitor NU9056 is able to effectively suppress proliferation of prostate cancer cells.39 These studies indicate that elevation of KAT5 plays an essential role during the development of castration‐resistant prostate cancer (CRPC). However, analysis of clinical samples from 36 PCa patients before receiving treatment showed an inverse correlation between metastasis and KAT5 expression.37 This is consistent with our observation. KAT5 and RVB1 bind to the promoter of KAI1, a cancer metastasis suppressor, and act as co‐activators for KAI1 through the acetylation of histones.40 In non‐metastatic prostate cancer cells, the expression level of KAT5 is high. KAT5 (Tip60) is recruited to the promoter region of metastasis suppressor KAI1, along with Pontin and p50. As a result, transcription of the KAI1 gene is turned on. However, in metastatic prostate cancer cells, the expression level of β‐catenin increases and KAT5 expression level decreases. β‐Catenin and Reptin replace KAT5 and Pontin for the binding of the KAI1 promoter, therefore turning off the transcription of KAI1 and thus promoting metastasis of prostate cancer cells.32 This finding explains why KAT5 expression level is inversely correlated with the metastasis of prostate cancer, and is consistent with our finding in this study. Our observation suggested that AR negatively correlates with KAT5; therefore, elevation of AR decreases KAT5 level, resulting in the decrease of KAI1 activity and thus the increase of PCa metastasis. Consistent with this hypothesis, higher AR expression level (Figure 8C) and lower KAT5 expression level (Figure 8D) correlate with worse relapse‐free rate in PCa patients.
In conclusion, the present study suggested that elevation of AR expression and AR signaling in prostate tumors promotes PCa metastasis by induction of EMT and reduction of KAT5.
CONFLICTS OF INTEREST
Authors declare no conflicts of interest for this article.
Supporting information
ACKNOWLEDGMENTS
This study was supported by CS‐106‐PP‐03, CA‐106‐SP‐01, and CS‐106‐SP‐05 and MOST 107‐2314‐B‐400‐002, MOST 106‐2314‐B‐400‐006, MOST 105‐2628‐B‐400‐005‐MY3, MOST 105‐2923‐B‐400‐001‐MY3, MOST 105‐2633‐B‐400‐001 for CPC in Taiwan. CYL is supported by MOST 106‐2811‐B‐400‐017 and MOST 107‐2811‐B‐400‐525. We thank the useful suggestions of Dr Hsing‐Jien Kung, Dr Jun‐Yang Liou, the Editor and the reviewers.
Lin C‐Y, Jan Y‐J, Kuo L‐K, et al. Elevation of androgen receptor promotes prostate cancer metastasis by induction of epithelial‐mesenchymal transition and reduction of KAT5. Cancer Sci. 2018;109:3564–3574. 10.1111/cas.13776
Lin, Jan and Kuo contributed equally to this work.
REFERENCES
- 1. Anderson KM, Liao S. Selective retention of dihydrotestosterone by prostatic nuclei. Nature. 1968;219:277‐279. [DOI] [PubMed] [Google Scholar]
- 2. Kokontis JM, Liao S. Molecular action of androgen in the normal and neoplastic prostate. Vitam Horm. 1999;55:219‐307. [DOI] [PubMed] [Google Scholar]
- 3. Liang T, Liao S. Inhibition of steroid 5 alpha‐reductase by specific aliphatic unsaturated fatty acids. Biochem J. 1992;285(Pt 2):557‐562. [DOI] [PMC free article] [PubMed] [Google Scholar]
- 4. Feldman BJ, Feldman D. The development of androgen‐independent prostate cancer. Nat Rev Cancer. 2001;1:34‐45. [DOI] [PubMed] [Google Scholar]
- 5. Chuu CP, Hiipakka RA, Fukuchi J, Kokontis JM, Liao S. Androgen causes growth suppression and reversion of androgen‐independent prostate cancer xenografts to an androgen‐stimulated phenotype in athymic mice. Cancer Res. 2005;65:2082‐2084. [DOI] [PubMed] [Google Scholar]
- 6. Zegarra‐Moro OL, Schmidt LJ, Huang H, Tindall DJ. Disruption of androgen receptor function inhibits proliferation of androgen‐refractory prostate cancer cells. Cancer Res. 2002;62:1008‐1013. [PubMed] [Google Scholar]
- 7. Ricke EA, Williams K, Lee YF, et al. Androgen hormone action in prostatic carcinogenesis: stromal androgen receptors mediate prostate cancer progression, malignant transformation and metastasis. Carcinogenesis. 2012;33:1391‐1398. [DOI] [PMC free article] [PubMed] [Google Scholar]
- 8. Wang Q, Li W, Liu XS, et al. A hierarchical network of transcription factors governs androgen receptor‐dependent prostate cancer growth. Mol Cell. 2007;27:380‐392. [DOI] [PMC free article] [PubMed] [Google Scholar]
- 9. Xu Y, Chen SY, Ross KN, Balk SP. Androgens induce prostate cancer cell proliferation through mammalian target of rapamycin activation and post‐transcriptional increases in cyclin D proteins. Can Res. 2006;66:7783‐7792. [DOI] [PubMed] [Google Scholar]
- 10. Wang Q, Li W, Zhang Y, et al. Androgen receptor regulates a distinct transcription program in androgen‐independent prostate cancer. Cell. 2009;138:245‐256. [DOI] [PMC free article] [PubMed] [Google Scholar]
- 11. van der Kwast TH, Schalken J, Ruizeveld de Winter JA, et al. Androgen receptors in endocrine‐therapy‐resistant human prostate cancer. Int J Cancer. 1991;48:189‐193. [DOI] [PubMed] [Google Scholar]
- 12. Ruizeveld de Winter JA, Janssen PJ, Sleddens HM, et al. Androgen receptor status in localized and locally progressive hormone refractory human prostate cancer. Am J Pathol. 1994;144:735‐746. [PMC free article] [PubMed] [Google Scholar]
- 13. Visakorpi T, Hyytinen E, Koivisto P, et al. In vivo amplification of the androgen receptor gene and progression of human prostate cancer. Nat Genet. 1995;9:401‐406. [DOI] [PubMed] [Google Scholar]
- 14. Bubendorf L, Kononen J, Koivisto P, et al. Survey of gene amplifications during prostate cancer progression by high‐throughput fluorescence in situ hybridization on tissue microarrays. Cancer Res. 1999;59:803‐806. [PubMed] [Google Scholar]
- 15. Linja MJ, Savinainen KJ, Saramaki OR, Tammela TL, Vessella RL, Visakorpi T. Amplification and overexpression of androgen receptor gene in hormone‐refractory prostate cancer. Cancer Res. 2001;61:3550‐3555. [PubMed] [Google Scholar]
- 16. Ford OH 3rd, Gregory CW, Kim D, Smitherman AB, Mohler JL. Androgen receptor gene amplification and protein expression in recurrent prostate cancer. J Urol. 2003;170:1817‐1821. [DOI] [PubMed] [Google Scholar]
- 17. Holzbeierlein J, Lal P, LaTulippe E, et al. Gene expression analysis of human prostate carcinoma during hormonal therapy identifies androgen‐responsive genes and mechanisms of therapy resistance. Am J Pathol. 2004;164:217‐227. [DOI] [PMC free article] [PubMed] [Google Scholar]
- 18. Mohler JL, Gregory CW, Ford OH 3rd, et al. The androgen axis in recurrent prostate cancer. Clin Cancer Res. 2004;10:440‐448. [DOI] [PubMed] [Google Scholar]
- 19. Stanbrough M, Bubley GJ, Ross K, et al. Increased expression of genes converting adrenal androgens to testosterone in androgen‐independent prostate cancer. Cancer Res. 2006;66:2815‐2825. [DOI] [PubMed] [Google Scholar]
- 20. Koivisto P, Kononen J, Palmberg C, et al. Androgen receptor gene amplification: a possible molecular mechanism for androgen deprivation therapy failure in prostate cancer. Cancer Res. 1997;57:314‐319. [PubMed] [Google Scholar]
- 21. Brown RS, Edwards J, Dogan A, et al. Amplification of the androgen receptor gene in bone metastases from hormone‐refractory prostate cancer. J Pathol. 2002;198:237‐244. [DOI] [PubMed] [Google Scholar]
- 22. Edwards J, Krishna NS, Grigor KM, Bartlett JM. Androgen receptor gene amplification and protein expression in hormone refractory prostate cancer. Br J Cancer. 2003;89:552‐556. [DOI] [PMC free article] [PubMed] [Google Scholar]
- 23. Chen CD, Welsbie DS, Tran C, et al. Molecular determinants of resistance to antiandrogen therapy. Nat Med. 2004;10:33‐39. [DOI] [PubMed] [Google Scholar]
- 24. Chandran UR, Ma C, Dhir R, et al. Gene expression profiles of prostate cancer reveal involvement of multiple molecular pathways in the metastatic process. BMC Cancer. 2007;7:64. [DOI] [PMC free article] [PubMed] [Google Scholar]
- 25. Grasso CS, Wu YM, Robinson DR, et al. The mutational landscape of lethal castration‐resistant prostate cancer. Nature. 2012;487:239‐243. [DOI] [PMC free article] [PubMed] [Google Scholar]
- 26. Lapointe J, Li C, Higgins JP, et al. Gene expression profiling identifies clinically relevant subtypes of prostate cancer. Proc Natl Acad Sci USA. 2004;101:811‐816. [DOI] [PMC free article] [PubMed] [Google Scholar]
- 27. Ramaswamy S, Ross KN, Lander ES, Golub TR. A molecular signature of metastasis in primary solid tumors. Nat Genet. 2003;33:49‐54. [DOI] [PubMed] [Google Scholar]
- 28. Ramaswamy S, Tamayo P, Rifkin R, et al. Multiclass cancer diagnosis using tumor gene expression signatures. Proc Natl Acad Sci USA. 2001;98:15149‐15154. [DOI] [PMC free article] [PubMed] [Google Scholar]
- 29. Taylor BS, Schultz N, Hieronymus H, et al. Integrative genomic profiling of human prostate cancer. Cancer Cell. 2010;18:11‐22. [DOI] [PMC free article] [PubMed] [Google Scholar]
- 30. Yu YP, Landsittel D, Jing L, et al. Gene expression alterations in prostate cancer predicting tumor aggression and preceding development of malignancy. J Clin Oncol. 2004;22:2790‐2799. [DOI] [PubMed] [Google Scholar]
- 31. Lin CY, Huo C, Kuo LK, et al. Cholestane‐3beta, 5alpha, 6beta‐triol suppresses proliferation, migration, and invasion of human prostate cancer cells. PLoS ONE. 2013;8:e65734. [DOI] [PMC free article] [PubMed] [Google Scholar]
- 32. Kim JH, Kim B, Cai L, et al. Transcriptional regulation of a metastasis suppressor gene by Tip60 and beta‐catenin complexes. Nature. 2005;434:921‐926. [DOI] [PubMed] [Google Scholar]
- 33. Kowalska K, Nowakowska M, Dominska K, Piastowska‐Ciesielska AW. Coexpression of CAV‐1, AT1‐R and FOXM1 in prostate and breast cancer and normal cell lines and their influence on metastatic properties. Acta Biochim Pol. 2016;63:493‐499. [DOI] [PubMed] [Google Scholar]
- 34. Gravdal K, Halvorsen OJ, Haukaas SA, Akslen LA. A switch from E‐cadherin to N‐cadherin expression indicates epithelial to mesenchymal transition and is of strong and independent importance for the progress of prostate cancer. Clin Cancer Res. 2007;13:7003‐7011. [DOI] [PubMed] [Google Scholar]
- 35. Lee JM, Dedhar S, Kalluri R, Thompson EW. The epithelial‐mesenchymal transition: new insights in signaling, development, and disease. J Cell Biol. 2006;172:973‐981. [DOI] [PMC free article] [PubMed] [Google Scholar]
- 36. Gaughan L, Logan IR, Cook S, Neal DE, Robson CN. Tip60 and histone deacetylase 1 regulate androgen receptor activity through changes to the acetylation status of the receptor. J Biol Chem. 2002;277:25904‐25913. [DOI] [PubMed] [Google Scholar]
- 37. Halkidou K, Gnanapragasam VJ, Mehta PB, et al. Expression of Tip60, an androgen receptor coactivator, and its role in prostate cancer development. Oncogene. 2003;22:2466‐2477. [DOI] [PubMed] [Google Scholar]
- 38. Shiota M, Yokomizo A, Masubuchi D, et al. Tip60 promotes prostate cancer cell proliferation by translocation of androgen receptor into the nucleus. Prostate. 2010;70:540‐554. [DOI] [PubMed] [Google Scholar]
- 39. Coffey K, Blackburn TJ, Cook S, et al. Characterisation of a Tip60 specific inhibitor, NU9056, in prostate cancer. PLoS ONE. 2012;7:e45539. [DOI] [PMC free article] [PubMed] [Google Scholar]
- 40. Baek SH, Ohgi KA, Rose DW, Koo EH, Glass CK, Rosenfeld MG. Exchange of N‐CoR corepressor and Tip60 coactivator complexes links gene expression by NF‐kappaB and beta‐amyloid precursor protein. Cell. 2002;110:55‐67. [DOI] [PubMed] [Google Scholar]
Associated Data
This section collects any data citations, data availability statements, or supplementary materials included in this article.
Supplementary Materials


