

Abstract
Disseminated cancer cells in malignant ascites possess unique properties that differ from primary tumors. However, the biological features of ascites tumor cells (ATC) have not been fully investigated. By analyzing ascites fluid from 65 gastrointestinal cancer patients, the distinguishing characteristics of ATC were identified. High frequency of CD44+ cells was observed in ATC using flow cytometry (n = 48). Multiplex quantitative PCR (n = 15) showed higher gene expression of epithelial‐mesenchymal transition (EMT)‐related genes and transforming growth factor beta (TGF‐beta)‐related genes in ATC than in the primary tissues. Immunohistochemistry (n = 10) showed that ATC also had much higher expression of phosphorylated SMAD2 than that in the corresponding primary tissues. TGF‐beta 1 was detected in all cases of malignant ascites by enzyme‐linked immunoassay (n = 38), suggesting the possible interaction of ATC and the ascites microenvironment. In vitro experiments revealed that these ATC properties were maintained by TGF‐beta 1 in cultured ATC(n = 3). Here, we showed that ATCrevealed high frequencies of CD44 and possessed distinct EMT features from primary tissues that were mainly maintained by TGF‐beta 1 in the ascites.
Keywords: cancer stem cell, CD44, EMT, malignant ascites, transforming growth factor‐beta
1. INTRODUCTION
Cancer remains a serious and often deadly disease, because metastasis leads to multiple organ dysfunction, which is associated with high mortality. During the process of metastasis, cancer cells are transported or disseminated through the circulation, the lymphatic system and body fluids.1 Therefore, disseminated cancer cells in malignant ascites have the potential to become a seed of metastasis, resulting in metastatic colonization in various organs.2
Malignant ascites is the excess accumulation of fluid in the peritoneal cavity, which contains various types of cells, including mesothelial, endothelial, blood and cancer cells.3 In this study, we quantified the frequency of each cellular component in malignant ascites and biologically characterized ascites tumor cells (ATC) and ascites microenvironment cells (AMC) using flow cytometry in 65 patients with malignant ascites.
Because ATC detached from primary tissues are free of intercellular contact and float in ascites fluid in association with AMC, soluble factors such as vascular endothelial growth factor and interleukin 6 in ascites fluid are thought to affect the biology of ATC.4 The specific tumor microenvironment in malignant ascites may determine the ATC features, which lead to their survival, proliferation and metastasis. Epithelial‐mesenchymal transition (EMT) is a complex process through which cells acquire metastatic ability. During the EMT process, cancer cells become invasive and metastatic without intercellular contact by losing the epithelial phenotype and acquiring the mesenchymal phenotype.5 The EMT proceeds by several signaling pathways, such as transforming growth factor beta (TGF‐beta) signaling, and can regulate essential EMT‐inducing transcription factors (EMT‐TF), such as Snail, Twist and zinc finger E‐box binding homeobox (ZEB) families.6 As a result of activation of the EMT‐TF by their upstream TGF‐beta signaling pathway, cancer cells acquire invasive and metastatic ability.
Accumulating evidence suggests that EMT‐TF are closely associated with the generation of cancer stem cells (CSC).7, 8 CSC are generally identified by the expression of cell surface makers, including CD44 in colorectal cancer,9 pancreatic cancer,10 gastric cancer11 and other types of cancer,12 and are responsible for tumor propagation and invasive metastasis. Overexpression of EMT‐TF and external stimulation with TGF‐beta in non‐CSC induced CD44+ CSC‐like cells in in vitro and in vivo experiments.13, 14 In addition, CD44 itself contributes to the metastatic ability, indicated by analysis of overexpression and short hairpin RNA of CD44.15 These reports indicate that high CD44 expression correlates with CSC and the EMT phenotype, which are regulated by the tumor microenvironment through several signaling pathways, including the TGF‐beta signaling pathway.7, 8 However, the relationship between the biological features of ATC and their microenvironment has not been fully investigated in malignant ascites. Here, we report the specific biology of ATC in terms of the EMT and CSC by evaluating the contribution of ascites microenvironment.
2. MATERIALS AND METHODS
2.1. Ethics statement
This observational study was conducted by the Kyushu Medical Oncology Group (KMOG) in collaboration with 5 institutions and was approved by the institutional review board at each institution. All patients diagnosed with malignant ascites of the gastrointestinal cancer were eligible for inclusion. Ascites was collected at the time of paracentesis for palliative reasons. From April 2014 to February 2017, we recruited 65 patients, all of whom provided informed consent. Archival primary tumor tissues of colorectal, gastric and pancreatic cancers were obtained upon resection. All studies were performed in accordance with the Declaration of Helsinki principles and the guidelines of the Research Ethics Committee on Human Experimentation of Kyushu University (#28‐95). The scheme of the study design is shown in Figure S1.
2.2. Preparation of patient material
2.2.1. Ascites
Fresh ascites were centrifuged at 150 g for 5 minutes at room temperature to separate the cells and supernatant. Separated cells were suspended in BD Pharm Lyse Lysing Buffer (BD Biosciences, San Jose, CA, USA) for 5 minutes to lyse red blood cells. The remaining cells were separated by additional centrifugation at 150 g for 5 minutes and the obtained supernatant was preserved at −80°C until subsequent use.
2.3. Primary tissues
Surgical resected tumor specimens were washed twice in PBS, minced with a razor blade, and incubated with type 3 collagenase (Worthington Biochemicals, Lakewood, NJ, USA) and DNAase I (Wako Chemicals) for 60 minutes at 37°C using the gentleMACS Dissociator. After enzymatic digestion, the sample was sequentially filtered through a 100 μmol/L and 40 μm cell strainer (Corning, Corning, NY, USA), and the cells were incubated with BD Pharm Lyse Lysing Buffer (BD Biosciences) for 5 minutes to lyse red blood cells.
2.4. Flow cytometry and cell sorting
Isolated cells were incubated with propidium iodide (BD Biosciences) to exclude non‐viable cells. Appropriate isotype‐matched control monoclonal antibodies were used to determine the level of background staining. Cells were stained with FITC or allophycocyanin (APC)‐conjugated anti‐EpCAM (clone 9C4; BioLegend, San Diego, CA, USA), Brilliant Violet 421‐conjugated anti‐CD44 (clone G44‐26; BD Biosciences), APC or APC‐Cy7‐conjugated CD45 (clone HI30; BioLegend), Brilliant Violet 421‐conjugated anti‐CD3 (clone UCHT1; BioLegend), FITC‐conjugated anti‐CD14 (clone HCD14; BioLegend), Brilliant Violet 510‐conjugated anti‐CD15 (clone W6D3; BD Biosciences), APC‐Cy7‐conjugated anti‐CD19 (clone HIB19; BioLegend), phycoerythrin (PE)‐conjugated anti‐CD56 (clone MY31; BD Biosciences), PE‐Cy7‐conjugated anti‐CD90 (clone 5E10; BD Biosciences) and Alexa Fluor 488‐conjugated anti‐podoplanin (NC‐08; BioLegend). Cells were analyzed and sorted using the BD FACSAria III cell sorter (BD Biosciences). Cells were sorted twice to rule out the possibility of contamination.
2.5. Primary culture of ascites tumor cells
Ascites tumor cells were purified by cell sorting using the cell surface marker EpCAM as previously described. Sorted EpCAM+ cells were resuspended in RPMI‐1640 medium (Wako Chemicals, Richmond, VA, USA) supplemented with 10% FBS (Nichirei, Tokyo, Japan) and 1% penicillin/streptomycin (Life Technologies, Carlsbad, CA, USA), and were incubated at 37°C.
2.6. Enzyme‐linked immunoassay
The amounts of total TGF‐beta 1 in the supernatant of ascites fluid were measured using the LEGEND MAX Total TGF‐beta 1 ELISA Kit according to the manufacturer's instructions (BioLegend).
2.7. Immunohistochemistry
Immunohistochemistry (IHC) was performed on 5‐mm paraffin‐embedded tumor sections using the conventional avidin‐biotin peroxidase method. The following primary antibodies were used: pSMAD2 (clone 138D4; Cell Signaling Technology, Beverly, MA, USA), CD44 (clone G44‐26; BD Biosciences) and ZEB1 (clone 10E4E6; Abcam, Cambridge, MA, USA). Antigen retrieval was performed using citrate buffer. Manual scoring of visual immunohistochemistry staining intensity was defined as: negative (0), weak (1+), moderate (2+) or strong (3+); representative images are shown in Figure S2.
2.8. RNA isolation and quantitative PCR assay
Total RNA was extracted using TRIzol Reagent (Thermo Fisher Scientific, Waltham, MA, USA) in accordance with the manufacturer's instructions, and cDNA synthesis was performed using the reverse transcriptase SuperScript III First‐Strand Synthesis System (Thermo Fisher Scientific). Quantitative PCR (qPCR) was performed using the StepOnePlus Real‐time PCR System. Multiplex qPCR of ATC and primary tissues was performed using the TaqMan PreAmp Master Mix (Applied Biosystems, Foster City, CA, USA), and cDNA samples were subjected to qPCR using the BioMark system (Fluidigm, San Francisco, CA, USA) as previously reported.16 Reactions were run in triplicate in 3 independent experiments. The geometric mean of the housekeeping gene GAPDH was used as the internal control. All reagents and instruments, if not otherwise stated, were from Applied Biosystems.
2.9. Primers and probes
Taqman gene expression assays were purchased from Applied Biosystems. The IDs of the probes were shown as follows: cadherin 1 (CDH1): Hs01023895_m1, EPCAM: Hs00901885_m1, GAPDH: Hs02758991_g1, keratin 20: Hs00300643_m1, SNAI1: Hs00195591_s1, SNAI2: Hs00950344_m1, TWIST1: Hs01675818_s1, TWIST2: Hs02379973_s1, ZEB1: Hs0023783_m1, and ZEB2: 00207691_m1, CDH2: Hs00983056_m1, vimentin: Hs00958116_m1, collagen, type 1, alpha 2 (COL1A2): Hs01028956_m1, COL3A1: Hs00943809_m1, SMAD1: Hs00195432_m1, SMAD2: Hs00998187_m1, SMAD3: Hs00969210_m1, and carcinoembryonic antigen‐related cell adhesion molecule (CEACAM5): Hs00944025_m1.
2.10. Sphere‐forming assay
Cultured ATC were suspended as single cells and inoculated into nitrogen‐supplemented DMEM/F12 medium without serum at a density of 1 × 10⁴ cells/well in ultra‐low attachment 24‐well plates. Aliquots of human recombinant epidermal growth factor (EGF; 10 ng/mL) and basic fibroblast growth factor (bFGF; 10 ng/mL) were added. After culturing for 10‐14 days, colonies containing >10 cells were quantified.
2.11. Statistical analysis
All experiments were performed in triplicate, and data are expressed as the median ± standard deviation unless otherwise indicated. For statistical analysis, Student's t test and one‐way analysis of variance were performed. Statistically significant differences are indicated by asterisks (*P < 0.05; **P < 0.01; ***P < 0.001).
3. RESULTS
3.1. Flow cytometric analysis revealed ascites consisted of ascites tumor cells and ascites microenvironment cells
In malignant ascites, cancer cells float in the ascites fluid, which is composed of several cell types. Fluorescence‐activated cell sorting (FACS)‐based quantification has been used as a tool to reveal the population of cells consisting of malignant ascites.3, 17 We performed FACS analysis of malignant ascites obtained from 65 patients, including 26 gastric cancer patients, 24 colorectal cancer patients, 14 pancreatic cancer patients, and 1 patient with “other” tumor (Table S1). First, we quantified the frequency of ATC (EpCAM+ CD45−), mesothelial cells (EpCAM− CD45− podoplanin+), fibroblasts (EpCAM− CD45− CD90+), and blood cells (CD45+) in the whole cells of the ascites (Figure 1A). While the mean frequency of ATC was 11.3% ± 6.3% (mean ± 95% confidence interval), the cellular components of the malignant ascites were dominated by CD45+ blood cells (85.2% ± 6.3%) (Figure 1B), which comprised the AMC. CD45+ blood cells consisted of macrophages (CD3− CD14+; 26.4% ± 5.5%), neutrophils (CD3− CD14− CD15+; 15.6% ± 6.2%), T cells (CD3+; 43.5% ± 6.0%), B cells (CD3− CD19+; 6.2% ± 1.8%) and natural killer (NK) cells (CD3− CD56+; 8.2% ± 2.3%) (Figure 1A,C). The mesothelial cells (EpCAM− CD45− podoplanin+; 1.4% ± 0.9%, n = 10) and fibroblasts (EpCAM− CD45− CD90+; 0.36% ± 0.22%) were minor populations in our analysis (Figure 1B). These features of the cellular component of ascites fluid suggested that the ATC were surrounded by the vast majority of AMC in the malignant ascites.
Figure 1.
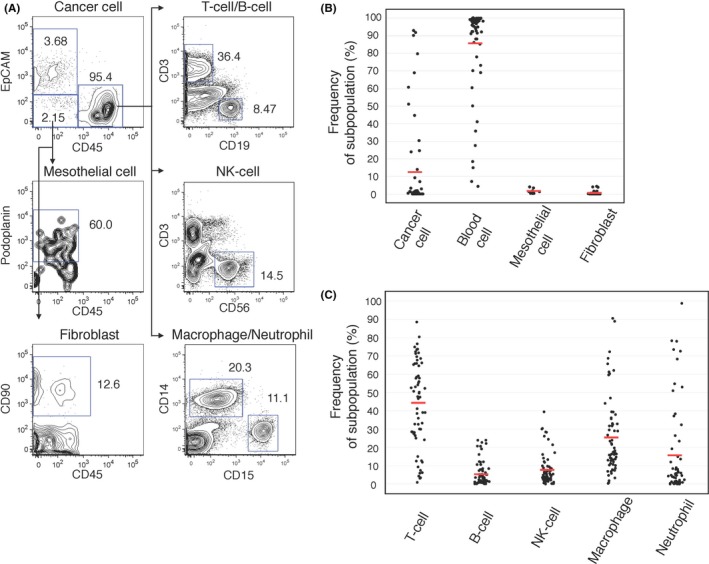
Flow cytometric analysis revealed ascites consisted of ascites tumor cells (ATC) and ascites microenvironment cells (AMC). A, Representative FACS plot of malignant ascites are shown (A24). Each populations is defined as ATC: CD45− EpCAM +; Mesothelial cells: EpCAM − CD45− podoplanin+; Fibroblasts: EpCAM − CD45− CD90+; T cells: CD45+ CD3+; B cells: CD45+ CD19+; NK cells: CD45+ CD3− CD56+; Macrophages: CD45+ CD3− CD14+; and Neutrophils: CD45+ CD3− CD14− CD15+. B, The dot plot indicates the frequencies of each subpopulation (cancer cell, lymphocyte, mesothelial cell and fibroblast) of 65 patients (cancer cell, lymphocyte, fibroblast; n = 63, mesothelial cell; n = 10, unless otherwise indicated; n indicates the number of independent repeat experiments in the following legends). The red line indicates the mean value. C, The dot plot indicates the frequencies of each subpopulation (T‐cell, B‐cell, NK‐cell, macrophage, and neutrophil) of AMC (n = 62). The red line indicates the mean value
3.2. Ascites tumor cells express CD44 with high frequency
To evaluate the specific properties of ATC compared with primary cancer cells, we focused on the CD44‐expressing tumor cells. We analyzed the cohort of 48 patients who were positive for ATC (gastric cancer: 25, colorectal cancer: 14, pancreatic cancer: 9), and another cohort of patients who were available for FACS analyses of primary tumor cells (7 gastric cancer, 10 colorectal cancer and 6 pancreatic cancer). The frequency of CD44‐positive ATC was much higher than that of cells from primary tissues (gastric cancer: 93.0% vs 13.9%, colorectal cancer: 96.3% vs 12.7%, pancreatic cancer: 93.1% vs 16.4%; Figure 2A). To confirm these results, the frequency of CD44‐positive ATC or primary cells obtained from the same patients was analyzed by FACS analysis (Figure 2B, n = 1; colorectal cancer) and IHC (Figure 2C, n = 10; 2 colorectal cancer, 7 gastric cancer and 1 pancreatic cancer). Higher frequency of CD44 and higher intensity of fluorescence was observed in ATC by FACS (n = 1, Figure 2B). In IHC, ATC, which were larger than the other blood cells, were positive for CD44 (>90%) in almost all of the samples, but CD44 expression in the primary cells was only focally positive, as expected (Figure 2C). The quantitative IHC score revealed that CD44 expression was higher in ATC than in primary cells in all cases (10/10; Figure 2C and Table 1). Furthermore, staining patterns of CD44 were different between primary tissues (stained in the membrane) and ATC (stained in the membrane, cytoplasm and nucleus). The distinct difference in expression and the localization of CD44, a functional CSC marker,18 between ATC and primary cancer cells suggested that ATC possessed specific biological features that differed from primary tissues.
Figure 2.
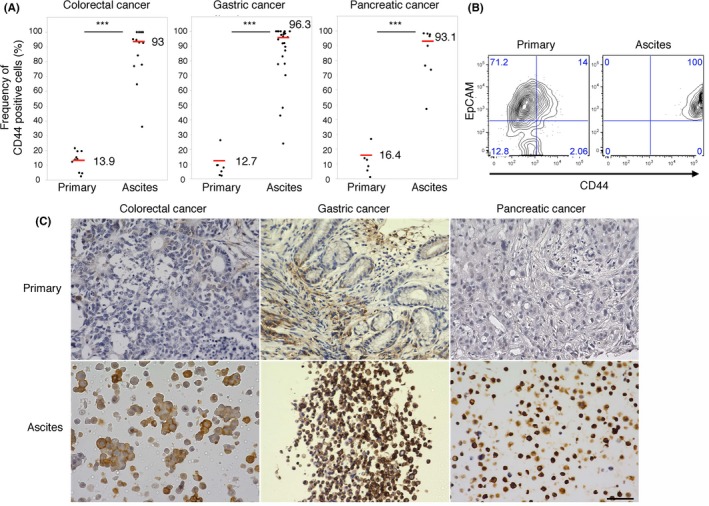
Ascites tumor cells (ATC) express CD44 with high frequency. A, The dot plot indicates the frequency of CD44‐positive cells in malignant ascites and in primary colorectal (n = 25), gastric (n = 14) and pancreatic cancer (n = 9) tissues. The red bar and the value indicate the median of the group. B, FACS analysis of primary tissues and malignant ascites in 1 case (A22: colorectal cancer). The 2‐tailed Student's t test was used for statistical analysis. ***P < 0.001. C, Representative immunohistochemistry image of CD44 staining of identical pairs of primary tissues and malignant ascites of colorectal (A111), gastric (A82) and pancreatic (A18) cancer (n = 10). Scale bars: 50 μm
Table 1.
IHC analysis of identical pairs of primary tissues and ATC
| ID | Age | Sex | Type | CD44 primary | CD44 ATC | ZEB1 primary | ZEB1 ATC | pSMAD2 primary | pSMAD2 ATC |
|---|---|---|---|---|---|---|---|---|---|
| A18 | 49 | m | Pancreatic | 0 | 3 | 1 | 1 | 0 | 3 |
| A27 | 63 | m | Gastric | 0 | 3 | 2 | 1 | 2 | 3 |
| A28 | 82 | m | Gastric | 1 | 3 | 0 | 0 | 0 | 3 |
| A31 | 68 | m | Gastric | 1 | 2 | 1 | 2 | 0 | 3 |
| A32 | 74 | f | Gastric | 2 | 3 | 0 | 2 | 1 | 3 |
| A66 | 76 | m | Gastric | 3 | 3 | 0 | 2 | 1 | 3 |
| A68 | 61 | f | Gastric | 1 | 3 | 1 | 2 | 1 | 3 |
| A82 | 51 | m | Gastric | 0 | 3 | 0 | 2 | 0 | 3 |
| A100 | 39 | f | Colorectal | 0 | 3 | 0 | 2 | 0 | 3 |
| A111 | 83 | f | Colorectal | 0 | 2 | 0 | 2 | 0 | 1 |
Characteristics of patients used for immunohistochemistry (IHC) of CD44, ZEB1 and pSMAD2 staining in identical pairs of primary tissues and ascites tumor cells (ATC). The IHC scores are shown.
3.3. Ascites tumor cells possess mesenchymal‐like features
To investigate the specific features of CD44‐positive ATC, we evaluated gene expression in ATC and primary cancer cells. EpCAM+ CD45− cancer cells were purified from ATC (7 gastric cancer, 5 colorectal cancer and 3 pancreatic cancer) and primary tissues (11 colorectal cancer and 4 gastric cancer). ATC had significantly higher expression of mesenchymal markers, such as vimentin, collagen 1A2, collagen 3A1 and N‐cadherin (Figures 3A and S3A). Intriguingly, there were differences in expression of EMT‐TF between ATC and primary tissues. Higher expression of ZEB1, ZEB2, SNAI2 and TWIST2 was observed in ATC; however, SNAI1 and TWIST1 were more highly expressed in primary tissues than in ATC (Figures 3B and S3B). In contrast, similar expression levels of epithelial markers such as EpCAM, E‐cadherin and CEACAM5 were detected in both samples (Figure S4). Significant differences in ZEB1 expression were confirmed by IHC in identical pairs of ATC and primary tissues (n = 10). ATC in 9 of 10 patients (90%) were positive for ZEB1, but primary tissues in only 4 of 10 (40%) of the same patients were positive for ZEB1 (Figure 3C and Table 1). These results indicated that ATC possessed mesenchymal‐like features, which were regulated by certain EMT‐TF.
Figure 3.
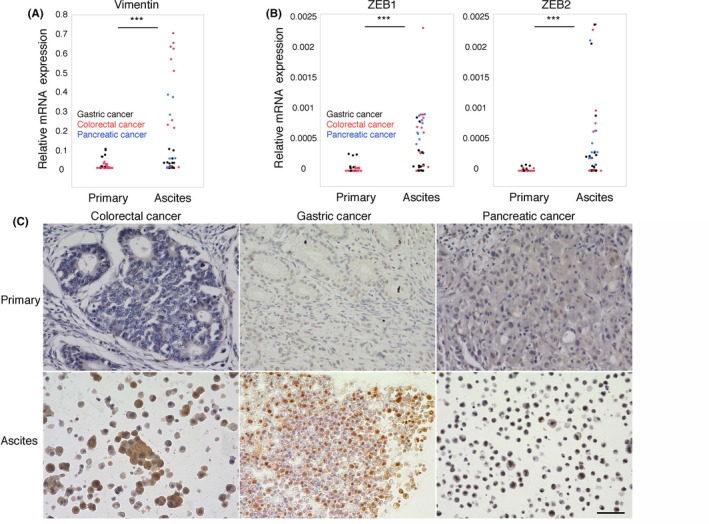
Ascites tumor cells (ATC) possess mesenchymal‐like features. A and B, The dot plot indicates that the relative expression of vimentin,ZEB1 and ZEB2 was higher in malignant ascites (n = 15; black dots for gastric cancer, red dots for colorectal cancer, blue dots for pancreatic cancer) than in primary tissues (n = 15; black dots for gastric cancer and red dots for colorectal cancer), as determined by qPCR. Two‐tailed Student's t test was used for statistical analysis. ***P < 0.001. B, Representative immunohistochemistry image of ZEB1 staining (A82) of identical pairs of primary tissues and malignant ascites of colorectal (A111), gastric (A82) and pancreatic (A18) cancer (n = 10). Scale bars: 50 μm
3.4. Transforming growth factor beta 1 is abundantly released from the ascites microenvironment
We confirmed the ATC‐specific phenotype with high frequency of CD44 (Figure 2) and mesenchymal‐like features (Figure 3). We hypothesized that this ATC‐specific phenotype could be regulated by the microenvironment surrounding the ATC, because ascites fluid contains several types of cytokines and growth factors that can affect the biological features of ATC. In particular, TGF‐beta 1 is a strong inducer of the EMT process by activating EMT‐TF.6 TGF‐beta 1 binds to type 1 or 2 serine/threonine kinase receptors (TGFBR1/2) and transduces intracellular signals mainly through SMAD proteins. Upon TGF‐beta ligation to TGFBR, phosphorylated SMAD2 (pSMAD2) translocates into the nucleus and regulates the transcription of target genes.19 Therefore, we performed IHC of pSMAD2 as a surrogate marker for TGF‐beta activity to determine if ATC can be stimulated by TGF‐beta. The ATC were positive for pSMAD2 in all samples (10/10 100%; Figure 4A and Table 1). In contrast, pSMAD2 staining of identical primary tissues was only focally positive (Figure 4A). Furthermore, multiplex qPCR showed that signal transducers of TGF‐beta signaling, such as SMAD1, SMAD2 and SMAD3, were highly expressed in ATC (Figure 4B). These results suggest that TGF‐beta signaling is sufficiently activated in malignant ascites and contributes to the acquisition of ATC‐specific properties. To evaluate the concentration of TGF‐beta 1 in malignant ascites, we performed an ELISA of the supernatant of ascites fluid. TGF‐beta 1 was detected in all patients (n = 38), including those with colorectal (n = 14), gastric (n = 17) and pancreatic cancers (n = 7). The median concentration of TGF‐beta 1 in the ascites fluids was 968.6 pg/mL (Figure 4C), which could sufficiently affect ATC phenotype and function. To identify the cell population that secretes TGF‐beta 1, we purified ATC and AMC by FACS analysis and evaluated the gene expression of TGF‐beta 1 by qPCR. It is noteworthy that higher TGF‐beta 1 expression was observed in lymphocytes and myeloid cells compared to ATC (Figure S5A), suggesting that TGF‐beta 1 is mainly secreted by AMC. In particular, patients with a high frequency of NK cells had a high concentration of TGF‐beta 1 (Figure S5B). These results indicated that the ATC‐specific properties were affected by TGF‐beta 1 released from the ascites microenvironment.
Figure 4.
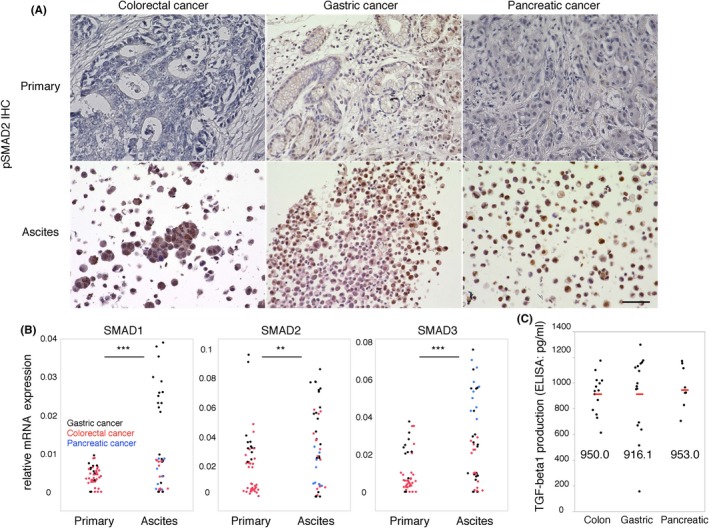
Transforming growth factor beta‐1 (TGF‐beta 1) is abundantly released from the ascites microenvironment. A, Representative immunohistochemistry image of pSMAD2 staining (A82) of identical pairs of primary tissues and malignant ascites of colorectal (A111), gastric (A82) and pancreatic (A18) cancer (n = 10). Scale bars: 50 μm. B, The dot plot indicates that the relative expression of SMAD1,SMAD2 and SMAD3 was higher in malignant ascites (n = 15; black dots for gastric cancer, red dots for colorectal cancer and blue dots for pancreatic cancer) than in primary tissues (n = 15; black dots for gastric cancer and red dots for colorectal cancer), as determined by quantitative PCR (qPCR). Two‐tailed Student's t test was used for statistical analysis. **P < 0.01; ***P < 0.001. C, The dot plot indicates TGF‐beta 1 production in the supernatant of ascites fluid (n = 38). The red bar and the value indicate the median of the group
3.5. Transforming growth factor beta 1 induces epithelial‐mesenchymal transition with CD44+ CSC‐like cells in vitro
To test whether TGF‐beta 1 secreted from ascites microenvironment could contribute to ATC‐specific properties such as high CD44 expression and mesenchymal‐like features, we cultured ATC from patients in vitro. FACS analysis showed that the cultured ATC were positive for EpCAM, suggesting that they maintained the epithelial phenotype (Figure 5A). TGF‐beta 1 treatment (TGF‐beta 1, 10 ng/mL) morphologically changed the ATC phenotype into spindle‐shaped cells, suggesting that mesenchymal‐like features were conferred. With this morphological change, TGF‐beta 1 upregulated the gene expression of SNAI1, TWIST1, vimentin and N‐cadherin concomitant with E‐cadherin downregulation in cultured ATC (Figure 5D). These results clearly indicated that the TGF‐beta signaling pathway induced the EMT in cultured ATC in vitro. Surprisingly, the frequency of CD44‐positive cells in these cultured ATC was significantly higher after TGF‐beta 1 treatment, as determined by FACS analysis (Figure 5D). Taken together, we showed the important role of TGF‐beta 1 in maintaining the properties of ATC. To evaluate the functional role of ATC properties, we performed the sphere‐forming assay to assess whether TGF‐beta 1 treatment contributes to CSC properties. TGF‐beta 1 treatment induced sphere‐forming ability in cultured ATC, whereas control cells only had slightly formed spheres (Figure 5C). These results suggested that TGF‐beta 1‐treated cultured ATC acquired CSC‐like properties with the EMT in vitro.
Figure 5.
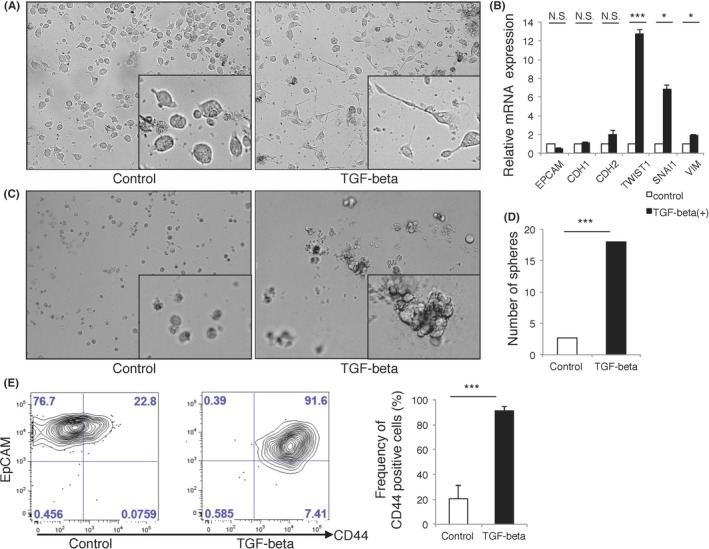
Transforming growth factor beta‐1 (TGF‐beta 1) induces epithelial‐mesenchymal transition (EMT) with CD44+ cancer stem cells (CSC)‐like cells in vitro. A, Representative bright field image of cultured ascites tumor cells (ATC) are shown (A1). TGF‐beta 1 treatment (10 ng/mL) induced cells with spindle‐like shape in cultured ATC (n = 3). B, Bar plot of the relative expression of EMT‐related genes and epithelial genes are shown (n = 3). C, Representative bright field image of sphere‐forming assay of cultured ATC are shown (A1). TGF‐beta 1 induced sphere‐forming ability in cultured ATC(n = 3). D, Bar plot indicates number of sphere in cultured ATC after TGF‐beta 1 treatment (n = 3). E, Representative FACS plot and summarized bar plot of induced expression of CD44 in cultured ATC after TGF‐beta 1 treatment (n = 3). *P < 0.05; ***P < 0.001; N.S., not significant. Data are representative of at least 3 independent experiments
4. DISCUSSION
In various malignancies, ascites is a sign of advanced disease and poor prognosis, with only 11% of patients surviving longer than 6 months.20 The characteristics of ATC might contribute to the poor prognosis of patients with malignant ascites. Here, we showed distinct traits of ATC, revealing the high frequency of CD44 and the EMT phenotype compared to primary tissues.
Distinct expression of SMAD in ATC and our in vitro data support the significance of TGF‐beta signaling in the maintenance of ATC's properties. Because TGF‐beta was abundantly produced from AMC, ascites fluid is thought to constitute a unique tumor microenvironment and to regulate the fate of ATC.
CD44 is a representative CSC marker in various malignancies, including gastrointestinal cancer, and it is expressed in a small population (10%‐20%) of cancer cells.9, 10, 11, 12 The overwhelmingly high frequency of CD44‐positive cells in ATC compared to primary cancer cells suggests that constitutively active signaling may induce CD44 expression in ATC within malignant ascites. The expression of CD44 is preferentially induced by activation of EMT‐TF, including SNAI, TWIST and ZEB families, and is regulated by the TGF‐beta signaling pathway upstream of these EMT‐TF.13, 14 Our data suggest that active TGF‐beta signaling and high expression of EMT‐TF in ATC may lead to the generation of CSC within malignant ascites, although we could not fully show the stemness of ATC in our in vitro and in vivo experiments (data not shown). That might have been due to an insufficient cell number for assays using ATC, or the fact that ATC themselves cannot maintain stemness in the absence of external factors such as cytokine stimulation from ascites fluid. The decrease in CD44 expression in vitro in cultured ATC (data not shown) indicated that ATC require other external factors to maintain CD44 expression. Our in vitro data showing sphere formation and induction of CD44 expression after TGF‐beta 1 stimulation supported stemness maintenance by TGF‐beta signaling.
Although our in vitro experiments indicated the significance of exogenous TGF‐beta in CD44 expressing ATC, the other mechanism underlying the high‐frequency and unique localization of CD44 should be discussed. CD44 is a widely distributed cell surface molecule that possesses various physiological and pathological roles; at the same time, CD44 itself functions as an intracellular signaling molecule. After sequential cleavage of ectodomain and the intracellular domain of CD44, the intracellular domain of CD44 functions as a signal transduction molecule through translocation into the nucleus.21 Cytoplasmic and nucleus localization patterns of CD44 in ATC shown by IHC of our experiments (Figure 2c) might suggest the presence of CD44‐intracellular domain. Because the cleavage of CD44 is induced by matrix metalloproteinase (MMP)‐2 and MMP‐9,22 the unique localization of CD44 and the distinct phenotype in ATC might be affected by these MMPs, which are sufficiently produced in ascites fluid.23
Taking into account the signal transduction of the ATC, the genetic status of TGF‐beta‐related genes should be discussed. Generally, somatic mutations of TGF‐beta signaling‐related genes are reported to contribute to unresponsiveness to TGF‐beta‐induced EMT.24 In particular, SMAD4 mutation occurs in 32% of pancreatic cancer,25 16% of non‐hyper‐mutated colorectal cancer26 and 8% of non‐hyper‐mutated gastric cancer patients.27 Dominant negative mutation of SMAD2, SMAD3 and SMAD4 resulted in unresponsiveness to TGF‐beta‐induced EMT through disruption of canonical SMAD‐mediated TGF‐beta signaling, although EMT can be induced in control cells by TGF‐beta stimulation.28 However, a recent study revealed SMAD‐independent activation of TGF‐beta signaling29 through other pathways, such as ERK pathway, PI3‐kinase/AKT pathway and Rho‐like GTPase pathway, in response to TGF‐beta. These SMAD‐independent pathways might contribute to the EMT phenotype in SMAD4‐mutated gastrointestinal cancer. In our IHC analysis, all samples (10 out of 10 patients) were positive for pSMAD2, suggesting that SMAD‐mediated TGF‐beta signaling was activated in our 10 patients. However, in consideration of the high frequency of SMAD4 mutation in gastrointestinal cancer, a certain number of SMAD4 mutated patients could be included in the other results of our data. The SMAD‐independent pathway might contribute to the characteristic phenotype of ATC in SMAD4‐mutated patients in some way. Mutation of TGFBR2, the representative receptor of TGF‐beta, which causes its loss of function as a signal transducer of TGF‐beta signaling, should also be discussed. More than 50% of hyper‐mutated colorectal cancer26 and hyper‐mutated gastric cancer,30 and 5% of pancreatic cancer25 had a TGFBR2 mutation. In fact, EMT cannot be induced in TGFBR2‐mutated colon cancer cell lines because of inactivated TGFBR2‐mediated TGF‐beta signaling,31 while EMT phenotype can be induced in cell lines with wild‐type TGFBR2 by TGF‐beta stimulation. However, in view of its lower frequency, the effect of TGFBR2 mutation could be minimized when the experiments are performed with a statistically sufficient sample size. Taking into consideration the complicated cross‐talk between TGF‐beta‐related genes’ mutation and TGF‐beta response, we need to carefully interpret the results obtained from our diverse cohort, and genomic analysis should be considered for further comprehension of the results.
Taken together, the present analysis of ATC and AMC revealed the components of gastrointestinal malignant ascites. Activation of EMT and the high CD44 expression in ATC appeared to be maintained by abundant TGF‐beta in the malignant ascites. This study provides new insight into the biology of malignant ascites that consist of tumor cells and their microenvironment.
CONFLICT OF INTEREST
The authors have no conflicts of interest to declare.
Supporting information
ACKNOWLEDGMENTS
This study was supported in part by the Japan Society for the Promotion of Science, and KMOG, a non‐profit organization. The primary tissues of colorectal, gastric and pancreatic cancer were provided by N. Torada, T. Ueki, T. Manabe and M. Nakamura from the Department of Surgery and Oncology, Kyushu University. Co‐workers from our laboratories, A. Yurino, Y. Ohmura and T. Yoshihiro, supported this work.
Nakano M, Ito M, Tanaka R, et al. Epithelial‐mesenchymal transition is activated in CD44‐positive malignant ascites tumor cells of gastrointestinal cancer. Cancer Sci. 2018;109:3461–3470. 10.1111/cas.13777
REFERENCES
- 1. Chambers AF, Groom AC, MacDonald IC. Dissemination and growth of cancer cells in metastatic sites. Nat Rev Cancer. 2002;2:563‐572. [DOI] [PubMed] [Google Scholar]
- 2. Kipps E, Tan DS, Kaye SB. Meeting the challenge of ascites in ovarian cancer: new avenues for therapy and research. Nat Rev Cancer. 2013;13:273‐282. [DOI] [PMC free article] [PubMed] [Google Scholar]
- 3. Kitayama J, Emoto S, Yamaguchi H, et al. Flow cytometric quantification of intraperitoneal free tumor cells is a useful biomarker in gastric cancer patients with peritoneal metastasis. Ann Surg Oncol. 2015;22:2336‐2342. [DOI] [PubMed] [Google Scholar]
- 4. Matte I, Lane D, Laplante C, Rancourt C, Piche A. Profiling of cytokines in human epithelial ovarian cancer ascites. Am J Cancer Res. 2012;2:566‐580. [PMC free article] [PubMed] [Google Scholar]
- 5. Ye X, Weinberg RA. Epithelial‐mesenchymal plasticity: a central regulator of cancer progression. Trends Cell Biol. 2015;25:675‐686. [DOI] [PMC free article] [PubMed] [Google Scholar]
- 6. De Craene B, Berx G. Regulatory networks defining EMT during cancer initiation and progression. Nat Rev Cancer. 2013;13:97‐110. [DOI] [PubMed] [Google Scholar]
- 7. Shibue T, Weinberg RA. EMT, CSCs, and drug resistance: the mechanistic link and clinical implications. Nat Rev Clin Oncol. 2017;14:611‐629. [DOI] [PMC free article] [PubMed] [Google Scholar]
- 8. Polyak K, Weinberg RA. Transitions between epithelial and mesenchymal states: acquisition of malignant and stem cell traits. Nat Rev Cancer. 2009;9:265‐273. [DOI] [PubMed] [Google Scholar]
- 9. Dalerba P, Dylla SJ, Park IK, et al. Phenotypic characterization of human colorectal cancer stem cells. Proc Natl Acad Sci USA. 2007;104:10158‐10163. [DOI] [PMC free article] [PubMed] [Google Scholar]
- 10. Lee CJ, Dosch J, Simeone DM. Pancreatic cancer stem cells. J Clin Oncol. 2008;26:2806‐2812. [DOI] [PubMed] [Google Scholar]
- 11. Takaishi S, Okumura T, Tu S, et al. Identification of gastric cancer stem cells using the cell surface marker CD44. Stem Cells. 2009;27:1006‐1020. [DOI] [PMC free article] [PubMed] [Google Scholar]
- 12. Al‐Hajj M, Wicha MS, Benito‐Hernandez A, Morrison SJ, Clarke MF. Prospective identification of tumorigenic breast cancer cells. Proc Natl Acad Sci USA. 2003;100:3983‐3988. [DOI] [PMC free article] [PubMed] [Google Scholar]
- 13. Mani SA, Guo W, Liao MJ, et al. The epithelial‐mesenchymal transition generates cells with properties of stem cells. Cell. 2008;133:704‐715. [DOI] [PMC free article] [PubMed] [Google Scholar]
- 14. Morel AP, Lievre M, Thomas C, Hinkal G, Ansieau S, Puisieux A. Generation of breast cancer stem cells through epithelial‐mesenchymal transition. PLoS One. 2008;3:e2888. [DOI] [PMC free article] [PubMed] [Google Scholar]
- 15. Cho SH, Park YS, Kim HJ, et al. CD44 enhances the epithelial‐mesenchymal transition in association with colon cancer invasion. Int J Oncol. 2012;41:211‐218. [DOI] [PubMed] [Google Scholar]
- 16. Yurino A, Takenaka K, Yamauchi T, et al. Enhanced reconstitution of human erythropoiesis and thrombopoiesis in an immunodeficient mouse model with kit(Wv) mutations. Stem Cell Reports. 2016;7:425‐438. [DOI] [PMC free article] [PubMed] [Google Scholar]
- 17. van de Geijn GM, van Gent M, van Pul‐Bom N, Beunis MH, van Tilburg AJ, Njo TL. A new flow cytometric method for differential cell counting in ascitic fluid. Cytometry B Clin Cytom. 2016;90:506‐511. [DOI] [PubMed] [Google Scholar]
- 18. Zoller M. CD44: can a cancer‐initiating cell profit from an abundantly expressed molecule? Nat Rev Cancer. 2011;11:254‐267. [DOI] [PubMed] [Google Scholar]
- 19. Massague J. TGFbeta signalling in context. Nat Rev Mol Cell Biol. 2012;13:616‐630. [DOI] [PMC free article] [PubMed] [Google Scholar]
- 20. Parsons SL, Lang MW, Steele RJ. Malignant ascites: a 2‐year review from a teaching hospital. Eur J Surg Oncol. 1996;22:237‐239. [DOI] [PubMed] [Google Scholar]
- 21. Okamoto I, Kawano Y, Murakami D, et al. Proteolytic release of CD44 intracellular domain and its role in the CD44 signaling pathway. J Cell Biol. 2001;155:755‐762. [DOI] [PMC free article] [PubMed] [Google Scholar]
- 22. Okamoto I, Kawano Y, Tsuiki H, et al. CD44 cleavage induced by a membrane‐associated metalloprotease plays a critical role in tumor cell migration. Oncogene. 1999;18:1435‐1446. [DOI] [PubMed] [Google Scholar]
- 23. Sun XM, Dong WG, Yu BP, Luo HS, Yu JP. Detection of type IV collagenase activity in malignant ascites. World J Gastroenterol. 2003;9:2592‐2595. [DOI] [PMC free article] [PubMed] [Google Scholar]
- 24. Foroutan M, Cursons J, Hediyeh‐Zadeh S, Thompson EW, Davis MJ. A transcriptional program for detecting TGFbeta‐induced EMT in cancer. Mol Cancer Res. 2017;15:619‐631. [DOI] [PubMed] [Google Scholar]
- 25. Cancer Genome Atlas Research Network. Electronic address aadhe, cancer genome atlas research network . Integrated genomic characterization of pancreatic ductal adenocarcinoma. Cancer Cell. 2017;32(185–203):e13. [DOI] [PMC free article] [PubMed] [Google Scholar]
- 26. Yaeger R, Chatila WK, Lipsyc MD, et al. Clinical sequencing defines the genomic landscape of metastatic colorectal cancer. Cancer Cell. 2018;33(125–36):e3. [DOI] [PMC free article] [PubMed] [Google Scholar]
- 27. Cancer Genome Atlas Research Network . Comprehensive molecular characterization of gastric adenocarcinoma. Nature. 2014;513:202‐209. [DOI] [PMC free article] [PubMed] [Google Scholar]
- 28. Valcourt U, Kowanetz M, Niimi H, Heldin CH, Moustakas A. TGF‐beta and the Smad signaling pathway support transcriptomic reprogramming during epithelial‐mesenchymal cell transition. Mol Biol Cell. 2005;16:1987‐2002. [DOI] [PMC free article] [PubMed] [Google Scholar]
- 29. Derynck R, Zhang YE. Smad‐dependent and Smad‐independent pathways in TGF‐beta family signalling. Nature. 2003;425:577‐584. [DOI] [PubMed] [Google Scholar]
- 30. Song JH, Lee HS, Yoon JH, et al. TGFBR2 frameshift mutation in gastric tumors with microsatellite instability. Mol Cell Toxicol. 2010;6:321‐326. [Google Scholar]
- 31. Pino MS, Kikuchi H, Zeng M, et al. Epithelial to mesenchymal transition is impaired in colon cancer cells with microsatellite instability. Gastroenterology. 2010;138:1406‐1417. [DOI] [PMC free article] [PubMed] [Google Scholar]
Associated Data
This section collects any data citations, data availability statements, or supplementary materials included in this article.
Supplementary Materials