

Abstract
The PHLDA family (pleckstrin homology‐like domain family) of genes consists of 3 members: PHLDA1, 2, and 3. Both PHLDA3 and PHLDA2 are phosphatidylinositol (PIP) binding proteins and function as repressors of Akt. They have tumor suppressive functions, mainly through Akt inhibition. Several reports suggest that PHLDA1 also has a tumor suppressive function; however, the precise molecular functions of PHLDA1 remain to be elucidated. Through a comprehensive screen for p53 target genes, we identified PHLDA1 as a novel p53 target, and we show that PHLDA1 has the ability to repress Akt in a manner similar to that of PHLDA3 and PHLDA2. PHLDA1 has a so‐called split PH domain in which the PH domain is divided into an N‐terminal (β sheets 1‐3) and a C‐terminal (β sheets 4‐7 and an α‐helix) portions. We show that the PH domain of PHLDA1 is responsible for its localization to the plasma membrane and binding to phosphatidylinositol. We also show that the function of the PH domain is essential for Akt repression. In addition, PHLDA1 expression analysis suggests that PHLDA1 has a tumor suppressive function in breast and ovarian cancers.
Keywords: Akt, p53, PH domain, PHLDA family, tumor suppressor
1. INTRODUCTION
The PHLDA1 (pleckstrin homology like domain family, member 1) gene is a member of a family of three PHLDA genes.1 Interestingly, all three of these genes have been reported to suppress growth stimulatory signaling or tumorigenesis, as we describe below. We and others have reported that both PHLDA3 and PHLDA2 are repressors of Akt2, 3 that function by binding to PIPs (phosphatidylinositols) and competing for PIP interaction with Akt. We have also reported that in human pancreatic neuroendocrine tumors, the PHLDA3 gene is often found to have undergone a 2‐hit inactivation, indicating that PHLDA3 functions as a tumor suppressor gene in these cancers.4, 5 We and others have further reported that reduced expression of PHLDA3 is associated with poorer prognosis of cancer patients.5, 6 It has also been reported that PHLDA3 represses the growth and tumorigenesis of HrasV12; p53 null mouse embryonic fibroblasts (MEFs) or human nonsmall‐cell lung carcinoma cells, providing further support for a role of PHLDA3 in tumor suppression.7 Similar to PHLDA3, PHLDA2 has been reported to suppress cell growth and tumorigenesis. Placental overgrowth is observed in PHLDA2‐deficient mice, and PHLDA2 is involved in oncogene‐induced negative feedback inhibition of epidermal growth factor receptor/ErbB2 signaling.8, 9 Thus, both PHLDA3 and PHLDA2 possess tumor‐suppressive functions, mediated mainly through their inhibition of Akt function. Finally, PHLDA1 has been reported to induce apoptosis in various cells including T cells, hippocampal cells, endothelial cells, melanoma cells, and MEFs.10, 11, 12, 13 Reduced expression of PHLDA1 has been reported in melanoma, breast carcinoma, oral carcinoma, and gastric adenocarcinoma, and lower expression of PHLDA1 is associated with the malignant phenotype of cholangiocarcinoma.13, 14, 15, 16, 17, 18 It has also been reported that PHLDA1 is involved in the repression of growth factor signaling.19, 20 Although these reports suggest that PHLDA1 can function as a tumor suppressor, its precise molecular activity remains unknown.
These three PHLDA family gene members share similar gene organization, consisting of one coding exon and one noncoding exon separated by a small intron.21 All 3 genes encode PH domain‐containing proteins, and the proteins share high similarity within their PH domains.1 Although both PHLDA3 and PHLDA2 contain a PH domain, PHLDA1 has a so‐called split PH domain in which the PH domain is divided into an N‐terminal (β sheets 1‐3) and C‐terminal (β sheets 4‐7 and an α‐helix) portion. It has been reported that the N‐terminal and C‐terminal portions of the split PH domain associate with each other to form a complete functional PH domain.22 Although binding of the PH domains from PHLDA3 and PHLDA2 to PIPs have been reported by several groups, including ours, binding of the PHLDA1 PH domain to PIP has yet to be confirmed.2, 3, 23 Moreover, the PHLDA1 gene encodes 2 isoforms containing 401 and 260 amino acids, respectively, but the functions of each have not been compared.
We previously identified PHLDA3 as a p53‐regulated repressor of Akt.2 Here, we show that PHLDA1 is also a p53 target gene, and between the 2 isoforms encoded by the PHLDA1 gene, the short isoform is predominantly expressed in a number of cancer cell lines. In addition, we show that PHLDA1 can function as an Akt repressor in a manner similar to that of PHLDA3 and PHLDA2. Thus, the PH domains of these PHLDA family proteins share the ability to repress Akt function by binding to PIPs.
2. MATERIALS AND METHODS
2.1. RNA preparation and northern blotting analysis
RNA was prepared using an RNeasy Midi kit (Qiagen, Hilden, Germany). Northern blotting was carried out as described.24 Probes were prepared using a BcaBEST labeling kit (TaKaRa, Bio, Shiga, Japan) and purified by serial purification using a Probe Quant G‐50 MicroColumn (Amersham) and NICK Column (Amersham, Little Chalfont, UK). The full ORF of PHLDA1 was used for probe preparation.
2.2. Western blot analysis
Cells were lysed in lysis buffer (50 mmol/L Tris‐HCl [pH 8.0], 1% NP40, 250 mmol/L NaCl, 5 mmol/L EDTA, 10 mmol/L NaF, 1 mmol/L Na3VO4, 1 mmol/L protease inhibitor [PMSF, aprotinin, and leupeptin], and 1 mmol/L DTT). Whole cell lysates were subjected to protein quantification and analyzed by western blotting. Antibodies used in this study were: anti‐PHLDA1 (RN‐6E2) mouse mAb from Santa Cruz Biotechnology (Dallas, TX, USA), anti‐Akt rabbit polyclonal antibody (C67E7), anti‐phospho‐Akt (S473) rabbit polyclonal antibody (D9E) from Cell Signaling Technology (Danvers, MA, USA), anti‐GST mouse mAb (clone B‐14) and anti‐DDDDK‐tag from MBL (PM020) (Aichi, Japan), and anti‐actin mouse mAb (C4) from EMD Millipore (Burlington, MA, USA).
2.3. Plasmids
2.3.1. Pleckstrin homology‐like domain A1 constructs
Human WT PHLDA1 or mutant PHLDA1 was tagged with BamHI and SalI sites at the 5′‐ and 3′‐ends, respectively, and cloned into the BamHI/XhoI site of the pcDNA3 vector.
2.3.2. Enhanced GFP fusion constructs
Human WT PHLDA1 or mutant PHLDA1 was tagged with BamHI and SalI sites at the 5′‐ and 3′‐ends, respectively, and cloned into the BglII/SalI site of the pEGFP‐C1 vector (Clontech, Mountain View, CA, USA).
2.3.3. FLAG‐tagged constructs
Human WT PHLDA1 or mutant PHLDA1 was tagged at the C terminus with FLAG and cloned into pcDNA3.
2.4. Cell lines, cell culture, and transfection
Cell lines used in this study were: HeLa (human cervical cancer), HCT116 p53+/+, HCT116 p53−/− (human colon cancer), MDA‐MB‐468 (human breast cancer), SK‐MEL‐28 (human melanoma), MDA‐MB‐231 (human breast cancer), OE33 (human esophageal carcinoma), BxPC‐3 (human pancreatic adenocarcinoma), HCC38 (human breast cancer), HCC1937 (human breast cancer), ACHN (human kidney adenocarcinoma), MCF7 (human breast adenocarcinoma), 293T (human embryonic kidney cells transformed with large T antigen), COS‐7 (African green monkey kidney immortalized cells), and p53+/+ and p53−/− MEFs. Cell culture and transfection were carried out as described.24 Transient transfection assays were undertaken using Lipofectamine 2000 (Invitrogen, Carlsbad, CA, USA). The siRNAs were introduced using RNAiMAX (Invitrogen). Control, ON‐target plus PHLDA1‐targeting siRNAs were purchased from Dharmacon Research (Lafayette, CO, USA).
2.5. Microarray expression analysis, ChIP sequencing, and transcriptional start site sequencing
Microarray expression analysis and ChIP sequencing (ChIP‐seq) were carried out as described.25, 26 For p53 induction, cells were treated with doxorubicin (3 μmol/L), 5‐fluorouracil (5‐FU; 0.375 mmol/L), UV irradiation (10 or 45 J), or γ‐irradiation (30 Gy). Antibodies against p53 (FL393; Santa Cruz Biotechnology), H3K27ac, H3K4me1, H3K4me3 (07‐473; EMD Millipore), or phospho‐RNA polymerase II (RNAP II) were used to precipitate immune complexes. Antibodies against H3K27ac, H3K4me1, and phospho‐RNAP II were kindly provided by Dr. Hiroshi Kimura, Tokyo Institute of Technology (Tokyo, Japan). The ChIP signal values for p53, K4me3, K4me1, K27ac, and Pol2 (5‐FU treatment, 9 hours) were analyzed. p53‐Consensus regions were computationally determined using the TRANSFAC database (http://gene-regulation.com/pub/databases.html). Transcriptional start site (TSS) sequencing (5‐FU treatment, 9 hours) was carried out as described.27
2.6. Expression and purification of GST‐fusion proteins
Glutathione S‐transferase fusion constructs of PHLDA1 and the PH domain of Akt were prepared by PCR tagging of PHLDA1 cDNA with BamHI and XhoI sites at the 5′‐ and 3′‐ends, respectively, and subcloned into pGEX‐6P‐1 vector (Amersham Pharmacia, Buckinghamshire, UK). Constructs were expressed in Escherichia coli (BL21‐Gold [DE3] Competent Cell; Stratagene, San Diego, CA, USA) and purified from cell lysates using glutathione‐Sepharose 4B beads (Amersham Pharmacia).
2.7. Reverse transcription and real‐time PCR
Total RNA was extracted from cells, and 0.2‐5 μg RNA was subjected to reverse transcription using ReverTra Ace (Toyobo, Osaka, Japan) or SuperScript IV RT (Thermo Fisher Scientific, Waltham, MA, USA) following the manufacturer's instructions. cDNAs were quantified with real‐time PCR, undertaken with the CFX96 Touch Real‐Time PCR Detection System (Bio‐Rad, Hercules, CA, USA). TaqMan probes for human PHLDA1, PHLDA3, and GAPDH (hsPHLDA1; Hs00378285_g1, hsPHLDA3; Hs00385313_m1 and hsGAPDH; Hs02758991_g1) from Applied Biosystems (Foster City, CA, USA) and TaqMan probes for mouse Phlda1, Phlda3, Gapdh, and 18S rRNA from Integrated DNA Technologies (Coralville, IA, USA) were utilized to quantify the mRNA levels of Phlda1, Phlda3, Gapdh, and 18S rRNA.
2.8. Absolute quantification of PHLDA1 and PHLDA3 in adult mice organs
We used serial dilutions of Phlda1 and Phlda3 PCR‐amplified DNA fragments to obtain a standard curve. Primers used for PCR amplification were: Mm_Phlda3‐forward, GTCCTAAACCATGAGGCGTATCA; Mm_Phlda3‐reverse, GTTGGTTTCACCTGTCTCTTCGAC; Mm_Phlda1‐forward, CGGGCCACTCAAGGTTTTGA; and Mm_Phlda1‐reverse, TGGGGAGACTCTGTTGGTTTTG.
We examined 25.6‐400 000 copies/10 μL PCR reaction with 5 intermediate five‐fold serial dilutions. To control for tube‐to‐tube differences in RNA loading and/or degradation, 18S rRNA was used as an internal control.
2.9. Protein‐lipid overlay assay
Protein‐lipid overlay assays were carried out basically as previously described.28 The membrane with various phospholipids (P‐6100; Echelon Biosciences, Salt Lake City, UT, USA) was blocked in 4% skim milk in TBST buffer (50 mmol/L Tris‐HCl, 150 mmol/L NaCl, and 0.1% Tween 20 [pH 8.0]), then in 3% fatty acid‐free BSA (Sigma‐Aldrich, St. Louis, MO, USA) in TBST buffer for 30 minutes each at room temperature. The membrane was incubated for 1 hour at room temperature in the same solution with 0.3 μg/mL GST‐tagged protein. After washing the membrane 6 times (10 min each) with TBST buffer, the membrane was incubated for 3 hours at room temperature with a 1:3000 dilution of the anti‐PHLDA1 mouse mAb (RN‐6E2, Santa Cruz Biotechnology; ab14999‐50, Abcam, Cambridge, UK). The membrane was washed as described above and then incubated with a 1:20 000 dilution of peroxidase‐linked anti‐mouse IgG (NA931V; GE Healthcare, Chicago, IL, USA). Finally, the membrane was washed with TBST buffer, and GST‐tagged protein binding to the phospholipids was detected by enhanced chemiluminescence.
2.10. Lipid bead‐protein pull‐down assay
Lipid beads were purchased from Echelon Biosciences. Lipid Bead‐Protein Pull‐down Assays were carried out basically as described in manufacture's protocol. Briefly, PI (3, 4, 5) P3 conjugated beads were blocked in 3% fatty acid‐free BSA (Sigma‐Aldrich) in the wash/binding buffer (10 mmol/L HEPES [pH 7.4], 150 mmol/L NaCl, and 0.25% NP40) at 4°C for 1 hour. Blocked beads were incubated with 0.1 mg/mL of GST or GST‐tagged proteins at 4°C for 1 hour. After washing, samples were subjected to western blot analysis.
2.11. Proliferation assay
COS‐7 cells were transfected with plasmids expressing the PHLDA1‐short form tagged on the C terminus with EGFP or the parental pEGFP‐C1 control. Transfected cells were detached with trypsin + EDTA and subcultured in 6‐well plates with fresh media. Time‐lapse imaging with phase contrast and GFP signals were captured and analyzed by IncuCyte (Sartorius, Göttingen, Germany). Numbers of EGFP‐positive cells were assessed by calculating the area of GFP signals, as analyzed with the time‐lapse images.
3. RESULTS
3.1. PHLDA1 gene is induced by various types of DNA damage and is a p53 target gene
We previously undertook a comprehensive screen to identify p53 target genes and reported that PHLDA3 was among these targets.2, 24 We also identified the related PHLDA1 in this screen and undertook here to characterize its function. PHLDA1 mRNA (Figures 1A‐D and S1) and protein (Figure 1E) was induced by DNA‐damaging reagents such as doxorubicin, 5‐FU, or γ‐irradiation in cell lines having WT p53 (HCT116 p53+/+, ACHN, and MCF7 cells and MEFs). In addition, induction of the PHLDA1 mRNA was p53‐dependent in HCT116 cells and MEFs (Figure 1A,D).
Figure 1.

PHLDA1 (pleckstrin homology‐like domain family, member 1) is induced by various types of damage and is a target gene of p53 (A). Expression of PHLDA1 was analyzed by microarray expression analysis. HCT116 p53+/+, HCT116 p53−/− were treated with doxorubicin (ADR; 3 μmol/L), 5‐fluorouracil (5‐FU; 0.38 mmol/L), UV (10 or 45 J), or γ‐ray irradiation (30 Gy), and harvested at the indicated times. B‐D, PHLDA1 mRNA levels were analyzed by quantitative RT‐PCR. PHLDA1 expression levels were normalized to GAPDH. Bars show mean values of three independent experiments with SD. **P < 0.01 and ***P < 0.001 were calculated by the two‐tailed Student's t test. ACHN cells were subjected to γ‐ray irradiation (30 Gy), and harvested 12 or 18 hours post‐irradiation (B). MCF7 cells were subjected to γ‐ray irradiation (30 Gy), and harvested 48 hours post‐irradiation (C). Wild‐type or p53 −/− mouse embryonic fibroblasts (MEFs) were treated or not treated with γ‐ray irradiation (30 Gy), and harvested 4 hours post‐irradiation (D). E, PHLDA1 protein levels were analyzed by western blotting. MCF7 cells were subjected to γ‐ray irradiation (30 Gy), and harvested 48 hours post‐irradiation. Signal intensities of PHLDA1 were quantified and normalized to β‐actin. F, Genomic locus of PHLDA1 is shown together with the ChIP sequencing (ChIP‐seq) results. HCT116 p53+/+ cells were treated or not treated with 5‐FU and used for ChIP‐seq analysis. ChIP‐seq analyses were undertaken using Abs against p53, H3K27ac, H3K4me1, H3K4me3, and phospho‐RNA polymerase II (RNAP II), and the p53 binding site was identified. The resulting sequences were mapped to the build #36 reference human genome. G, The nucleotide sequence of the p53 binding site we identified is shown together with the consensus p53 binding sequence. Nucleotides that match the consensus p53 binding sequences are shown in upper case. H, I, PHLDA1 expression in CCLE cancer cell lines and in TCGA pan‐ovarian cancers. Left and right boxes show the results obtained for cell lines expressing WT and mutant p53, respectively. Bars show mean values with SEM. *P < 0.05 and **P < 0.01 were calculated by Student's t test
The PHLDA1 genomic region was analyzed by ChIP‐seq analysis of 5‐FU‐treated HCT116 p53+/+ cells. We detected H3K4 trimethylation surrounded by H3K4 monomethylation at the PHLDA1 gene promoter region (Figure 1F). Furthermore, we detected phospho‐RNAP II binding to the PHLDA1 transcribed region. These data show that PHLDA1 is actively transcribed in 5‐FU‐treated cells. The ChIP‐seq analysis identified a p53 binding site 10 kb downstream of the PHLDA1 gene (Figure 1F). We found sequences highly similar to the p53 consensus binding sequence at the p53 binding site (TRANSFAC match score, 0.72; Figure 1G). In addition, by reference to the ChIP‐Atlas database (http://chip-atlas.org), we also found binding of p53 to the same region in various cell lines having functional p53 (SJSA‐1, MCF‐7, HCT116 and keratinocytes, and Saos2 cells transfected with WT p53) under various conditions (Figure S2). In SJSA‐1 cells and keratinocytes, binding of p53 was strengthened by several p53‐activating agents such as Nutlin, doxorubicin, and cisplatin. We also undertook Hi‐C analysis of the PHLDA1 genomic region to identify the 3D architecture of the PHLDA1 genomic locus. As shown in Figure S3, both sites were located within the same topologically associated domain that have been proposed to represent regulatory units within which enhancers and promoters can interact. We further analyzed the expression of PHLDA1 in cancers expressing WT or mutant p53. As shown in Figure 1H,I, PHLDA1 expression was significantly decreased in the CCLE cancer cell lines and in ovarian cancers carrying a mutant p53 compared to those with WT p53, supporting the idea that PHLDA1 expression depends on p53. These data collectively indicate that PHLDA1 is a p53 target gene.
3.2. PHLDA1 gene encodes a long and a short isoform of PHLDA1
According to the UCSC genome database, the murine and human PHLDA1 genes encode proteins of 405 and 401 amino acids, respectively (Figure 2A,B). We expressed PHLDA1 (PHLDA1‐long) in cells and interestingly found that, although the calculated molecular weight of PHLDA1 protein is 45 kDa, the expressed PHLDA1‐long protein appeared at ~52 kDa (Figure 2C). In addition, we found that the endogenous PHLDA1 protein is much smaller, with a size of approximately 38 kDa (Figures 2C and S4). We also noticed that the majority of the expressed sequence tags (ESTs) found in the database start downstream of the region that encodes the first initiation methionine. For example, in mouse, only 3 ESTs are found that start before the first methionine, whereas more than 50 ESTs start between the first and second methionine in human. We therefore undertook a genome‐wide analysis of TSS, and found that the major TSS of PHLDA1 in HCT116 cells is from chr12: 74711640, which is downstream of the first methionine and upstream of the second methionine (Figure 2D). This result was further confirmed using DBTSS and FANTOM5 SSTAR, databases of TSS (http://dbtss.hgc.jp and http://fantom.gsc.riken.jp/5/sstar/Main_Page); in a majority of the cell lines and tissues examined, the TSS was located at chr12: 74711640. We next made a PHLDA1 expression plasmid that starts from the second methionine (PHLDA1‐short, Figure 2A,B) and expressed it in cells. As shown in Figure 2C, the calculated molecular weight of the PHLDA1‐short protein is 30 kDa, the expressed PHLDA1‐short protein appeared at ~38 kDa, and the size of the PHLDA1‐short exactly matched the size of the endogenous PHLDA1 protein. We therefore conclude that majority of PHLDA1 expressed in cell lines are the PHLDA1‐short form. We also noticed that the PHLDA1‐short form is expressed from the PHLDA1‐long expression plasmid, suggesting the existence of an internal ribosome entry site between the first and second methionine.
Figure 2.

PHLDA1 (pleckstrin homology‐like domain family, member 1) gene encodes long and short isoforms of PHLDA1 protein. A, Human and mouse PHLDA1 encodes long and short forms of the PHLDA1 protein. The initiation methionine of each isoform is indicated by a red arrow. The PH domain is shown by a yellow box. Seven β sheets and an α helix of the PH domain are shown by blue and red lines, respectively. B, Structure of the long and short forms of the PHLDA1 protein together with PHLDA3 protein. C, Short form of PHLDA1 protein is predominantly expressed in human cells. Whole cell extracts were obtained from the indicated cell lines and analyzed by western blotting. 293T cells were transfected with empty pcDNA3 (EV), or vectors expressing the short or long form of PHLDA1. ACHN cells were transfected with control or siPHLDA1. The amount of cell lysates subjected to western blotting was adjusted so that the amount of PHLDA1‐ long, ‐short, or endogenous PHLDA1 was similar between the samples. D, Transcriptional start site analysis revealed that the major transcriptional start site of the PHLDA1 gene is from chr12: 74711640. Transcriptional start site sequencing (TSS‐seq) and total RNA‐seq data obtained for both the forward and reverse strands are shown. The genomic sequences around the PHLDA1 gene are unique within the human genome (mappability score = 1.0). The resulting sequences were mapped to the build #36 reference human genome (hg18)
3.3. Split PH domain in PHLDA1 that functions in membrane localization and PIP binding
As shown in Figure 2A,B, the PHLDA1‐short protein translation start is located just before the PH domain. The PH domain of PHLDA1 is a so‐called split PH domain in which the PH domain is divided into N‐terminal (β sheets 1‐3) and C‐terminal (β sheets 4‐7 and an α helix) portions. The PH domain of PHLDA1 shows high similarity to those of other PHLDA family proteins and shows highest similarity to the PH domain of PHLDA3 (Figure 3A). An especially high similarity between the PH domain of PHLDA1 and PHLDA3 was found among the amino acids shown to be involved in PIP binding (Figure 3A, amino acids shown in red). We and others have previously shown that PHLDA3 localizes to the plasma membrane through its PH domain, which mediates binding to PIPs.2, 23 We therefore analyzed the subcellular localization of the PHLDA1‐long, PHLDA1‐short, and mutants having deletions of the amino acids involved in PIP binding (Figure 3A, amino acids shown in brackets were deleted). As has been reported previously, PHLDA3 localized to the plasma membrane under both serum‐starved and EGF‐stimulated conditions, but localization was stronger and more frequent under EGF‐stimulated conditions, presumably because EGF stimulation promotes the generation of PIP3 (Figure 3B,C). Likewise, both PHLDA1‐long and PHLDA1‐short localized to the plasma membrane at a frequency similar to that seen with PHLDA3. In addition, when amino acids presumed to directly associate with PIPs were deleted, plasma membrane localization was almost completely lost (Figure 3B,C). We then analyzed the ability of PHLDA1 to bind to PIPs by performing an in vitro protein‐lipid overlay assay, using a membrane spotted with concentration gradients of all eight PIPs. As shown in Figure 3D, the PH domain of PHLDA1 has the ability to bind to all eight PIPs, with a particularly high affinity for PI(3,5)P2 and PIP3. We further analyzed the ability of PHLDA1 to bind to PIP3 using PIP3‐coated beads. As shown in Figure S5, purified PHLDA1 was observed to bind to these coated beads. Collectively, these results show that the PH domain of PHLDA1 has the ability to bind to PIPs and thereby localize to the plasma membrane.
Figure 3.

PH domain of pleckstrin homology‐like domain family, member 1 (PHLDA1) can bind phosphatidylinositols (PIPs). A, PHLDA1 has a split PH domain that shares a high homology with the PH domain of PHLDA3. Amino acids making contact with the phosphate groups of PIPs are shown in red.23 Amino acids within the β1 and β2 strands that were deleted in the PHLDA1 deletion mutants are shown in brackets. B, Subcellular localization of PHLDA1 in COS‐7 cells with or without EGF treatment. COS‐7 cells were transfected with the indicated constructs, and subcellular localization was analyzed 24 hours post‐transfection. Intensities of EGFP on the yellow lines in EGF‐treated cells were quantified and shown at the bottom. C, Subcellular localizations of PHLDA1 proteins in cells were quantified by immunofluorescence microscopy. The cells were scored as positive for plasma membrane localization when cells showed a stronger signal at the plasma membrane compared to the cytoplasm. The percentages of cells showing plasma membrane localization were calculated using 50 cells. Numbers of cells localized to the plasma membrane are shown at the top of the bars. D, Protein‐lipid overlay assay was carried out. PHLDA1 bound to various phospholipids. Binding to the PIPs was assessed using anti‐PHLDA1 antibodies
3.4. Pleckstrin homology‐like domain A1 is a novel repressor of Akt
As PHLDA1 localizes to the plasma membrane and has the ability to bind PIPs, we next analyzed whether PHLDA1 has the ability to repress Akt, similar to other PHLDA family members. We expressed PHLDA1‐long and PHLDA1‐short in COS‐7 cells and treated these cells with EGF. Both PHLDA1‐long and PHLDA1‐short efficiently repressed Akt activation induced by EGF (Figures 4A,B and S6), whereas the mutant PHLDA1‐long and PHLDA1‐short forms were unable to do so (Figure 4A,B). Thus, plasma membrane localization and PIP binding are essential for Akt repression by both PHLDA1‐long and PHLDA1‐short. We further knocked down endogenous PHLDA1 in MDA‐MB‐468 cells, HCC38 cells, HCT116 p53+/+ cells or MCF7 cells and analyzed the effect on Akt activation. As shown in Figure 4C‐F, ablation of endogenous PHLDA1 resulted in enhanced Akt activation in cell lines having either mutant (MDA‐MB‐468 and HCC38) or WT p53 (HCT116 p53+/+ and MCF7).
Figure 4.
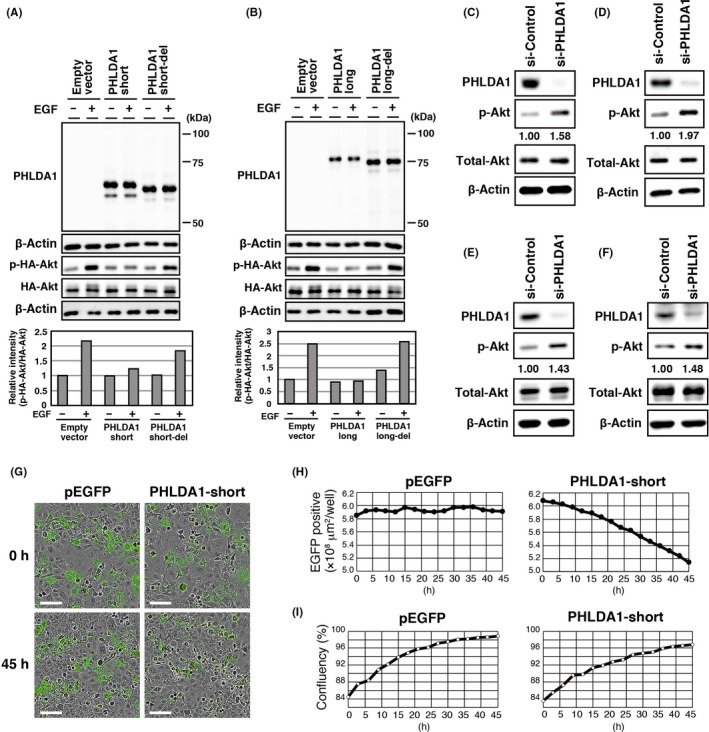
Pleckstrin homology‐like domain family, member 1 (PHLDA1) has an ability to repress Akt. A, B, COS‐7 cells were transfected with vectors expressing EGFP fusion WT or mutant PHLDA1‐short (A) and long (B) isoforms, together with a vector expressing HA‐tagged Akt, and treated with 100 ng/mL EGF for 15 minutes. Protein expression was assessed by western blotting analysis using anti‐Akt, anti‐phospho‐Akt S473, anti‐PHLDA1 and anti‐β‐actin antibodies. C‐F, Control or PHLDA1‐targeting siRNAs were introduced into MDA‐MB‐468 (p53 WT, PTEN deficient) (C), HCC38 (p53 WT, PTEN deficient) (D), HCT116 p53+/+ (p53 WT, PTEN mutant) (E), or MCF7 cells (p53 WT, PTEN WT) (F). Cells were harvested 48 hours (HCC38, HCT116 p53+/+, and MCF7 cells) and 72 hours (MDA‐MB‐468 cells) post‐transfection and analyzed by western blotting using antibodies against PHLDA1, total Akt, phospho‐Akt, or β‐actin. G‐I, COS‐7 cells were transfected with control EGFP‐C1 or PHLDA1‐short‐EGFP, respectively. Phase contrast and green images were taken and manipulated with an IncuCyte imager system. Scale bar = 100 μm (G). EGF‐positive area was quantified based on the green images (H) and confluency was determined using phase contrast images (I). Images were taken in succession over 45 hours with an IncuCyte imager
We further analyzed the effect of PHLDA1 expression on cell proliferation. We expressed the EGFP‐PHLDA1‐short construct or the control EGFP in COS‐7 cells and assessed the number of EGFP‐positive cells by their area. The area of cells expressing the PHLDA1‐short protein decreased over time, suggesting that overexpression of PHLDA1 leads to the inhibition of cell growth and/or cell death (Figure 4G‐I). Thus, PHLDA1 contributes to repression of Akt kinase activity and oncogenic functions (ie, cell survival and proliferation).
3.5. Expression of PHLDA1 in cancers and adult mice organs
We next analyzed the involvement of PHLDA1 in tumor suppression. As shown in Figure S7, 62 out of 401 amino acids of PHLDA1 were found to have undergone mutation in various human cancers recorded in the TCGA database. Among the amino acids mutated, several are frameshift (n = 7) or nonsense mutations (n = 1). Furthermore, 43 of the mutated amino acids are conserved between human and mouse PHLDA1. Interestingly, 32 out of 62 the amino acids that underwent mutations are located within the PH domain, and 16 of these are amino acids that are conserved between PHLDA1 and PHLDA3. These amino acids that undergo mutation and are conserved between the PHLDA family genes could be important for the function of the PH domain of this family.
As shown in Figure 5, PHLDA1 mRNA expression was significantly low in breast and ovarian cancer tissues compared to normal tissues (Figure 5A,C). In addition, search of a publicly available cancer microarray database (PrognoScan; http://dna00.bio.kyutech.ac.jp/PrognoScan/) revealed that lower PHLDA1 mRNA expression is associated with poorer prognosis in breast and ovarian cancer patients (Figure 5B,D). Collectively these data suggest that the PHLDA1 gene might have a tumor suppressor function in several cancers. Interestingly, we also found that there is a slight positive correlation between PHLDA1 and PHLDA3 expression in CCLE cancer cell lines, indicating that they might share the same upstream regulators (Figure S8A). Expression of both PHLDA1 and PHLDA3 is significantly higher in p53 WT CCLE cell lines compared to p53 mutant CCLE cell lines (Figures 1H and S8B), indicating that at least one of the upstream regulators shared by PHLDA1 and PHLDA3 is p53.
Figure 5.

PHLDA1 (pleckstrin homology‐like domain family, member 1) expression in cancers and in normal organs. A, C, Expression of PHLDA1 in normal breast and breast cancers (lobular and ductal) (A) or in normal ovary and ovarian cancers (clear cell and papillary) (C). Analyzed using the Sciantis database (http://www.ocimumbio.com/sciantis/). ***P < 0.001, calculated by a two‐tailed Student's t test. B, D, Expression of PHLDA1 and prognosis of cancer patients. Disease‐specific survival of patients with breast cancer (transitional cell carcinoma, dataset GSE13507) or ovarian cancer (transitional cell carcinoma, dataset GSE13507) was analyzed using the PrognoScan database (http://dna00.bio.kyutech.ac.jp/PrognoScan/). *P < 0.05 and ***P < 0.005, calculated by a two‐tailed Student's t test. E, F. Expression of Phlda1 (E) and Phlda3 (F) in mouse adult organs. Total RNAs were purified from the indicated organs obtained from 8‐ to 20‐week‐old mice. Expression of Phlda1 and Phlda3 mRNA was first analyzed by absolute quantification and then normalized against 18S rRNA levels to adjust the amount of RNA used for the analysis (18S rRNA level in mouse embyonic fibroblasts was set to 1). The amounts of Phlda1 and Phlda3 mRNA molecules in mouse embyonic fibroblasts were 2080 and 6213 per 1 ng RNA, respectively. Results were obtained from 3 mice (2 male and 1 female mouse) and shown as mean ± SEM
We also analyzed Phlda1 and Phlda3 mRNA expression levels in various adult mice organs (Figure 5E,F). Expression of Phlda1 is high in organs such as liver, salivary gland, stomach, heart, and bladder, whereas Phlda3 expression is high in fat, muscle, bladder, lung, cerebrum, cerebellum, and heart (these organs have more than 1500 Phlda1 or Phlda3 mRNA molecules per 1 ng total RNA). High expression of both Phlda1 and Phlda3 was observed in organs such as bladder and heart. Although there was no significant negative correlation between their expression levels (Spearman's correlation, r = 0.079), Phlda1 and Phlda3 were observed to be expressed differently in various tissues. For example, in skeletal muscles, 16 515 molecules of Phlda3 are expressed per 1 ng total RNA, whereas Phlda1 expression is only 196 molecules. It is possible that loss of Phlda1 or Phlda3 expression has different consequences in various organs. As there is an overlapping function between PHLDA1 and PHLDA3, it will be important in the future to obtain and analyze mice doubly deficient for these genes in order to clarify the function of these PHLDA family genes.
4. DISCUSSION
The role of PHLDA1 in cancer has been suggested in a number of recent reports. Reduced expression of PHLDA1 has been reported in melanoma, breast cancer, oral cancer, and stomach cancers.13, 14, 15, 16, 17, 18 In addition, expression of PHLDA1 was associated with various tumor‐suppressive effects such as reduced cell growth and colony formation, increased apoptosis, and/or reduced migration.10, 11, 12, 13 However, the precise molecular mechanisms by which PHLDA1 suppresses tumors have not been fully elucidated.
Here, we report that the PHLDA1 gene is a p53 target gene and that the short isoform starting from the second methionine encoded in the PHLDA1 gene is mainly expressed due to the usage of the transcriptional start site after the first methionine. According to databases such as the UCSC genome browser, the PHLDA1 gene encodes a protein of 401 amino acids. However, our analysis of more than 10 cancer cell lines showed that the majority of the PHLDA1 expressed in these cell lines was the short isoform of 260 amino acids. Although we could not find any differences between the long and the short isoforms in their plasma membrane localization or ability to repress Akt, we believe it will be very important to distinguish these isoforms in future functional assays.
We showed that the PH domain of PHLDA1 has the ability to bind PIPs and localize to the plasma membrane. Furthermore, overexpression and knockdown of PHLDA1 resulted in reduced and enhanced Akt activation, respectively. We also showed that PHLDA1 expression inhibited cell growth and/or induced cell death. These data show that PHLDA1 function overlaps with that of other PHLDA family proteins in its ability to repress Akt. We also observed that expression of PHLDA1 is reduced in breast and ovarian cancer and that low expression of PHLDA1 is associated with poorer prognosis of these cancer patients. We have also shown that reduced expression of PHLDA1 causes hyperactivation of Akt in breast cancer cell lines (Figure 4C,D,F). These results suggest that PHLDA1 has a tumor‐suppressive ability in these cancers. Our data suggest that at least one of the mechanisms of tumor suppression by PHLDA1 involves Akt repression.
We also analyzed the absolute expression levels of Phlda1 and Phlda3. Phlda1 is expressed in various adult mice organs and shows a different expression pattern to that of Phlda3. As there are overlapping functions between PHLDA1 and PHLDA3, it is important to determine the function of each gene in individual organs. In addition, the differential expression patterns of Phlda1 and Phlda3 could explain in part the involvement of these genes in different types of cancers. There is accumulating evidence for the involvement of PHLDA family genes in the regulation of Akt repression. Analysis of the effect of each family gene on Akt regulation and tumorigenesis in various organs, together with analysis of doubly and triply deficient mice, might further clarify the importance of the PHLDA family genes in tumor suppression.
CONFLICT OF INTEREST
The authors have no financial relationships to disclose.
Supporting information
ACKNOWLEDGMENTS
We thank Marc Lamphier for critical reading of the manuscript. This study was partly supported by a Grant‐in‐Aid for Scientific Research (B) (#17H03587) (R.O.), Grant‐in‐Aid for Research Activity start‐up (#17H07378) (M.T.), and Grant‐in‐Aid for Young Scientist (B) (#15K19537) (Y.Y.) from the Ministry of Education, Culture, Sports, Science and Technology of Japan, Applied Research for Innovative Treatment of Cancer from the Ministry of Health, Labour and Welfare (R.O.), Development of Innovative Research on Cancer Therapeutics (P‐DIRECT)/Ministry of Education, Culture, Sports, Science and Technology of Japan (R.O.), research grants from Research Grant of the Princess Takamatsu Cancer Research Fund (R.O.), the Mitsubishi Foundation (to R.O.), the Novartis Foundation (Japan) for the Promotion of Science (to R.O.), the Project Mirai Cancer Research Grants (R.O.), the Okinaka Memorial Institute for Medical Research (to R.O.), the National Cancer Center Research and Development Fund (to R.O., 29‐E‐2), the Life Science Foundation of Japan (to R.O.), and Foundation for Promotion of Cancer Research in Japan (to R.O.).
Chen Y, Takikawa M, Tsutsumi S, et al. PHLDA1, another PHLDA family protein that inhibits Akt. Cancer Sci. 2018;109:3532–3542. 10.1111/cas.13796
Yu Chen and Masahiro Takikawa contributed equally to this work.
REFERENCES
- 1. Frank D, Mendelsohn CL, Ciccone E, Svensson K, Ohlsson R, Tycko B. A novel pleckstrin homology‐related gene family defined by Ipl/Tssc3, TDAG51, and Tih1: tissue‐specific expression, chromosomal location, and parental imprinting. Mamm Genome. 1999;10:1150‐1159. [DOI] [PubMed] [Google Scholar]
- 2. Kawase T, Ohki R, Shibata T, et al. PH domain‐only protein PHLDA3 is a p53‐regulated repressor of Akt. Cell. 2009;136:535‐550. [DOI] [PubMed] [Google Scholar]
- 3. Wang X, Li G, Koul S, et al. PHLDA2 is a key oncogene‐induced negative feedback inhibitor of EGFR/ErbB2 signaling via interference with AKT signaling. Oncotarget. 2015;. https://doi.org/10.18632/oncotarget.3674. [DOI] [PMC free article] [PubMed] [Google Scholar]
- 4. Takikawa M, Ohki R. A vicious partnership between AKT and PHLDA3 to facilitate neuroendocrine tumors. Cancer Sci. 2017;108:1101‐1108. [DOI] [PMC free article] [PubMed] [Google Scholar]
- 5. Ohki R, Saito K, Chen Y, et al. PHLDA3 is a novel tumor suppressor of pancreatic neuroendocrine tumors. Proc Natl Acad Sci U S A. 2014;111:E2404‐E2413. [DOI] [PMC free article] [PubMed] [Google Scholar]
- 6. Muroi H, Nakajima M, Satomura H, et al. Low PHLDA3 expression in oesophageal squamous cell carcinomas is associated with poor prognosis. Anticancer Res. 2015;35:949‐954. [PubMed] [Google Scholar]
- 7. Brady CA, Jiang D, Mello SS, et al. Distinct p53 transcriptional programs dictate acute DNA‐damage responses and tumor suppression. Cell. 2011;145:571‐583. [DOI] [PMC free article] [PubMed] [Google Scholar]
- 8. Salas M, John R, Saxena A, et al. Placental growth retardation due to loss of imprinting of Phlda2. Mech Dev. 2004;121:1199‐1210. [DOI] [PubMed] [Google Scholar]
- 9. Frank D, Fortino W, Clark L, et al. Placental overgrowth in mice lacking the imprinted gene Ipl. Proc Natl Acad Sci U S A. 2002;99:7490‐7495. [DOI] [PMC free article] [PubMed] [Google Scholar]
- 10. Park CG, Lee SY, Kandala G, Choi Y. A novel gene product that couples TCR signaling to Fas(CD95) expression in activation‐induced cell death. Immunity. 1996;4:583‐591. [DOI] [PubMed] [Google Scholar]
- 11. Gomes I, Xiong W, Miki T, Rosner MR. A proline‐ and glutamine‐rich protein promotes apoptosis in neuronal cells. J Neurochem. 1999;73:612‐622. [DOI] [PubMed] [Google Scholar]
- 12. Hossain GS, van Thienen JV, Werstuck GH, et al. TDAG51 is induced by homocysteine, promotes detachment‐mediated programmed cell death, and contributes to the development of atherosclerosis in hyperhomocysteinemia. J Biol Chem. 2003;278:30317‐30327. [DOI] [PubMed] [Google Scholar]
- 13. Neef R, Kuske MA, Pröls E, Johnson JP. Identification of the human PHLDA1/TDAG51 gene: down‐regulation in metastatic melanoma contributes to apoptosis resistance and growth deregulation. Cancer Res. 2002;62:5920‐5929. [PubMed] [Google Scholar]
- 14. Nagai MA, Fregnani JH, Netto MM, Brentani MM, Soares FA. Down‐regulation of PHLDA1 gene expression is associated with breast cancer progression. Breast Cancer Res Treat. 2007;106:49‐56. [DOI] [PubMed] [Google Scholar]
- 15. Coutinho‐Camillo CM, Lourenço SV, Nonogaki S, et al. Expression of PAR‐4 and PHLDA1 is prognostic for overall and disease‐free survival in oral squamous cell carcinomas. Virchows Arch. 2013;463:31‐39. [DOI] [PubMed] [Google Scholar]
- 16. Zhao P, Lu Y, Liu L. Correlation of decreased expression of PHLDA1 protein with malignant phenotype of gastric adenocarcinoma. Int J Clin Exp Pathol. 2015;8:5230‐5235. [PMC free article] [PubMed] [Google Scholar]
- 17. Zhao PO, Li X, Lu Y, Liu L. Downregulated expression of PHLDA1 protein is associated with a malignant phenotype of cholangiocarcinoma. Oncol Lett. 2015;10:895‐900. [DOI] [PMC free article] [PubMed] [Google Scholar]
- 18. Johnson EO, Chang KH, de Pablo Y, et al. PHLDA1 is a crucial negative regulator and effector of Aurora A kinase in breast cancer. J Cell Sci. 2011;124:2711‐2722. [DOI] [PubMed] [Google Scholar]
- 19. Li G, Wang X, Hibshoosh H, Jin C, Halmos B. Modulation of ErbB2 blockade in ErbB2‐positive cancers: the role of ErbB2 Mutations and PHLDA1. PLoS ONE. 2014;9:e106349. [DOI] [PMC free article] [PubMed] [Google Scholar]
- 20. Fearon AE, Carter EP, Clayton NS, et al. PHLDA1 mediates drug resistance in receptor tyrosine kinase‐driven cancer. Cell Rep. 2018;22:2469‐2481. [DOI] [PMC free article] [PubMed] [Google Scholar]
- 21. Nagai MA. Pleckstrin homology‐like domain, family A, member 1 (PHLDA1) and cancer. Biomed Rep. 2016;4:275‐281. [DOI] [PMC free article] [PubMed] [Google Scholar]
- 22. Yan J, Wen W, Xu W, et al. Structure of the split PH domain and distinct lipid‐binding properties of the PH‐PDZ supramodule of alpha‐syntrophin. EMBO J. 2005;24:3985‐3995. [DOI] [PMC free article] [PubMed] [Google Scholar]
- 23. Saxena A, Morozov P, Frank D, et al. Phosphoinositide binding by the pleckstrin homology domains of Ipl and Tih1. J Biol Chem. 2002;277:49935‐49944. [DOI] [PubMed] [Google Scholar]
- 24. Ohki R, Kawase T, Ohta T, Ichikawa H, Taya Y. Dissecting functional roles of p53 N‐terminal transactivation domains by microarray expression analysis. Cancer Sci. 2007;98:189‐200. [DOI] [PMC free article] [PubMed] [Google Scholar] [Retracted]
- 25. Asano Y, Kawase T, Okabe A, et al. IER5 generates a novel hypo‐phosphorylated active form of HSF1 and contributes to tumorigenesis. Sci Rep. 2016;6:19174. [DOI] [PMC free article] [PubMed] [Google Scholar]
- 26. Kaneshiro K, Tsutsumi S, Tsuji S, Shirahige K, Aburatani H. An integrated map of p53‐binding sites and histone modification in the human ENCODE regions. Genomics. 2007;89:178‐188. [DOI] [PubMed] [Google Scholar]
- 27. Tsuchihara K, Suzuki Y, Wakaguri H, et al. Massive transcriptional start site analysis of human genes in hypoxia cells. Nucleic Acids Res. 2009;37:2249‐2263. [DOI] [PMC free article] [PubMed] [Google Scholar]
- 28. Kavran JM, Klein DE, Lee A, et al. Specificity and promiscuity in phosphoinositide binding by pleckstrin homology domains. J Biol Chem. 1998;273:30497‐30508. [DOI] [PubMed] [Google Scholar]
Associated Data
This section collects any data citations, data availability statements, or supplementary materials included in this article.
Supplementary Materials