

Abstract
Aims/Introduction
Pancreatic α‐cell area and the α‐ to β‐cell area ratio (α/β) might be associated with glucose tolerance. The aim was to clarify how these histological parameters change as glucose tolerance deteriorates.
Materials and Methods
We analyzed pancreatic tissues obtained from pancreatectomies of 43 patients. We evaluated the relationships between α‐cell area or the α/β and various clinical parameters. Additionally, we analyzed α‐cell proliferation and the expression patterns of various pancreatic transcription factors.
Results
The α/β in individuals with longstanding (previously diagnosed) type 2 diabetes (0.36 ± 0.12) was higher than that in those with normal glucose tolerance (0.18 ± 0.10; P < 0.01), impaired glucose tolerance (0.17 ± 0.12; P < 0.05) and newly diagnosed diabetes (0.17 ± 0.12; P < 0.05). In all participants, glycated hemoglobin (HbA1c) correlated with relative α‐cell area (P = 0.010). Diabetes duration (P = 0.004), HbA1c (P < 0.001) and plasma glucose levels (P = 0.008) were significantly correlated with the α/β in single regression analyses, and diabetes duration was the only independent and significant determinant in stepwise multiple regression analyses (P = 0.006). The α‐cell Ki67‐positive ratio in patients with HbA1c ≥6.5% was significantly higher than that in patients with HbA1c <6.5% (P = 0.022). We identified β‐cells that expressed aristaless‐related homeobox and α‐cells that did not express aristaless‐related homeobox at all glucose tolerance stages. Aristaless‐related homeobox and NK homeobox 6.1 expression patterns varied in insulin and glucagon double‐positive cells.
Conclusions
The pancreatic α/β increases after type 2 diabetes onset and correlates with diabetes duration. This change might occur through α‐cell proliferation and phenotypic changes in pancreatic endocrine cells.
Keywords: Aristaless‐related homeobox, α‐Cell mass, α‐Cell proliferation
Introduction
Diabetes is regarded as a bi‐hormonal disorder in which patients show either relative or absolute insulin secretion deficiency and relative or absolute excess glucagon secretion1. Glucagon plays an important role in maintaining glucose homeostasis through its regulatory effect on hepatic glucose production2. Although glucagon secretion is suppressed by carbohydrate loading in healthy individuals, this is not always the case in type 2 diabetes3.
Glucagon is secreted from the pancreatic α‐cell, which is one of the cell types that comprise the pancreatic islet. In humans, it is controversial as to whether α‐cell mass changes as glucose intolerance proceeds. Some studies have reported that α‐cell mass was increased in patients with type 2 diabetes4, 5, whereas others have concluded that there was no significant difference in α‐cell mass between patients with type 2 diabetes and non‐diabetic individuals6, 7, 8. There is a consensus that the α‐ to β‐cell area ratio (α/β) in the pancreatic parenchyma and the α‐cell area ratio in islets increase in type 2 diabetes5, 7, 9, but the time‐course, the mechanisms underlying these histological changes and the type of factors affecting these changes have not been elucidated.
In humans, β‐cell mass decreases during the progression of glucose intolerance, which is thought to be primarily the result of altered β‐cell proliferation10 and apoptosis11, 12. In addition, transdifferentiation and dedifferentiation in pancreatic endocrine cells might also contribute to this histological change. A number of studies have reported transdifferentiation not only from α‐ to β‐cells13, but also from β‐ to α‐cells14, 15, 16. Dedifferentiation of β‐cells and conversion to other endocrine cell types in forkhead box protein O1 knock‐out mice14 and the conversion from β‐ to α‐cells in isolated human islets have been observed15. However, transdifferentiation and dedifferentiation have not been confirmed in vivo in humans.
Human islet histological analysis has been primarily carried out using autopsy samples4, 6, 7 or samples obtained from pancreatectomy. Using autopsy samples, whole pancreatic tissue can be examined, whereas only part of the pancreas can be examined using operative samples. Additionally, the latter approach cannot exclude effects of various factors originating from primary diseases, such as inflammation. However, the latter approach has some advantages. It enables us to collect clinical characteristics of patients in detail11, 17, and obtain fresh tissue with which we can carry out precise examination of Ki67 staining18.
In the present study, we analyzed human pancreatic tissues obtained from pancreatectomies in patients at various glucose tolerance stages. We evaluated the relationships between α‐cell area or the α/β and various clinical parameters. Additionally, we analyzed α‐cell proliferation and apoptosis. Furthermore, we assessed the expression patterns of various transcription factors that are crucial for pancreatic endocrine cell development, particularly aristaless‐related homeobox (ARX), an α‐cell transcription factor19, 20, to detect the possibility of transdifferentiation and dedifferentiation in human pancreas.
Methods
Patients
We enrolled 43 Japanese patients (25 men and 18 women) who had undergone pancreatic resection between 2008 and 2013 in the Department of Gastroenterological Surgery, Osaka University Hospital, Suita, Japan, and had agreed to participate in this study. The study protocol was approved by the ethics committee of Osaka University (approval number 13279‐4), and was carried out in accordance with the Declaration of Helsinki. Informed consent was obtained from all patients. Diabetes patients treated with dipeptidyl peptidase‐4 inhibitors or glucagon‐like peptide‐1 receptor agonists, patients with renal failure (estimated glomerular filtration rate <30 mL/min/1.73 m2) and patients with pancreatic endocrine tumors were excluded from this study. The flow chart of the patients’ disposition is shown in Figure S1. The mean age was 66 ± 11 years, and the mean body mass index (BMI) was 21.5 ± 2.8 kg/m2. A total of 33 patients underwent a 75‐g oral glucose tolerance test (OGTT) 1–60 days before pancreatic resection. Glucose tolerance stages (normal glucose tolerance [NGT], impaired glucose tolerance [IGT] and newly diagnosed diabetes [new‐diabetes]) were categorized based on the results of the test. One patient was diagnosed with new diabetes without the 75‐g OGTT based on his fasting plasma glucose level and glycated hemoglobin (HbA1c). A total of 10 patients were diagnosed with longstanding type 2 diabetes (long‐type 2 diabetes) because of their clinical history.
Laboratory tests
Preoperative insulin secretory capacity was evaluated by homeostatic model assessment for β‐cell function (HOMA‐β)21, C‐peptide index22 and insulinogenic index23. Insulin resistance was evaluated by HOMA for insulin resistance (HOMA‐R)21, and insulin sensitivity was evaluated by the Matsuda index24. These values, as well as fasting plasma glucose levels, were determined using the data obtained from preoperative 75‐g OGTT. In patients who did not undergo 75‐g OGTT, these laboratory data, except insulinogenic index and Matsuda index were also measured 1–60 days before pancreatic resection. Additionally, HbA1c was measured 1–60 days before pancreatic resection.
Pancreatic tissue processing
We obtained pancreas head tissue samples from patients who had undergone pancreatoduodenectomy, and pancreas body or tail tissue samples from patients who had undergone distal pancreatectomy. The pancreatic tissue sample region could not be determined in one patient who had undergone total pancreatectomy. Pancreatic samples were collected during the operation. The tissues were isolated from near the resected margins after intraoperative consultation, fixed immediately in formaldehyde and embedded in paraffin for subsequent analysis. Paraffin‐embedded tissue was cut into 5‐μm thick sections. We confirmed suitability of our samples by rejecting inflammation and cancer elements by hematoxylin–eosin staining and fibrosis changes from pancreatitis originating from pancreas disease by AZAN staining. Sections with >30% fibrous area estimated by AZAN staining were excluded from the present study17.
Immunohistochemistry
The primary and secondary antibodies and chromogenic substrates used in the present study are listed in Table S1. We used an anti‐ARX antibody from Dr Patrick Collombat for immunostaining.
As a surrogate for α‐cell mass, we evaluated relative α‐cell area, which was determined by the proportion of glucagon‐positive cell area in the whole pancreatic section (%; Figure S2a). We also evaluated relative β‐cell area (Figure S2b) and calculated the α/β. Pancreatic sections were stained using the indirect immunoperoxidase technique to measure relative α‐ and β‐cell areas. We used antiglucagon and anti‐insulin immunoglobulins (Igs) as primary antibodies and biotinylated Igs as secondary antibodies. The reactions were developed with an avidin–biotin complex and a 3,3‐diaminobenzidine tetrahydrochloride substrate, followed by methyl green counterstaining.
To evaluate the extent of replication and apoptosis, we carried out double immunofluorescent staining for glucagon or insulin and Ki67 (Figure S3), and for glucagon or insulin and cleaved caspase 3 (cCAS3), respectively. Pancreatic sections were incubated with anti‐Ki67 or cCAS3 Igs as primary antibodies and biotinylated Igs as secondary antibodies, followed by fluorescein isothiocyanate‐conjugated avidin D. Sections were then incubated with antiglucagon or insulin Igs, followed by rhodamine‐conjugated Igs.
To evaluate the ratio of immature endocrine cells, we carried out double immunofluorescent staining for insulin and glucagon. The sections were stained with anti‐insulin Igs followed by rhodamine‐conjugated Igs, and then stained with anti‐glucagon Igs followed by Alexa Fluor 488‐conjugated Igs.
To evaluate the endocrine cell characteristics, we carried out triple immunostaining for insulin, glucagon and ARX or NK homeobox 6.1 (NKX6.1) with a pair of mirror sections. First, the sections were incubated with anti‐ARX or anti‐NKX6.1 Igs as primary antibodies and biotinylated Igs as secondary antibodies, and then the reactions were developed with an avidin–biotin complex and a 3,3‐diaminobenzidine tetrahydrochloride substrate. Next, the sections were stained with anti‐insulin Igs followed by rhodamine‐conjugated Igs, and then stained with antiglucagon Igs followed by Alexa Fluor 488‐conjugated Igs. We also carried out triple immunostaining for insulin, glucagon and pancreas duodenal homeobox gene 1 (PDX‐1). The sections were incubated with anti‐PDX‐1 Igs as primary antibodies and biotinylated Igs as secondary antibodies, and then the reactions were developed with an avidin–biotin complex and a 3,3‐diaminobenzidine tetrahydrochloride substrate. Next, the sections were stained with anti‐insulin Igs followed by Alexa Fluor 594‐conjugated Igs, and then stained with antiglucagon Igs followed by Alexa Fluor 488‐conjugated Igs.
Morphometric analysis
Immunohistochemical analyses were carried out on one section per patient. The mean area of the sections used to determine the relative α‐cell area was 18.2 mm2 (standard deviation 11.1 mm2). Glucagon or insulin‐positive cell area in the entire pancreatic section was quantified digitally with the WinROOF software program (Mitani Corporation, Fukui, Japan)13, 19. We analyzed a median of 469 (interquartile range [IQR] 443) glucagon‐positive cells to evaluate the Ki67‐positive ratio (the percentage of glucagon and Ki67 double‐positive cells in total glucagon‐positive cells). Additionally, we analyzed 735 (IQR 717) glucagon‐positive cells to evaluate the cCAS3‐positive ratio (the percentage of glucagon and cCAS3 double‐positive cells in total glucagon‐positive cells). Finally, we analyzed 441 (IQR 378) glucagon‐positive cells to evaluate the insulin and glucagon double‐positive (INS+GCG+) ratio (the percentage of INS+GCG+ cells in total glucagon‐positive cells).
Statistical analysis
Normally distributed data are presented as the mean ± standard deviation, and non‐normally distributed data are presented as the medians and IQR. Normally distributed data were compared by one‐way analysis of variance followed by a post‐hoc Tukey–Kramer analysis (three or more groups) or Student's t‐test (two groups). Non‐normally distributed data were compared using the Kruskal–Wallis test followed by a post‐hoc Steel–Dwass analysis (three or more groups) or the Wilcoxon test (two groups). Single regression and stepwise multiple regression analyses were carried out to identify explanatory variables for relative α‐cell area, the α/β and the Ki67‐positive ratio. P‐values <0.05 denoted the presence of a statistically significant difference. All statistical analyses were carried out with the JMP Pro 10.0.2 software program (Statistical Analysis System Inc., Cary, NC, USA).
Results
Clinical characteristics, laboratory data, relative α‐cell area and the α/β
Table 1 lists the clinical characteristics of the patients. The average age was 66 ± 11 years, and the average BMI was 21.4 ± 2.9 kg/m2. Patients were diagnosed as NGT (n = 14), IGT (n = 10), new‐diabetes (n = 9) or long‐type 2 diabetes (n = 10). Primary diseases were mainly pancreatic cancer (n = 17) and cystic lesions of the pancreas (n = 14), including intraductal papillary mucinous neoplasm, mucinous cystic neoplasm and simple cyst. Other diseases included cholangiocarcinoma (n = 4), tumor of the ampulla of Vater (n = 4), hepatocellular carcinoma (n = 1), cholangitis (n = 1), chronic pancreatitis (n = 1) and pancreatic metastasis from renal cell carcinoma (n = 1). The operative procedures were pancreatoduodenectomy (n = 29), distal pancreatectomy (n = 13) and total pancreatectomy (n = 1). A total of 11 patients had been treated with anticancer agents before surgery. There were no significant differences in age or BMI between the four groups. Diabetes duration in the long‐type 2 diabetes group was 16 ± 12 years. Diabetes duration of new‐diabetes was defined as 0 years. HbA1c was significantly higher in the new‐diabetes group than that in the NGT group (P < 0.05) and higher in the long‐type 2 diabetes group than that in the NGT (P < 0.01), IGT (P < 0.01) and new‐diabetes (P < 0.01) groups. HbA1c levels in nine patients in the long‐type 2 diabetes group were checked more than once before operation. Among them, eight patients kept HbA1c >6.5% during several months before operation. The remaining one patient maintained HbA1c around 6.5%. The fasting plasma glucose level in the long‐type 2 diabetes group was significantly higher than those in the NGT (P < 0.01), IGT (P < 0.01) and new‐diabetes (P < 0.05) groups. The fasting C‐peptide immunoreactivity (F‐CPR) level in the long‐type 2 diabetes cohort was significantly lower than that in the NGT group (P < 0.05). The C‐peptide index in the long‐type 2 diabetes group was lower than those in the NGT (P < 0.01), IGT (P < 0.05) and new‐diabetes (P < 0.05) groups. The insulinogenic index was lower in the new‐diabetes cohort than that in individuals with NGT (P < 0.01). The Matsuda index was lower in the IGT group than that in the NGT group (P < 0.05). There were no significant differences in fasting immunoreactive insulin levels, HOMA‐β, HOMA‐R or C‐reactive protein levels between the four groups.
Table 1.
Patient clinical characteristics and laboratory data
| Glucose tolerance stages | Total | ||||
|---|---|---|---|---|---|
| NGT | IGT | New‐DM | Long‐T2 | ||
| n (male/female) | 14 (9/5) | 10 (5/5) | 9 (6/3) | 10 (5/5) | 43 (25/18) |
| Clinical diagnosis (%) | |||||
| Pancreas cancer | 4 (29) | 5 (50) | 3 (33) | 5 (50) | 17 (40) |
| Cystic lesions of the pancreas | 6 (43) | 3 (30) | 3 (33) | 2 (20) | 14 (33) |
| Cholangiocarcinoma | 1 (7) | 2 (20) | 0 | 1 (10) | 4 (9) |
| Tumor of the ampulla of Vater | 1 (7) | 0 | 2 (22) | 1 (10) | 4 (9) |
| Hepatocellular carcinoma | 1 (7) | 0 | 0 | 0 | 1 (2) |
| Cholangitis | 1 (7) | 0 | 0 | 0 | 1 (2) |
| Chronic pancreatitis | 0 | 0 | 1 (11) | 0 | 1 (2) |
| Pancreatic metastasis of RCC | 0 | 0 | 0 | 1 (10) | 1 (2) |
| Operative procedure (PD/DP/total) | 12/2/0 | 5/4/1 | 5/4/0 | 7/3/0 | 29/13/1 |
| Preoperative anticancer agents (yes/no) | 4/10 | 4/6 | 2/7 | 1/9 | 11/32 |
| Age (years) | 64 ± 11 | 62 ± 15 | 67 ± 6 | 73 ± 8 | 66 ± 11 |
| BMI (kg/m2) | 21.4 ± 3.0 | 20.9 ± 1.8 | 22.9 ± 2.8 | 20.5 ± 3.5 | 21.4 ± 2.9 |
| Diabetes duration (years) | – | – | 0 | 16 ± 12 | |
| HbA1c, % (mmol/mol) | 5.3 ± 0.6, 35 ± 6 | 5.6 ± 0.5, 37 ± 6 | 6.2 ± 0.4, 44 ± 5* | 7.2 ± 0.9, 55 ± 10**‡¶ | 6.0 ± 1.0, 42 ± 10 |
| Fasting plasma glucose (mmol/L) | 5.3 ± 0.2 | 5.2 ± 0.2 | 5.5 ± 0.3 | 6.7 ± 0.3 (n = 9)**‡§ | 5.60 ± 0.9 (n = 42) |
| Fasting immunoreactive insulin (pmol/L) | 43.6 ± 35.7 | 36.7 ± 13.5 | 37.0 ± 22.2 | 18.1 (n = 1) | 39.1 ± 26.4 (n = 34) |
| F‐CPR (nmol/L) | 0.56 ± 0.22 | 0.48 ± 0.15 | 0.51 ± 0.23 | 0.26 ± 0.07 (n = 5) | 0.49 ± 0.21 (n = 38) |
| HOMA‐β (%) | 65.6 ± 40.1 | 66.4 ± 22.0 | 55.3 ± 36.9 | 19.5 (n = 1) | 61.8 ± 34.5 (n = 34) |
| C‐peptide index (nmol/mmol) | 0.103 ± 0.035 | 0.094 ± 0.030 | 0.093 ± 0.043 | 0.037 ± 0.008 (n = 5)**†§ | 0.090 ± 0.039 (n = 38) |
| Insulinogenic index (pmol/mmol) | 108.6 ± 50.9 | 78.3 ± 40.8 | 34.1 ± 18.4 (n = 7)* | 6.6 (n = 1) | 79.6 ± 51.5 (n = 32) |
| HOMA‐R | 1.54 ± 1.39 | 1.23 ± 0.56 | 1.32 ± 0.75 | 0.71 (n = 1) | 1.36 ± 1.01 (n = 34) |
| Matsuda index | 8.87 ± 4.84 | 4.80 ± 1.78* | 4.61 ± 2.01 (n = 8) | 6.72 (n = 1) | 6.54 ± 3.94 (n = 33) |
| Medication | – | – | – | Diet: 1, OHA: 5, Insulin: 4 | |
| C‐reactive protein (mg/dL) | 0.18 ± 0.33 | 0.15 ± 0.36 | 0.94 ± 2.02 | 0.16 ± 0.18 | 0.33 ± 0.97 |
| Relative alpha‐cell area (%) | 0.17 ± 0.09 | 0.16 ± 0.11 | 0.16 ± 0.17 | 0.25 ± 0.13 | 0.18 ± 0.13 |
| Relative beta‐cell area (%) | 1.02 ± 0.45 | 1.00 ± 0.40 | 0.79 ± 0.40 | 0.72 ± 0.31 | 0.90 ± 0.42 |
| α‐ to β‐cell area ratio | 0.18 ± 0.10 | 0.17 ± 0.12 | 0.17 ± 0.12 | 0.36 ± 0.12**†§ | 0.21 ± 0.14 |
Data are mean ± standard deviation. Statistical analyses were carried out by one‐way analysis of variance followed by post‐hoc Tukey–Kramer analysis. *P < 0.05 vs normal glucose tolerance (NGT), **P < 0.01 vs NGT, † P < 0.05 vs impaired glucose tolerance (IGT), ‡ P < 0.01 vs IGT, § P < 0.05 vs newly diagnosed diabetes (new‐DM), ¶ P < 0.01 vs new‐DM. F‐CPR, fasting C‐peptide immunoreactivity; FPG, fasting plasma glucose; HOMA‐β, homeostatic model assessment of β‐cell function; HOMA‐R, homeostasis model assessment of insulin resistance; Long‐T2, longstanding type 2 diabetes; RCC, renal cell carcinoma.
The relative α‐cell area tended to increase in the long‐type 2 diabetes group, but there were no significant differences between the four groups. The relative β‐cell area tended to decrease with glucose tolerance worsening. The α/β was 0.18 ± 0.10, 0.17 ± 0.12, 0.17 ± 0.12 and 0.36 ± 0.12 in the NGT, IGT, new‐diabetes and long‐type 2 diabetes groups, respectively. The α/β in the long‐type 2 diabetes group was significantly higher than those in the NGT (P < 0.01), IGT (P < 0.05) and new‐diabetes (P < 0.05) groups.
The relative α‐cell area and the α/β were not different between patients with benign diseases (n = 18) and those with malignant diseases (n = 25; Figure S4a,b, 0.21 ± 0.12% vs 0.16 ± 0.13% and 0.25 ± 0.14 vs 0.19 ± 0.13, respectively). Similarly, these parameters did not differ between samples obtained by pancreatoduodenectomy (n = 29) and those obtained by distal pancreatectomy (n = 13; Figure S4c,d, 0.19 ± 0.13% vs 0.17 ± 0.17% and 0.22 ± 0.15 vs 0.22 ± 0.11, respectively) or between patients who had been treated with preoperative anticancer agents (n = 11) and those who had not (n = 32; Figure S4e,f, 0.17 ± 0.13% vs 0.19 ± 0.13% and 0.15 ± 0.11 vs 0.24 ± 0.14, respectively).
Relationship between relative α‐cell area, β‐cell area or the α/β and clinical parameters
Figure 1 shows the single regression analyses between relative α‐cell area and various clinical parameters. In a single regression analysis, HbA1c was the only parameter that significantly correlated with relative α‐cell area. Age, BMI, diabetes duration, fasting plasma glucose levels, insulin secretory capacity, insulin resistance and insulin sensitivity were not significantly correlated with relative α‐cell area.
Figure 1.
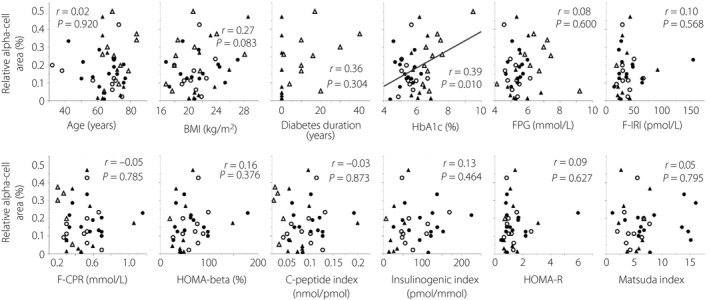
Single regression analyses between relative α‐cell area and various parameters. Age, body mass index (BMI) and glycated hemoglobin (HbA1c) n = 43 (all patients); diabetes duration n = 19; fasting plasma glucose (FPG) n = 42; fasting immunoreactive insulin (F‐IRI), homeostatic model assessment of β‐cell function (HOMA‐β) and homeostatic model assessment of insulin resistance (HOMA‐R) n = 34; fasting C‐peptide immunoreactivity (F‐CPR) and C‐peptide index n = 38; insulinogenic index n = 32; Matsuda index n = 33. Closed circles, normal glucose tolerance; open circles, impaired glucose tolerance; closed triangles, newly diagnosed diabetes; open triangles, longstanding type 2 diabetes.
Figure 2 shows the single regression analyses between relative β‐cell area and various clinical parameters. In single regression analyses, parameters representing insulin secretory capacity including fasting immunoreactive insulin, HOMA‐β and C‐peptide index were significantly correlated with relative β‐cell area, whereas there were no significant correlations between age, BMI, diabetes duration, HbA1c and FPG, and relative β‐cell area.
Figure 2.
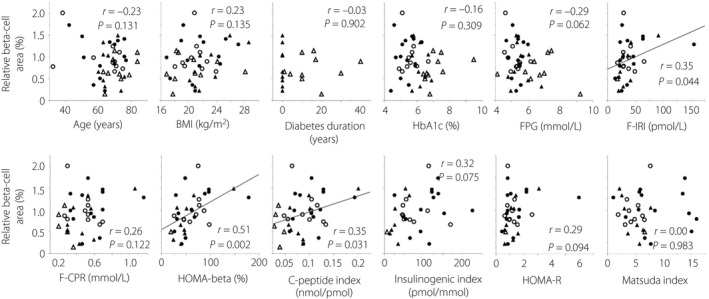
Single regression analyses between relative β‐cell area and various parameters. Age, body mass index (BMI) and glycated hemoglobin (HbA1c) n = 43 (all patients); diabetes duration n = 19; fasting plasma glucose (FPG) n = 42; fasting immunoreactive insulin (F‐IRI), homeostatic model assessment of β‐cell function (HOMA‐β) and homeostatic model assessment of insulin resistance (HOMA‐R) n = 34; fasting C‐peptide immunoreactivity (F‐CPR) and C‐peptide index n = 38; insulinogenic index n = 32; Matsuda index n = 33. Closed circles, normal glucose tolerance; open circles, impaired glucose tolerance; closed triangles, newly diagnosed diabetes; open triangles, longstanding type 2 diabetes.
Figure 3 shows the single regression analyses between the α/β and various clinical parameters. In single regression analyses, diabetes duration, HbA1c and fasting plasma glucose levels were significantly correlated with the α/β. Age, BMI, insulin secretory capacity, insulin resistance and insulin sensitivity were not significantly correlated with the α/β. Furthermore, a stepwise multiple regression analysis carried out with the variables that correlated significantly with the α/β identified diabetes duration as the only independent and significant determinant of the ratio (P = 0.006; Table 2).
Figure 3.
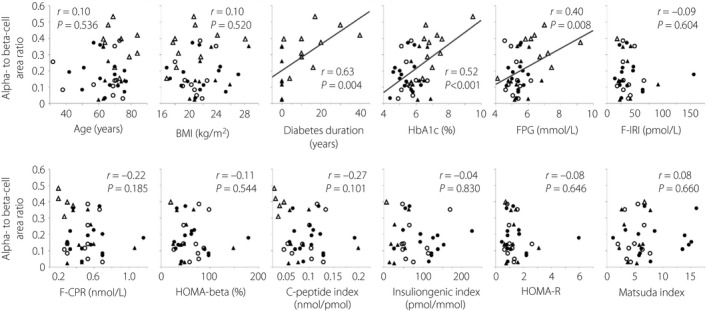
Single regression analyses between the α‐ to β‐cell area ratio and various parameters. Age, body mass index (BMI) and glycated hemoglobin (HbA1c) n = 43 (all patients); diabetes duration n = 19; fasting plasma glucose (FPG) n = 42; fasting immunoreactive insulin (F‐IRI), homeostatic model assessment of β‐cell function (HOMA‐β) and homeostatic model assessment of insulin resistance (HOMA‐R) n = 34; fasting C‐peptide immunoreactivity (F‐CPR) and C‐peptide index n = 38; insulinogenic index n = 32; Matsuda index n = 33. Closed circles, normal glucose tolerance; open circles, impaired glucose tolerance; closed triangles, newly diagnosed diabetes; open triangles, longstanding type 2 diabetes.
Table 2.
Results of stepwise multiple regression analysis with α‐ to β‐cell area ratio as the dependent variable
| R 2 | AICc | BIC | P‐value | |
|---|---|---|---|---|
| Duration (years) | 0.381 | −21.7 | −20.8 | 0.006 |
Neither glycated hemoglobin nor fasting plasma glucose were significant determinants in this analysis. AICc, second‐order Akaike's information criterion; BIC, Bayesian information criterion.
Ki67‐ and cCAS3‐positive ratio in α‐ and β‐cells
We evaluated the Ki67‐positive ratio in α‐ and β‐cells to examine proliferation. The median Ki67‐positive ratio in α‐cells (%) was 0.00% (IQR 0.00%), 0.00% (IQR 0.03%), 0.00% (IQR 0.05%) and 0.05% (IQR 0.17%) in the NGT, IGT, new‐diabetes and long‐type 2 diabetes groups, respectively. There were no significant differences in these ratios between the four groups (P = 0.125), but there was a tendency for proliferation to increase with glucose tolerance worsening (Figure 4a). There was no significant correlation between HbA1c and the α‐cell Ki67‐positive ratio by Spearman's rank correlation coefficient (P = 0.103). However, the α‐cell Ki67‐positive ratio in patients with HbA1c ≥6.5%, the criteria for diabetes in Japan, was significantly higher than that in patients with HbA1c <6.5% (0.00% [IQR 0.15%] vs 0.00% [IQR 0.00%], P = 0.022; Figure 4b). The correlation between diabetes duration and the α‐cell Ki67‐positive ratio was not significant by Spearman's rank correlation coefficient (P = 0.172). The median Ki67‐positive ratio in β‐cells (%) was 0.06% (IQR 0.10%), 0.10% (IQR 0.15%), 0.11% (IQR 0.16%) and 0.06% (IQR 0.22%) in the NGT, IGT, new‐diabetes and long‐type 2 diabetes groups, respectively. There were no significant differences in these ratios between the four groups (P = 0.451).
Figure 4.
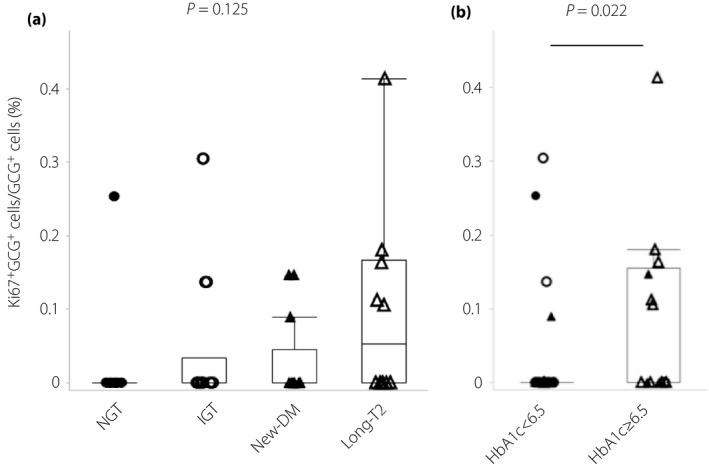
Ki67‐positive α‐cells and insulin and glucagon double‐positive cells. (a) α‐Cell Ki67‐positive ratio (%) in the normal glucose tolerance (NGT), impaired glucose tolerance (IGT), newly diagnosed diabetes (new‐DM) and longstanding type 2 diabetes (long‐T2 groups). (b) α‐Cell Ki67‐positive ratio (%) in patients with glycated hemoglobin (HbA1c) <6.5% and those with HbA1c ≥6.5%. Closed circles, normal glucose tolerance; open circles, impaired glucose tolerance; closed triangles, newly diagnosed diabetes; open triangles, longstanding type 2 diabetes.
To examine the influence of apoptosis, we evaluated the cCAS3‐positive ratio in α‐ and β‐cells. The median cCAS3‐positive ratio in α‐cells (%) was 0.00% (IQR 0.00%), 0.00% (IQR 0.02%), 0.00% (IQR 0.00%) and 0.00% (IQR 0.02%) in the NGT, IGT, new‐diabetes and long‐type 2 diabetes groups, respectively. There were no significant differences in these ratios between the four groups (P = 0.745). The cCAS3‐positive ratio (%) of the patients with HbA1c <6.5% was 0.00% (IQR 0.00%) and the patients with HbA1c ≥6.5% was 0.00% (IQR 0.04%). There were no significant differences in these ratios between the two groups (P = 0.225). The median cCAS3‐positive ratio in β‐cells (%) was 0.00% (IQR 0.10%), 0.00% (IQR 0.09%), 0.00% (IQR 0.08%) and 0.05% (IQR 0.13%) in the NGT, IGT, new‐diabetes and long‐type 2 diabetes groups, respectively. There were no significant differences in these ratios between the four groups (P = 0.813).
Insulin and glucagon double‐positive cells
We evaluated the prevalence of glucagon‐positive cells that co‐expressed insulin to identify immature endocrine cells as neogenic α‐cells. The median INS+GCG+ ratios were 0.73% (IQR 0.64%), 0.56% (IQR 1.51%), 0.77% (IQR 1.45%) and 1.07% (IQR 1.11%) in NGT, IGT, new‐diabetes and the long‐type 2 diabetes groups, respectively (Figure 5a), and there were no significant differences between the four groups (P = 0.560). The median INS+GCG+ ratios (%) were 0.70% (IQR 0.55%) and 1.00% (IQR 1.16%) in individuals with HbA1c <6.5% and those with HbA1c ≥6.5% (P = 0.255), respectively (Figure 5b).
Figure 5.
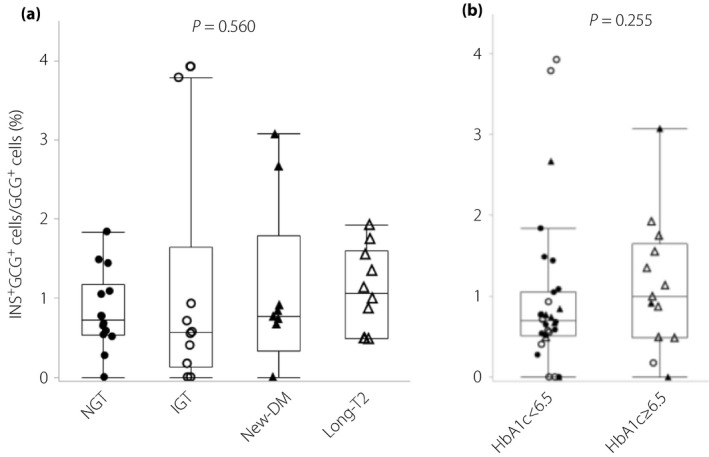
(a) The proportion of insulin and glucagon double‐positive cells of the total glucagon‐positive cells (%) in the normal glucose tolerance (NGT), impaired glucose tolerance (IGT), newly diagnosed diabetes (new‐DM) and longstanding type 2 diabetes (long‐T2) groups. (b) The proportion of insulin and glucagon double‐positive cells of the total glucagon‐positive cells (%) in patients with glycated hemoglobin (HbA1c) <6.5% and those with HbA1c ≥6.5%. Closed circles, normal glucose tolerance; open circles, impaired glucose tolerance; closed triangles, newly diagnosed diabetes; open triangles, longstanding type 2 diabetes.
Expression patterns of transcription factors in endocrine cells
We evaluated the expression patterns of various transcription factors including ARX in insulin‐ and glucagon‐positive cells to examine processes of phenotypic change, such as dedifferentiation and transdifferentiation.
Figure 6 shows triple immunostaining for glucagon, insulin and ARX. Figure 6a–d shows a typical islet. Most α‐cells expressed ARX (green arrowheads), whereas most β‐cells did not express ARX (red arrowheads). However, some β‐cells expressed ARX (Figure 6e–h), and some α‐cells did not express ARX (Figure 6i–l). β‐Cells expressing ARX and α‐cells not expressing ARX could be found at all glucose tolerance stages. We also confirmed transcription factor expression in INS+GCG+ cells, which are considered immature endocrine cells. We found some INS+GCG+ cells that expressed ARX (Figure 6m–p). Figure 7 shows triple immunostaining for glucagon, insulin and PDX‐1. Figure 7a–d shows a typical islet. Most α‐cells did not express PDX‐1 (green arrowheads), whereas most β‐cells expressed PDX‐1 (red arrowheads). Some β‐cells did not express PDX‐1 (Figure 7e–h), and some α‐cells expressed PDX‐1 (Figure 7i‐l). Furthermore, there was an INS+GCG+ cell that expressed PDX‐1 (Figure 7m–p). Figure 8 shows triple immunostaining for insulin, glucagon and ARX or NKX6.1, a β‐cell transcription factor, in a pair of mirror sections. There were some INS+GCG+ cells that expressed ARX, but not NKX6.1 (Figure 8a–h), and some INS+GCG+ cells that expressed NKX6.1, but not ARX (Figure 8i–p). Furthermore, there were INS+GCG+ cells that expressed both ARX and NKX6.1 (Figure 8q–x).
Figure 6.
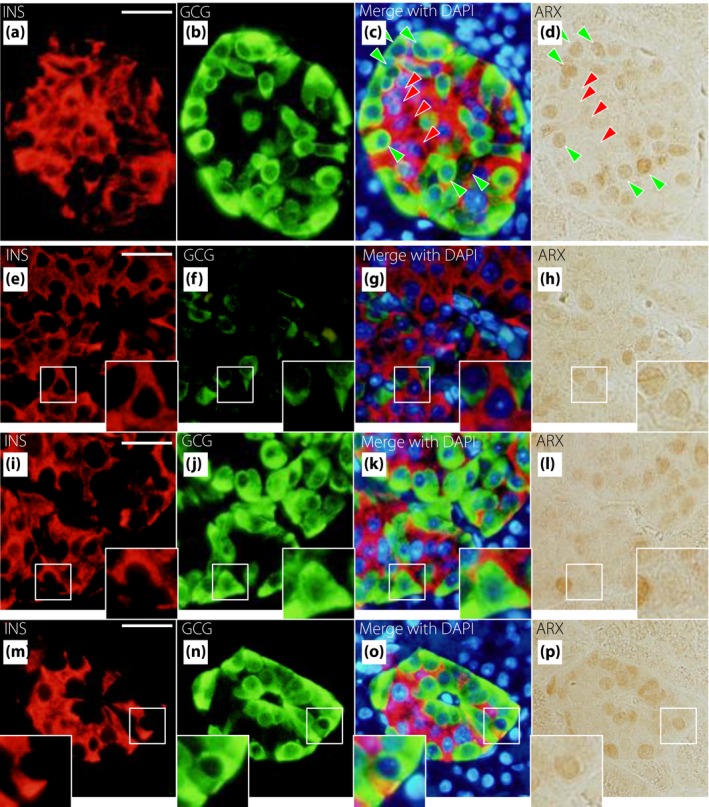
Representative images of insulin (INS), glucagon (GCG) and aristaless‐related homeobox (ARX) staining in newly diagnosed diabetes. Triple immunostaining is shown for INS (red), GCG (green), 4′,6‐diamidino‐2‐phenylindole (DAPI; blue) and ARX (brown). (a–d) Typical islets. Green arrowheads show α‐cells that express ARX, and red arrowheads show β‐cells that do not express ARX. (e–h) An insulin‐positive and glucagon‐negative cell that expresses ARX. (i–l) An insulin‐negative and glucagon‐positive cell that does not express ARX. (m–p) An insulin and glucagon double‐positive cell that expresses ARX. Bars, 25 µm.
Figure 7.
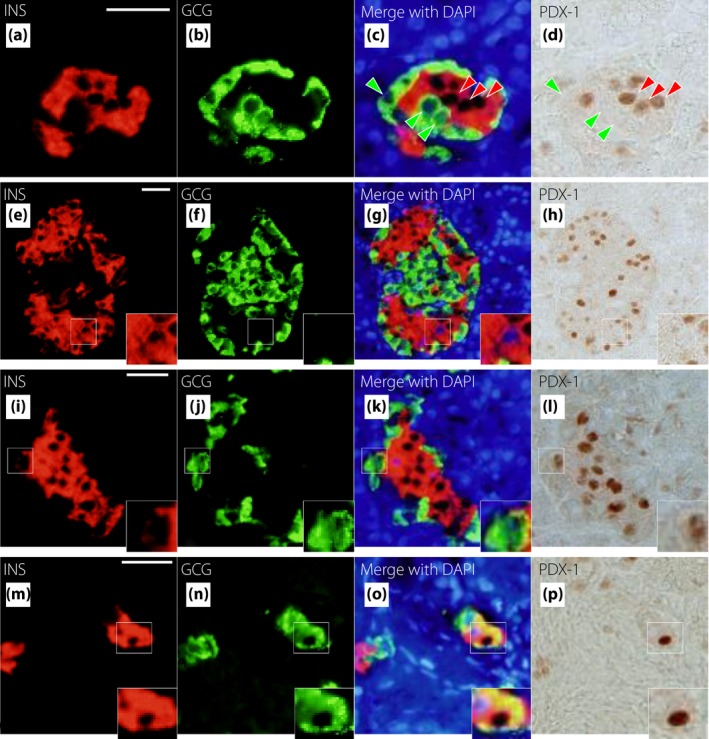
Representative images of insulin (INS), glucagon (GCG) and pancreas duodenal homeobox gene 1 (PDX‐1) staining in longstanding type 2 diabetes. Triple immunostaining is shown for INS (red), GCG (green), 4′,6‐diamidino‐2‐phenylindole (DAPI; blue) and PDX‐1 (brown). (a–d) An insulin‐positive and glucagon‐negative cell that does not express PDX‐1. (e–h) An insulin‐negative and glucagon‐positive cell that expresses PDX‐1. (i–l) An insulin and glucagon double‐positive cell that expresses PDX‐1. Bars, 25 µm.
Figure 8.
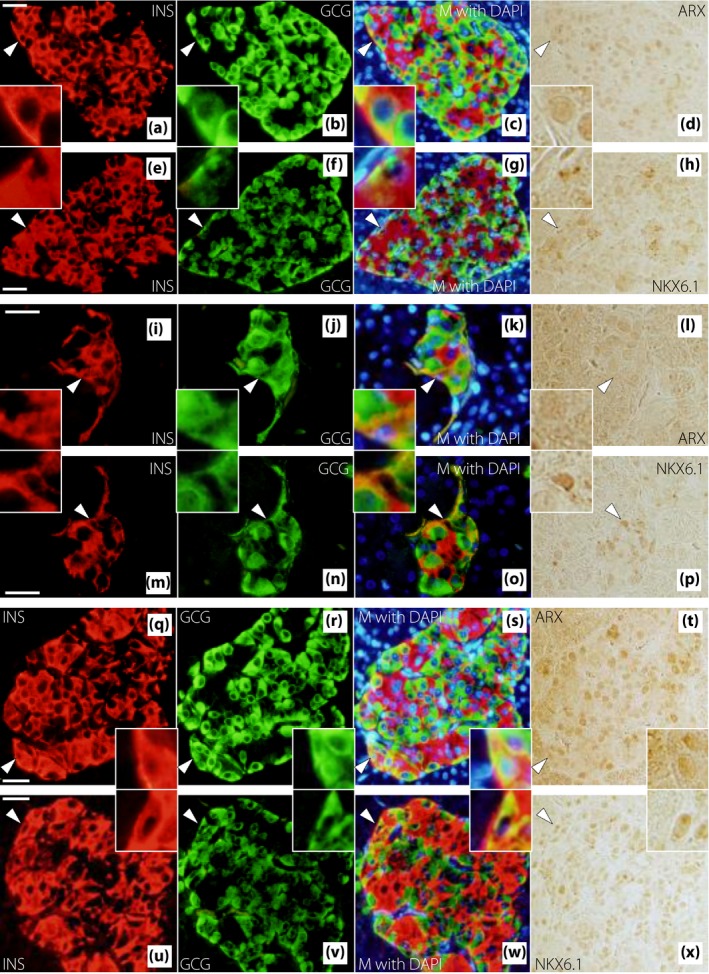
Representative images of insulin (INS), glucagon (GCG) and (a–h) aristaless‐related homeobox (ARX) or (q–x) NK homeobox 6.1 (NKX6.1) staining in a pair of mirror sections from patients with (a–h, q–x) newly diagnosed diabetes or (i–p) longstanding type 2 diabetes. Triple immunostaining is shown for (a–d, i–l, q–t) INS (red), GCG (green), 4′,6‐diamidino‐2‐phenylindole (DAPI; blue) and ARX (brown), and (e–h, m–p, u–x) INS (red), GCG (green), DAPI (blue) and NKX6.1 (brown). (a–d, e–h, i–l, m–p, q–t, u–x) Mirror sections of each other. White arrowheads denote regions enlarged in the corner. (a–h) An insulin and glucagon double‐positive (INS + GCG +) cell that expresses ARX, but not NKX6.1 in a patient with newly diagnosed diabetes. (i–p) An INS + GCG + cell that expresses NKX6.1, but not ARX in a patient with longstanding type 2 diabetes. (q–x) An INS + GCG + cell that expresses both ARX and NKX6.1 in a patient with newly diagnosed diabetes. M, merge. Bars, 25 µm.
Discussion
In the present study, we analyzed human pancreatic tissues obtained from pancreatectomies, and revealed that the α/β was significantly correlated with HbA1c, fasting plasma glucose levels and type 2 diabetes duration, and that diabetes duration was the only independent and significant determinant of the ratio. We also showed that the α/β was significantly higher in individuals with long‐type 2 diabetes than that in the NGT, IGT and new‐DM groups, and there were no significant differences in this ratio between the NGT, IGT and new‐diabetes groups. These results suggest that the α‐cell mass relative to β‐cell mass increases after type 2 diabetes onset, and that this relative increase depends on the period of chronic hyperglycemia.
Additionally, we showed that the α‐cell area was significantly associated with HbA1c. The α‐cell Ki67‐positive ratio in patients with HbA1c ≥6.5%, the criteria for diabetes in Japan, was significantly higher than that in patients with HbA1c <6.5%. Thus, one of the potential mechanisms of the increase in α‐cell mass related to chronic hyperglycemia might be α‐cell proliferation, which might also partly contribute to the increase in the α/β. It has been previously reported that adult human α‐cells can proliferate remarkably during type 1 diabetes progression25. One of the factors promoting α‐cell proliferation is interleukin‐626, 27. Blood interleukin‐6 levels in patients with type 2 diabetes are reported to be higher than those in healthy controls28. Macrophages and granulocytes, which produce and secrete interleukin‐6, are found in islets of Goto–Kakizaki rats29, which are often used as a non‐obese diabetic model. In contrast, glucagon‐like peptide‐1 accelerated β‐cell proliferation and reduced α‐cell proliferation by downregulating retinoblastoma protein30. The decreased incretin effect associated with impaired glucose tolerance31 might also promote α‐cell proliferation.
We thought that α‐cell proliferation affects the increment of α‐cell mass to some extent, but other mechanisms might also be involved in the increase of α‐cell mass, because the α‐cell Ki67‐positive ratio was very low. We examined the ratio of glucagon‐positive cells in ductal epithelium as neogenic cells, but there were no significant differences between the NGT, IGT, new‐diabetes and long‐type 2 diabetes groups, respectively (data not shown). Then, we considered that phenotypic changes in pancreatic endocrine cells might be another potential mechanism underlying the increase in α‐cell mass relative to β‐cell mass. In fact, chronic hyperglycemia resulted in a reduction in insulin‐positive cells and an increase in glucagon‐positive cells through β‐cell transdifferentiation in a diabetic mouse model32. Pancreatic endocrine phenotypic changes and the resulting change in the balance between α‐ and β‐cell mass might easily occur when diabetes duration becomes longer. We examined ARX and PDX‐1 expression in pancreatic endocrine cells to investigate the possibility of dedifferentiation and transdifferentiation in islet cells. We identified insulin‐positive cells expressing ARX (or not expressing PDX‐1) and glucagon‐positive cells not expressing ARX (or expressing PDX‐1). Insulin‐positive cells expressing ARX (or not expressing PDX‐1) suggest transdifferentiation from β‐cells to α‐ or other islet cells. Glucagon‐positive cells not expressing ARX (or expressing PDX‐1) suggest transdifferentiation from α‐cells to β‐ or other islet cells. In fact, misexpression of the Arx gene in mouse β‐cells promoted the conversion of β‐cells into glucagon‐ or pancreatic polypeptide‐producing cells33. In contrast, Arx gene ablation in mouse neonatal α‐cells resulted in an α‐to‐β‐like conversion through a bi‐hormonal state34, and Arx gene inhibition in mouse α‐cells promoted the conversion of α‐cells into β‐like cells at any age35. Taken together, our findings suggest that pancreatic endocrine cells have potential plasticity not only in mice, but also in humans.
Furthermore, we examined ARX expression in INS+GCG+ cells and identified various types of INS+GCG+ cells. Some cells expressed ARX, but not NKX6.1, whereas others expressed NKX6.1, but not ARX. There were also some INS+GCG+ cells that expressed both transcription factors. INS+GCG+ cells are thought to be immature cells36, such as neogenic cells, in the process of differentiating into α‐ or β‐cells, cells dedifferentiating from α‐ or β‐cells, or cells transdifferentiating from α‐ or β‐cells to other cell types. Furthermore, pancreatic endocrine cell phenotypic changes, including neogenesis, dedifferentiation and transdifferentiation, might occur multidirectionally. Those phenotypic changes, if any, might partly contribute to pancreatic endocrine cell volume and the change in the balance between these pancreatic endocrine cells with worsening glucose tolerance. Although we could not evaluate the precise number of the various types of INS+GCG+ cells described above at four stages of glucose tolerance in the present study, further investigation will confirm this hypothesis.
The present study had certain limitations that should be considered when interpreting the results. First, although we excluded samples with confirmed strong inflammation by hematoxylin–eosin staining and fibrosis changes by AZAN staining, pancreatic inflammation derived from primary pancreatic (mainly malignant) diseases might affect the relative α‐cell area and the α/β. Second, 25 patients had malignant diseases, and their preoperative BMI was 21.3 ± 3.2 kg/m2, which was relatively low. A total of 11 of these patients received anticancer agents preoperatively. The relative α‐cell area and the α/β were not different between patients with benign diseases and those with malignant diseases or between patients who had been treated with anticancer agents and those who had not. However, we could not completely exclude an effect of malignant diseases and anticancer agents on pancreatic histology or glucose tolerance. Third, we did not discriminate pancreas head tissue samples from pancreas body or tail tissue samples and, therefore, analyzed these samples together. We could not exclude an influence of the sampling site on pancreatic histology. In a previous report, α‐ and β‐cell area fractions, as well as the α/β, were not significantly different between islets obtained from the pancreas head, body and tail5. Furthermore, the relative α‐cell area and the α/β did not differ between samples obtained by pancreatoduodenectomy and those obtained by distal pancreatectomy in the present study. Thus, we believe that the sampling site would not affect our conclusions. Finally, the numbers of participants in some laboratory data in the long‐type 2 diabetes group were too small, because some parameters could not be calculated due to exogenous insulin use in this group. This might make it difficult to carry out sufficient analyses. Importantly, despite these limitations, we were able to evaluate the detailed glucose tolerance status in conjunction with pancreatic histological analyses using fresh tissue samples from humans.
In conclusion, the pancreatic α/β increased after type 2 diabetes onset and correlated with diabetes duration, whereas relative α‐cell area correlated with HbA1c. This pancreatic endocrine histological change might occur through α‐cell proliferation, which might be associated with the duration and degree of chronic hyperglycemia, and phenotypic changes in pancreatic endocrine cells.
Disclosure
The authors declare no conflict of interest.
Supporting information
Figure S1 | Flow chart of disposition of patients.
Figure S2 | Representative images of (a) glucagon) and (b) insulin staining by a 3,3‐diaminobenzidine tetrahydrochloride substrate in patients with normal glucose tolerance.
Figure S3 | Representative images of glucagon and Ki67 staining in patients with longstanding type 2 diabetes.
Figure S4 | Relative (a) α‐cell area and the (b) α‐ to β‐cell area ratio in patients with benign disease and those with malignant disease. Relative (c) α‐cell area and the (d) α‐ to β‐cell area ratio in samples obtained by pancreatoduodenectomy and those obtained by distal pancreatectomy. Relative (e) α‐cell area and the (f) α‐ to β‐cell area ratio in patients who had been treated with preoperative anticancer agents and those who had not.
Table S1 | (a) Primary antibodies, (b) secondary antibodies and (c) chromogenic substrates used.
Acknowledgments
We thank Dr Patrick Collombat for donating the anti‐ARX antibody and for helpful advice, and Ms Misako Kobayashi for technical assistance. This study was supported in part by a Grant‐in‐Aid from the Japanese Society for the Promotion of Science, grant number 25461350.
J Diabetes Investig. 2018
References
- 1. Unger RH, Orci L. The essential role of glucagon in the pathogenesis of diabetes mellitus. Lancet 1975; 1: 14–16. [DOI] [PubMed] [Google Scholar]
- 2. Lund A, Bagger JI, Christensen M, et al Glucagon and type 2 diabetes: the return of the alpha cell. Curr Diab Rep 2014; 14: 555. [DOI] [PubMed] [Google Scholar]
- 3. Müller WA, Faloona GR, Aguilar‐Parada E, et al Abnormal alpha‐cell function in diabetes: response to carbohydrate and protein ingestion. N Engl J Med 1970; 283: 109–115. [DOI] [PubMed] [Google Scholar]
- 4. Mizukami H, Takahashi K, Inaba W, et al Involvement of oxidative stress‐induced DNA damage, endoplasmic reticulum stress, and autophagy deficits in the decline of β‐cell mass in Japanese type 2 diabetic patients. Diabetes Care 2014; 37: 1966–1974. [DOI] [PubMed] [Google Scholar]
- 5. Yoon KH, Ko SH, Cho JH, et al Selective beta‐cell loss and alpha‐cell expansion in patients with type 2 diabetes mellitus in Korea. J Clin Endocrinol Metab 2003; 88: 2300–2308. [DOI] [PubMed] [Google Scholar]
- 6. Butler AE, Campbell‐Thompson M, Gurlo T, et al Marked expansion of exocrine and endocrine pancreas with incretin therapy in humans with increased exocrine pancreas dysplasia and the potential for glucagon‐producing neuroendocrine tumors. Diabetes 2013; 62: 2595–2604. [DOI] [PMC free article] [PubMed] [Google Scholar]
- 7. Henquin JC, Rahier J. Pancreatic alpha cell mass in European subjects with type 2 diabetes. Diabetologia 2011; 54: 1720–1725. [DOI] [PMC free article] [PubMed] [Google Scholar]
- 8. Inaishi J, Saisho Y, Sato S, et al Effects of obesity and diabetes on α‐ and β‐cell mass in surgically resected human pancreas. J Clin Endocrinol Metab 2016; 101: 2874–2882. [DOI] [PMC free article] [PubMed] [Google Scholar]
- 9. Kilimnik G, Zhao B, Jo J, et al Altered islet composition and disproportionate loss of large islets in patients with type 2 diabetes. PLoS One 2011; 6: e27445. [DOI] [PMC free article] [PubMed] [Google Scholar]
- 10. Meier JJ, Butler AE, Saisho Y, et al Beta‐cell replication is the primary mechanism subserving the postnatal expansion of beta‐cell mass in humans. Diabetes 2008; 57: 1584–1594. [DOI] [PMC free article] [PubMed] [Google Scholar]
- 11. Yoneda S, Uno S, Iwahashi H, et al Predominance of β‐cell neogenesis rather than replication in humans with an impaired glucose tolerance and newly diagnosed diabetes. J Clin Endocrinol Metab 2013; 98: 2053–2061. [DOI] [PubMed] [Google Scholar]
- 12. Butler AE, Janson J, Bonner‐Weir S, et al Beta‐cell deficit and increased beta‐cell apoptosis in humans with type 2 diabetes. Diabetes 2003; 52: 102–110. [DOI] [PubMed] [Google Scholar]
- 13. Thorel F, Népote V, Avril I, et al Conversion of adult pancreatic alpha‐cells to beta‐cells after extreme beta‐cell loss. Nature 2010; 464: 1149–1154. [DOI] [PMC free article] [PubMed] [Google Scholar]
- 14. Talchai C, Xuan S, Lin HV, et al Pancreatic β cell dedifferentiation as a mechanism of diabetic β cell failure. Cell 2012; 150: 1223–1234. [DOI] [PMC free article] [PubMed] [Google Scholar]
- 15. Spijker HS, Ravelli RB, Mommaas‐Kienhuis AM, et al Conversion of mature human β‐cells into glucagon‐producing α‐cells. Diabetes 2013; 62: 2471–2480. [DOI] [PMC free article] [PubMed] [Google Scholar]
- 16. Cinti F, Bouchi R, Kim‐Muller JY, et al Evidence of β‐cell dedifferentiation in human type 2 diabetes. J Clin Endocrinol Metab 2016; 101: 1044–1054. [DOI] [PMC free article] [PubMed] [Google Scholar]
- 17. Fujita Y, Kozawa J, Iwahashi H, et al Increment of serum C‐peptide measured by glucagon test closely correlates with human relative beta‐cell area. Endocr J 2015; 62: 329–337. [DOI] [PubMed] [Google Scholar]
- 18. Sullivan BA, Hollister‐Lock J, Bonner‐Weir S, et al Reduced Ki67 Staining in the postmortem state calls into question past conclusions about the lack of turnover of adult human β‐cells. Diabetes 2015; 64: 1698–1702. [DOI] [PMC free article] [PubMed] [Google Scholar]
- 19. Collombat P, Mansouri A, Hecksher‐Sorensen J, et al Opposing actions of Arx and Pax4 in endocrine pancreas development. Genes Dev 2003; 17: 2591–2603. [DOI] [PMC free article] [PubMed] [Google Scholar]
- 20. Collombat P, Hecksher‐Sørensen J, Broccoli V, et al The simultaneous loss of Arx and Pax4 genes promotes a somatostatin‐producing cell fate specification at the expense of the alpha‐ and beta‐cell lineages in the mouse endocrine pancreas. Development 2005; 132: 2969–2980. [DOI] [PubMed] [Google Scholar]
- 21. Matthews DR, Hosker JP, Rudenski AS, et al Homeostasis model assessment: insulin resistance and beta‐cell function from fasting plasma glucose and insulin concentrations in man. Diabetologia 1985; 28: 412–419. [DOI] [PubMed] [Google Scholar]
- 22. Asano T, Kawamura M, Watanabe T, et al Indices of urinary and serum C‐peptide corrected with fasting plasma glucose for decision‐making insulin therapy in type 2 diabetes‐validation and comparison. J Japan Diab Soc 2008; 51: 759–763 (Japanese). [Google Scholar]
- 23. Kosaka K, Hagura R, Kuzuya T. Insulin responses in equivocal and definite diabetes, with special reference to subjects who had mild glucose intolerance but later developed definite diabetes. Diabetes 1977; 26: 944–952. [DOI] [PubMed] [Google Scholar]
- 24. DeFronzo RA, Matsuda M. Reduced time points to calculate the composite index. Diabetes Care 2010; 33: e93. [DOI] [PubMed] [Google Scholar]
- 25. Willcox A, Richardson SJ, Bone AJ, et al Evidence of increased islet cell proliferation in patients with recent‐onset type 1 diabetes. Diabetologia 2010; 53: 2020–2028. [DOI] [PubMed] [Google Scholar]
- 26. Ellingsgaard H, Ehses JA, Hammar EB, et al Interleukin‐6 regulates pancreatic alpha‐cell mass expansion. Proc Natl Acad Sci USA 2008; 105: 13163–13168. [DOI] [PMC free article] [PubMed] [Google Scholar]
- 27. Cai Y, Yuchi Y, De Groef S, et al IL‐6‐dependent proliferation of alpha cells in mice with partial pancreatic‐duct ligation. Diabetologia 2014; 57: 1420–1427. [DOI] [PubMed] [Google Scholar]
- 28. Spranger J, Kroke A, Möhlig M, et al Inflammatory cytokines and the risk to develop type 2 diabetes: results of the prospective population‐based European Prospective Investigation into Cancer and Nutrition (EPIC)‐Potsdam Study. Diabetes 2003; 52: 812–817. [DOI] [PubMed] [Google Scholar]
- 29. Homo‐Delarche F, Calderari S, Irminger JC, et al Islet inflammation and fibrosis in a spontaneous model of type 2 diabetes, the GK rat. Diabetes 2006; 55: 1625–1633. [DOI] [PubMed] [Google Scholar]
- 30. Cai EP, Luk CT, Wu X, et al Rb and p107 are required for alpha cell survival, beta cell cycle control and glucagon‐like peptide‐1 action. Diabetologia 2014; 57: 2555–2565. [DOI] [PubMed] [Google Scholar]
- 31. Shen J, Chen Z, Chen C, et al Impact of incretin on early‐phase insulin secretion and glucose excursion. Endocrine 2013; 44: 403–410. [DOI] [PubMed] [Google Scholar]
- 32. Brereton MF, Iberl M, Shimomura K, et al Reversible changes in pancreatic islet structure and function produced by elevated blood glucose. Nat Commun 2014; 5: 4639. [DOI] [PMC free article] [PubMed] [Google Scholar]
- 33. Collombat P, Hecksher‐Sørensen J, Krull J, et al Embryonic endocrine pancreas and mature beta cells acquire alpha and PP cell phenotypes upon Arx misexpression. J Clin Invest 2007; 117: 961–970. [DOI] [PMC free article] [PubMed] [Google Scholar]
- 34. Wilcox CL, Terry NA, Walp ER, et al Pancreatic α‐cell specific deletion of mouse Arx leads to α‐cell identity loss. PLoS One 2013; 8: e66214. [DOI] [PMC free article] [PubMed] [Google Scholar]
- 35. Courtney M, Gjernes E, Druelle N, et al The inactivation of Arx in pancreatic α‐cells triggers their neogenesis and conversion into functional β‐like cells. PLoS Genet 2013; 9: e1003934. [DOI] [PMC free article] [PubMed] [Google Scholar]
- 36. Meier JJ, Köhler CU, Alkhatib B, et al. Beta‐cell development and turnover during prenatal life in humans. Eur J Endocrinol 2010; 162: 559–568. [DOI] [PubMed] [Google Scholar]
Associated Data
This section collects any data citations, data availability statements, or supplementary materials included in this article.
Supplementary Materials
Figure S1 | Flow chart of disposition of patients.
Figure S2 | Representative images of (a) glucagon) and (b) insulin staining by a 3,3‐diaminobenzidine tetrahydrochloride substrate in patients with normal glucose tolerance.
Figure S3 | Representative images of glucagon and Ki67 staining in patients with longstanding type 2 diabetes.
Figure S4 | Relative (a) α‐cell area and the (b) α‐ to β‐cell area ratio in patients with benign disease and those with malignant disease. Relative (c) α‐cell area and the (d) α‐ to β‐cell area ratio in samples obtained by pancreatoduodenectomy and those obtained by distal pancreatectomy. Relative (e) α‐cell area and the (f) α‐ to β‐cell area ratio in patients who had been treated with preoperative anticancer agents and those who had not.
Table S1 | (a) Primary antibodies, (b) secondary antibodies and (c) chromogenic substrates used.