

Summary
The demand for better “true performance” of supercapacitors, which is defined as the energy density based on the packaged cell with high active mass loading, is spurred by the ever-increasing energy storage market. The true performance of present supercapacitors is unsatisfactory, greatly limited by the currently used current collectors. Here, we develop a through-pore structured nickel current collector with excellent flexibility by electrodepositing nickel on laser-drilled stainless steel sheets filled with epoxy resin. Based on the new current collector, the electrodes possess higher performance than those fabricated by employing conventional current collectors. At a high active mass loading, the assembled supercapacitors show superior flexibility and high energy densities of 50.4 W hr L−1 and 30.1 W hr kg−1, respectively, based on the packaged cell, outperforming the present supercapacitors. Our strategy provides a new opportunity for promoting the further development of supercapacitors by enhancing the true performance.
Subject Areas: Materials Science, Energy Materials, Porous Material
Graphical Abstract
Highlights
-
•
A free-standing through-pore structured nickel film (TPNF) has been developed
-
•
The TPNF is employed as the current collector for supercapacitors
-
•
A packaged supercapacitor with high active mass loading is fabricated
-
•
The packaged supercapacitor shows excellent flexibility and high true performance
Materials Science; Energy Materials; Porous Material
Introduction
Intensive research on supercapacitors has been carried out for many years (Conway, 1999, Miller and Simon, 2008). Despite the great progress made, the “true performance” of supercapacitors, which is defined as the energy density based on the packaged cell with high active mass loading, is still limited, making it difficult to meet the practical application (Gogotsi and Simon, 2011, Stoller and Ruoff, 2010). The true performance is dependent not only on the active materials but also on the inactive components, especially the current collector. To achieve high true performance, high mass loading of active materials is necessary to provide feasible energy. Simultaneously, reducing the proportion of inactive current collector is important for increasing the energy density at the packaged cell level. To promote the development of supercapacitors, emphasis in previous research has been placed on developing new active materials (Simon and Gogotsi, 2008, Zhu et al., 2015, Ghidiu et al., 2014, Yan et al., 2014, Xue et al., 2018, Salunkhe et al., 2017, Nethravathi et al., 2014). However, the current collector has rarely been investigated thus far. As a matter of fact, the current collector influences the true performance of supercapacitors greatly. The attainable mass loading of active materials and ratio of active materials to inactive components are strongly dependent on the applied current collector (Shi et al., 2016, Liu et al., 2018).
Owing to the advantages of high conductivity, intrinsic hydrophilic nature, superior mechanical property, and excellent capability of scaling up, metallic current collectors have been playing a leading role in energy storage devices both in the laboratory and industry (Linden and Reddy, 2002, Xu et al., 2010, Liu et al., 2017, Meng and Ding, 2011, Li et al., 2017, Sheng et al., 2017). Compared with the conventional metallic foils, the porous metallic current collector with appropriate pore structure, especially through pores, is a promising candidate for achieving high true performance of supercapacitors. Porous current collector allows high mass loading by enhancing the bond strength. Through-pore structure reduces the areal mass density of current collector, which is favorable for increasing the ratio of active materials to inactive components. In addition, through pores allow accessibility of electrolyte to both sides of the electrode, thus increasing the utilization efficiency of active materials.
At present, metallic foams, mainly nickel (Ni) and copper (Cu) foams produced by using plastic foams as sacrificing templates, are frequently used as the current collectors in energy storage devices due to their through-pore structure, three-dimensional network, high surface area, and commercial availability (Li et al., 2018a, Ren et al., 2016, Chen et al., 2013, He et al., 2016, Wang et al., 2015). Nevertheless, the large thickness (>100 μm) and high areal mass density (>260 g m−2) of the metallic foams introduce a high proportion of inactive components, seriously reducing the energy density based on the packaged cell. Due to the large pore size (>100 μm), the pore volume cannot be fully utilized, leaving too much inactive space after growing active materials, which is unfavorable for the enhancement of volumetric energy density. Besides, the rigid and fragile nature of metallic foams makes it difficult to fabricate a flexible cell, whereas the ever-growing demand for flexible and wearable energy storage devices in the market has put the flexibility of current collector in a prominent position (Yu et al., 2014a, Yu et al., 2014b, Zhang et al., 2017, Bao et al., 2017, Fu et al., 2016, Li et al., 2018b, Zhu et al., 2018, Wang et al., 2014). Furthermore, the production of these metallic foams requires calcination, reduction, and annealing processes, which increase the cost and cause emission pollution (Shukla et al., 2001). Therefore, it is highly desired to develop a new metallic current collector with appropriate through-pore structure, low areal mass density, small thickness, and excellent flexibility.
Recently, we prepared a through-pore structured Ni film (TPNF) with controlled pore structure by electrodeposition on silkscreen printed templates, which shows excellent performance as the matrix of rechargeable Ni-metal hydride battery (Ren et al., 2018). In this article, we develop a new technology to produce free-standing TPNFs with much smaller pore size and higher pore density by combining laser drilling and electrodeposition. By using the laser drilling technique, pore arrays were drilled on a stainless steel sheet, which were subsequently filled with epoxy resin, obtaining the template for Ni deposition. Owing to the insulating nature of epoxy resin, Ni could only be deposited on the nonporous area of stainless steel sheet, forming porous films. After peeling the Ni layer off from the template surface, free-standing TPNFs were obtained. By using TPNFs as the current collector, we fabricated solid-state asymmetric supercapacitors, which show high true performance and excellent flexibility. To demonstrate the superiority of the TPNF current collector, a nonporous Ni film and commercial Ni foam were employed as comparison in this article.
Results
Preparation of TPNFs with Excellent Porous Structure
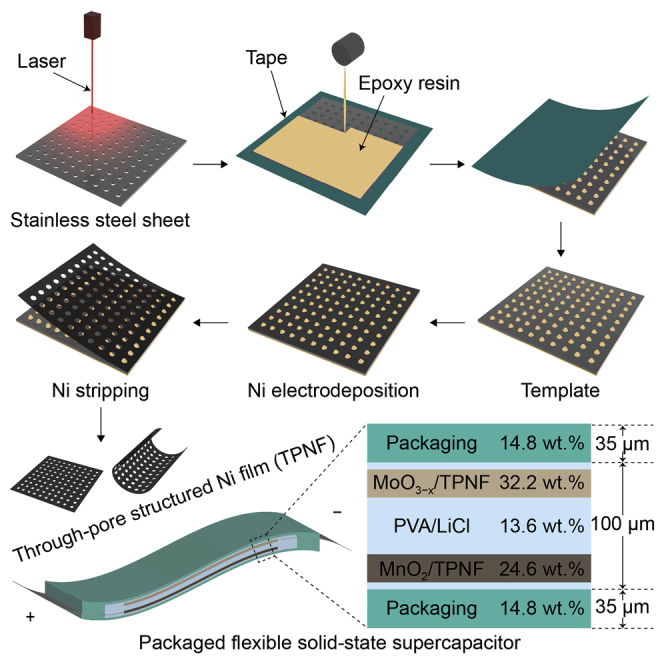
Figure 1 depicts the detailed procedure for producing TPNFs. A laser machine was used to drill through pores on a stainless steel sheet (Figure 1A). A tape was stuck on one side of the porous stainless steel sheet. Epoxy resin was subsequently filled in the pores (Figures 1B and 1C). Then, the tape was removed (Figures 1D and 1E). After the epoxy resin dried, the stainless steel sheet filled with epoxy resin was employed as the template to deposit Ni (Figure 1F). After a certain time of deposition, the Ni layer was stripped from the template and free-standing TPNFs were obtained (Figure 1G).
Figure 1.

A Schematic Illustrating Fabrication of TPNF
(A) Drilling through pores on a stainless steel sheet.
(B) Sticking a tape on one side of the porous stainless steel sheet and pouring epoxy resin on the other side.
(C) Standing for a while to make the pores fully filled with epoxy resin.
(D) Peeling off the tape.
(E) Obtained template.
(F) Ni electrodeposition on template.
(G) Ni stripping.
See also Transparent Methods.
Figures 2A and 2B show the low- and high-magnification scanning electron micrographs of the porous stainless steel sheet, respectively. The pore size is 20 μm, and the distance between the edges of two adjacent pores (named as rib width hereafter) is 35 μm. Figure 2C shows the scanning electron micrograph of a pore filled with epoxy resin. It is observed that the epoxy resin and stainless steel sheet are seamlessly bonded, which is important for obtaining smooth TPNFs and their stripping. Figures 2D and 2E show the scanning electron micrographs of the two sides of the obtained TPNFs. The back and front sides are defined as those close to and away from the template surface, respectively. The two sides show about similar appearance. As expected, the pore shape, size, and rib width of TPNFs resemble those of the template. The TPNFs possess a high pore density of 40,000 pores cm−2, by counting the number of through pores in a specified area of the scanning electron micrographs. This value is much larger than that of Ni foam (≈2–52 pores cm−2). Correspondingly, a surface area of ≈0.38 m2 g−1 is obtained, which is much higher than that of the Ni foam (≈0.16 m2 g−1) (Xu et al., 2016) and nonporous Ni film with a thickness of 2.5 μm (≈0.04 m2 g−1). TPNFs with different thicknesses were produced by monitoring the deposition time and current density (Figures 2F and S1). When depositing for 2 hr at 1 mA cm−2, we produced a TPNF with an ultrasmall thickness of 2.5 μm, as indicated by the cross-sectional image (Figure 2F). The TPNFs possess a low areal mass density of 13.5 g m−2, which is lower than ≈25 g m−2 of the nonporous Ni film (2.5 μm in thickness) and 260 g m−2 of the Ni foam (200 μm in thickness). The present technique is capable of producing large-area TPNFs, which is dependent on the size of template. Figure 2G shows the optical images of a TPNF with an area of 8 × 10 cm2. Due to the small thickness and the presence of numerous through pores, the TPNF shows a translucent nature. As shown in Figure 2H, the TPNF can float on water easily, indicating its lightness. Then, we wrapped the TPNF tightly on a thin glass rod (Figure 2I). After unfolding, the TPNF was restored to the original state, implying its excellent flexibility and mechanical strength (Figure 2J). In addition, the TPNFs possess a high conductivity of 2 × 10⁶ S m−1, which is more than two orders of magnitude higher than 1.43 × 10⁴ S m−1 of Ni foam. In principle, the template can be used many times, lowering the production cost. As shown in Figure S2, by using the same template, the TPNF prepared for the 15th time is identical that prepared for the first one, indicating the high working stability of the template.
Figure 2.

Characterization of Template and TPNF
(A and B) Low- (A) and high- (B) magnification scanning electron micrographs of porous stainless steel sheet. Scale bars: 500 μm in (A) and 200 μm in (B).
(C) Scanning electron micrograph of template showing a pore filled with epoxy resin. Scale bar, 10 μm.
(D and E) Scanning electron micrographs of front (D) and back (E) sides of TPNF. Scale bars, 200 μm. Insets: high-magnification scanning electron micrographs. Scale bars in insets, 20 μm.
(F) Cross-sectional scanning electron micrograph of the TPNF deposited for 2 hr at 1 mA cm−2. Scale bar, 5 μm.
(G) Optical image of a large-area TPNF (8 × 10 cm2) showing the translucency. Scale bar, 2 cm.
(H) Optical image of the TPNF floating on water, indicating the lightness. Scale bar, 5 cm.
(I and J) Optical images of the TPNF wrapped on a thin glass rod (I) and unfolded (J), showing the flexibility. Scale bars, 2 cm.
See also Figure S1.
Fabrication of MnO2 Electrodes with High Active Mass Loading
Then we used the TPNFs as current collectors to fabricate supercapacitor electrodes. MnO2 was selected as the active material and deposited on the TPNFs to form binder-free electrodes. Binder-free electrodes decrease the proportion of inactive components and the electrical resistance caused by the binder. The details of the preparation process are described in the Transparent Methods. For comparison, MnO2 was also deposited on the Ni foam and nonporous Ni film under the same conditions. The typical X-ray diffraction (XRD) pattern of the electrodes shows three strong peaks at 44.5°, 51.8°, and 76.4°, which can be indexed to Ni (111), (200), and (220) planes (JCPDS No. 04–0850) of the TPNF substrate, respectively (Figure S3). In addition, two weak peaks appear at 37.0° and 66.0°, which can be indexed to the (100) and (110) planes of akhtenskite MnO2 (JCPDS No. 30–0820), respectively. The X-ray photoelectron spectroscopy (XPS) spectra further prove the formation of MnO2 on the TPNFs (Figure S4).
Figures 3A–3D show the optical images of MnO2-covered TPNFs after depositing for different times. It is observed that with the increase of deposition time from 10 to 60 min, the electrodes become opaque from translucent. The calculated mass loadings of MnO2 are 0.6, 1.4, 4.3, and 8.2 mg cm−2 after depositing for 10, 20, 40, and 60 min, respectively. Figure 3E shows the scanning electron micrographs of the MnO2 deposited for 60 min. It is found that the MnO2 films deposited on the TPNFs are continuous and uniform without any cracks even at a high mass loading of 8.2 mg cm−2, indicating the superior anchoring effect of the dense through pores. On the contrary, serious cracking was observed for the MnO2 films deposited on Ni foam at the same mass loading of 8.2 mg cm−2 (Figure S5). The MnO2 films are composed of vertically grown nanosheets, which interlace to form porous structure (Figures 3F and S6). The average thickness of the nanosheets is as small as <10 nm. The small thickness and interspace of MnO2 nanosheets make them fully exposed to the electrolyte, which could increase their utilization efficiency. MnO2 nanosheets also grew on the side walls of the through pores, resulting in the formation of funnel-like morphology with slope surface (Figures 3G and 3H). Due to the growth of MnO2 nanosheets, the diameter of the through pores decreased sharply, leaving a very small through pore of only hundreds of nanometers in diameter finally at the funnel center (Figure 3G). As a result, MnO2 films on the TPNFs present a unique undulating morphology, rising and falling at the rib and pore areas, respectively, which can be vividly observed in the oblique view image shown in Figure 3H. Obviously, generation of through pores in the TPNFs could increase the mass loading of active materials due to growth on the side walls compared with the nonporous metallic foils. The small pore size that remains after growing MnO2 nanosheets ensures full utilization of the space in TPNFs, avoiding the volume waste occurring for Ni foam simultaneously (Figure S5). The thickness and crystal structure of the nanosheets were also observed in high-resolution transmission electron microscopic (HRTEM) images (Figure S7). From the nanosheets standing on the sample holder, it was observed that the nanosheets are generally smaller than 10 nm in thickness, in good agreement with the scanning electron micrographs and low-magnification TEM images. On an HRTEM image taken from a nanosheet lying flat on the sample holder, lattice fringes with interplanar spacings of 0.242 and 0.163 nm were observed, corresponding to (100) and (102) planes of akhtenskite MnO2, respectively. Selected-area electron diffraction (SAED) pattern shows observable diffraction rings corresponding to (100) and (102) planes of akhtenskite MnO2. These results are in accordance with the measured XRD results.
Figure 3.

Materials Characterization of MnO2 Deposited on TPNFs
(A–D) Optical images of the electrodes deposited for 10 min (A), 20 min (B), 40 min (C), and 60 min (D). Scale bars, 1 cm.
(E) Scanning electron micrograph of the electrode deposited for 60 min. Scale bar, 200 μm. Inset: higher magnification scanning electron micrograph. Scale bar in inset, 20 μm.
(F and G) Scanning electron micrographs of MnO2 nanosheets deposited for 60 min at the rib (F) and pore (G) regions. Scale bars, 500 nm.
(H) Scanning electron micrograph of the electrode deposited for 60 min taken by tilting the sample. Scale bar, 10 μm.
(I and J) EDX mapping images of Mn (I) and O (J) elements taken from (G). Scale bars, 500 nm.
(K) Composition distribution along a line shown in (G).
(L) Optical image of the electrode deposited for 60 min under ultrasonic vibration. Scale bar, 1 cm.
See also Figures S2–S8.
Figures 3I and 3J show the energy-dispersive X-ray (EDX) mapping images of Mn and O elements corresponding to the area shown in Figure 3G, which reveal that the two elements distribute uniformly on the TPNFs, confirming uniform growth of MnO2 nanosheets. Analogous to the scanning electron micrograph in Figure 3G, Mn and O elements form a funnel shape with a greatly shrunk through pore at the center in the mapping images. The diameter of the remaining through pore is ≈ 260 nm, which is obtained from the Mn distribution (Figure 3I). Figure 3K shows the composition distribution curves measured by EDX along the line across the pore shown in Figure 3G. The curve shape well reflects the funnel shape of the MnO2 film at the pore region. The diameter of the remaining through pore obtained from the curves is similar to that obtained from the Mn mapping image. As the deposition time further increased to 80 min, the mass loading of MnO2 nanosheets reached 11.7 mg cm−2 and the nanosheets on the side walls merged with each other and fully filled the through pores (Figure S8). Retaining the through pores during the growth process of MnO2 nanosheets is important, which could make the active materials more exposed to the electrolyte. To test the adhering strength of the nanosheets on TPNFs, we put the electrode deposited for 60 min in water under ultrasonic vibration (Figure 3L). During the ultrasonic vibration, no obvious detachment of MnO2 was observed, demonstrating the strong adhesion of MnO2 nanosheets on TPNFs. This high mechanical stability is an important favorable condition to obtain high electrochemical stability of the electrodes. We compared the mass percentage of MnO2 active materials in the electrodes prepared using different current collectors. At the same mass loading of 8.2 mg cm−2, the mass ratio of MnO2 to current collector is as high as 6.1 when using TPNF (2.5 μm in thickness) as the current collector, which is higher than 3.3 and 0.3 for the electrodes using nonporous Ni film (2.5 μm in thickness) and Ni foam (200 μm in thickness, the thinnest obtained commercially) as the current collectors, respectively. This is ascribed to the high-density through pores and low areal mass density of TPNFs. The low areal mass density of TPNF current collector and the high mass loading of MnO2 nanosheets increase the energy density based on the total cell weight.
Effect of Current Collectors on Electrode Performance
We tested the electrochemical performance of the MnO2/TPNF electrodes depositing MnO2 for different times in a three-electrode system in 5 mol L−1 LiCl electrolyte. Figure 4A shows the cyclic voltammetry (CV) curves of the electrodes tested at a scan rate of 100 mV s−1. All of them present a rectangle-like shape even at high mass loadings, meaning ideal capacitive behavior and fast charge/discharge trait for the electrodes. As the mass loading increased from 0.6 to 8.2 mg cm−2, the enclosed area of CV curves increased, implying the increase of areal specific capacitance. When the mass loading further increased to 11.7 mg cm−2, the specific capacitance decreased. This should be because the penetrating depth of electrolyte is below the thickness of active materials and the electrolyte is unable to penetrate into the active materials from the side walls due to disappearance of the through pores at too high mass loading, resulting in the decrease of utilization efficiency of active materials. For comparison, we also tested the MnO2 electrodes on Ni foam and nonporous Ni film with the same mass loading, as shown in Figure 4B. It is indicated that the MnO2/TPNF electrode shows better capacitive performance as its CV curve is closer to rectangular shape. The enclosed area of the CV curve for MnO2/TPNF electrode is much larger than those for MnO2/Ni foam and MnO2/nonporous Ni film electrodes. The corresponding galvanostatic charge/discharge (GCD) curve for the MnO2/TPNF electrode shows much longer discharge time than the other two electrodes at a current density of 7 mA cm−2 (Figure 4C). These results indicate that the TPNF is far superior to Ni foam and nonporous Ni film as the current collector.
Figure 4.

Electrochemical Characterization of MnO2 Electrodes
(A) CV curves of MnO2 nanosheets on TPNFs with different mass loadings at 100 mV s−1.
(B) CV curves of MnO2 nanosheets on different current collectors with 8.2 mg cm−2 mass loading at 100 mV s−1.
(C) GCD curves of MnO2 nanosheets on different current collectors with 8.2 mg cm−2 mass loading at 7 mA cm−2.
(D) CV curves of MnO2 nanosheets on TPNF with 8.2 mg cm−2 mass loading at different scan rates.
(E) Specific capacitances of MnO2 nanosheets on different current collectors with 8.2 mg cm−2 mass loading at different current densities.
(F) Specific capacitances of MnO2 nanosheets on different current collectors with different mass loadings at 3.5 mA cm−2.
(G) Cycling stability of the electrodes using different current collectors with 8.2 mg cm−2 mass loading tested at 17.5 mA cm−2.
(H) Nyquist plots of the MnO2/TPNF electrodes with different mass loadings. Inset: equivalent fitting circuit and magnified Nyquist plots.
(I) Nyquist plots of the electrodes using different current collectors with 8.2 mg cm−2 mass loading. Inset: magnified Nyquist plots.
See also Figure S9.
Figure 4D shows the CV curves at different scan rates for the MnO2/TPNF electrode with 8.2 mg cm−2 mass loading. It is found that the rectangle-like shape does not change much with increase in the scan rate. GCD curves at different current densities were also measured (Figure S9). From the GCD curves, a high specific capacitance of 3.3 F cm−2 (402.4 F g−1) is calculated at a current density of 3.5 mA cm−2, which is larger than 1.7 F cm−2 (207.3 F g−1) of MnO2/Ni foam electrode and 0.6 F cm−2 (73.2 F g−1) of MnO2/nonporous Ni film electrode, respectively. Figure 4E shows the relationship between the specific capacitance and current density at a mass loading of 8.2 mg cm−2. Clearly, with the increase of current density, the specific capacitance decreases. It is noteworthy that the specific capacitance of MnO2/TPNF electrode at 70 mA cm−2 is higher than those of the other two electrodes at 3.5 mA cm−2, indicating the excellent rate performance of MnO2/TPNF electrode. Figure 4F shows the relationship between the areal specific capacitance and mass loading at a current density of 3.5 mA cm−2. For all electrodes, as the mass loading increases, the specific capacitance increases and reaches a maximum value and then decreases. At the same mass loading, MnO2/TPNF electrode shows higher specific capacitance than the other two electrodes. The electrochemical stability was measured for different electrodes at 17.5 mA cm−2 (Figure 4G). After 5,000 cycles, capacitance retentions of 89%, 65%, and 31% were obtained for the MnO2/TPNF, MnO2/Ni foam, and MnO2/nonporous Ni film electrodes, respectively. The superior performance of MnO2/TPNF electrode is ascribed to the unique structure of TPNF current collector. The high pore density and surface area of TPNF make more MnO2 nanosheets exposed to the electrolyte through the through pores, increasing the utilization efficiency of MnO2 and shortening the charge transport distance, thus increasing the specific capacitance and rate performance. Besides, the high pore density and surface area of TPNF enhances the bond strength of MnO2 nanosheets on TPNF by increasing the contact area and anchoring points, releases the internal stress of electrodes, and thus prevents the exfoliation of MnO2 nanosheets, which result in the excellent cycling stability.
Electrochemical impedance spectroscopy was used to understand the above results. The frequency range and AC perturbation are 0.01 Hz–100 kHz and 5 mV, respectively. Figure 4H shows the Nyquist plots of the electrodes at different mass loadings and the corresponding equivalent fitting circuit (inset). The intercepts in the high frequency at the horizontal axis correspond to the bulk resistance (Rb) including the electrode and electrolyte and the diameters of the semicircles correspond to the charge transfer resistance (Rct) (Zhou et al., 2013). It is indicated that as the mass loading increased from 0.6 mg cm−2 to 11.7 mg cm−2, the Rb increased from 2.2 to 15 Ω and the Rct increased from 76 to 250 Ω. Figure 4I shows the Nyquist plots of the electrodes with different current collectors. Three electrodes exhibit slightly different Rb values. However, the Rct shows a big difference, which is 250, 875, and 2,200 Ω for MnO2/TPNF, MnO2/Ni foam, and MnO2/nonporous Ni film electrodes, respectively. The difference in the Rct values can be ascribed to the difference in the pore structure and surface area of the current collectors. TPNFs possess the highest pore density and surface area. As stated above, at the same mass loading, high pore density and surface area increase the contact area and anchoring points of MnO2 nanosheets on the current collectors, which enhances the bonding and decreases the Rct at the interfaces.
Development of Supercapacitors with High True Performance and Flexibility
To evaluate the practicability of the electrodes, we assembled solid-state asymmetric supercapacitors using MnO2/TPNF as the positive electrode. MoO3−x was electrodeposited on TPNFs as the negative electrode, and polyvinyl alcohol (PVA)/LiCl gel was used both as the electrolyte and separator. The details for preparing MoO3−x electrodes and supercapacitors are described in the Transparent Methods (Supplemental Information). The scanning electron micrographs and TEM images indicate that the MoO3−x films are composed of ultrafine particles less than 80 nm with Mo and O elements uniformly distributed (Figures S10–S12). From the XRD pattern, it is indicated that MoO3−x is composed of Mo17O47 and MoO3 (Figure S13). The XPS spectra demonstrate coexistence of Mo6+ and Mo5+ in the Mo oxides (Figure S14). The HRTEM image indicates that the MoO3−x particles contain two types of crystal domains with interplanar spacings of 0.308 and 0.195 nm, which correspond to (041) plane of Mo17O47 and (061) plane of MoO3, respectively (Figure S15). This agrees well with the SAED and XRD patterns, further confirming that the MoO3−x particles are composed of Mo17O47 and MoO3 crystal domains.
Figure 5A shows the diagram of a packaged full cell. The cell was sealed using polyethylene films with a thickness of 35 μm. The optimized mass loading of MoO3−x is 11.2 mg cm−2. Correspondingly, the mass proportions of MnO2/TPNF, MoO3−x/TPNF, PVA/LiCl, and polyethylene are 24.6 wt %, 32.2 wt %, 13.6 wt %, and 29.6 wt %, respectively. The proportion of TPNF current collector is as low as 6.9 wt %. Figure 5B shows the cross-sectional scanning electron micrograph of the cell with a thickness of ≈100 μm containing electrodes and PVA/LiCl electrolyte/separator. Therefore, the total thickness of the packaged cell is as small as ≈170 μm. As shown in Figures 5C, S16, and S17, the MoO3−x electrode works well within a potential window from −0.8 to 0 V. Assuming the sum of the potential range of MnO2 and MoO3−x as the total cell voltage, the cell is expected to work in a voltage window up to 1.6 V. It is demonstrated that as the voltage window extends to 1.6 V, the CV curves still keep a quasi-rectangular shape, confirming that the cell can work well under this voltage window (Figure S18). Figure 5D shows the CV curves of an optimized cell measured at different scan rates between 0 and 1.6 V. The quasi-rectangular shapes are indicative of ideal capacitive behavior (Mefford et al., 2014, Tang et al., 2012). The triangular GCD curves at different current densities are shown in Figure 5E. The maximum specific capacitance of the cell calculated from the GCD curves reaches 169.6 F g−1 (2.4 F cm−2, 240 F cm−3) at 7.7 mA cm−2. Even at a high current density of 70 mA cm−2, the specific capacitance remains at 46.2 F g−1 (0.66 F cm−2, 66 F cm−3), indicating the excellent rate capability. With respect to cycling stability, a high capacitance retention of 90% is obtained after 5,000 charge/discharge cycles at a current density of 31.8 mA cm−2 (Figure S19). As shown in the Nyquist plot, the cell possesses low Rb (8 Ω) and Rct (25 Ω) (Figure S20).
Figure 5.

Characterization of the Packaged Flexible Solid-State Supercapacitor
(A) Diagram of a packaged full cell.
(B) Cross-sectional scanning electron micrograph of the cell. Scale bar, 50 μm.
(C) Matching of MnO2 and MoO3−x electrodes at 20 mV s−1.
(D) CV curves of the cell at different scan rates.
(E) GCD curves of the cell at different current densities.
(F and G) Ragone plots of the cell based on the packaged cell weight (F) and volume (G).
(H) Optical images of a light-emitting diode powered by two tandem cells with areas of 2 × 8 cm2 in different bending states. Scale bar, 2 cm.
See also Figures S10–S22.
The calculated gravimetric energy density of full cell based on the active materials reaches 60.3 W hr kg−1 at a power density of 434.2 W kg−1. Importantly, based on the total weight of the packaged cell containing active materials, TPNF current collector, PVA/LiCl electrolyte/separator, and packaging, our cell possesses a high energy density of 30.1 W hr kg−1 at a power density of 216.5 W kg−1 (Figure 5F). It is more than three times the energy densities of advanced commercial supercapacitors including electrochemical double layer capacitors and pseudocapacitors with different specifications (<10 W hr kg−1). On the other hand, owing to the small thickness of TPNF current collector, the maximum volumetric energy density reaches 50.4 W hr L−1 at a power density of 362.9 W L−1 (Figure 5G). This performance is much higher than that of the commercial supercapacitors. At high power density of 4.9 kW L−1, high energy density of 20.5 W hr L−1 was still obtained, further indicating the superior performance. It is noteworthy that all these high values are obtained at a high active mass loading of 19.4 mg cm−2 including MnO2 and MoO3−x, indicating the high application potential of our supercapacitors. In recent years, metal-free current collectors, especially carbon fiber cloth, have been widely used to fabricate supercapacitors (Xiao et al., 2012, Huang et al., 2018). When compared with carbon cloth (>0.3 mm in thickness), the TPNF current collector possesses much smaller thickness, which contributes to higher volumetric energy density. Besides, the areal mass density of TPNF is much lower than that of carbon cloth (126 g m−2, 0.32 mm in thickness). The low areal mass density combined with the high mass ratio of active materials to current collector endows our supercapacitors with higher gravimetric energy density. The energy densities exceed those of all the reported supercapacitors in the literatures (Yu et al., 2017, Ji et al., 2013, Huang et al., 2018, Song et al., 2017). The superior performance of our supercapacitor demonstrates that the TPNF is an excellent current collector.
To evaluate the flexibility, the cell was bent in an angle range from 0° to 180°, where the CV curves remain nearly overlapped at a scan rate of 100 mV s−1 (Figure S21). When the cell was bent in 90° angle for 1,000 times, the specific capacitance stabilized around 1.2 F cm−2 at 31.8 mA cm−2, which almost has no degradation compared with the flat state, implying superior flexibility (Figure S22). To demonstrate the capability for large-scale fabrication of this technology, we assembled two cells with an area of 2 × 8 cm2 and connected them in series. After being charged to 3.2 V, the tandem device successfully powered a red light-emitting diode (Figure 5H). Owing to the excellent flexibility, the brightness of the light-emitting diode did not change when bending the cells in different states.
Discussion
In conclusion, by combining laser drilling and electrodeposition techniques, we have developed a new flexible TPNF. The true performance of supercapacitors has been greatly enhanced by using the TPNF as the current collector. The fabricated supercapacitors exhibit excellent flexibility and very high energy densities of 50.4 W hr L−1 and 30.1 W hr kg−1 based on the packaged cell with high active mass loading, which outperform the supercapacitors in the literatures and commercial supercapacitors. Because both laser drilling and electrodeposition are industrialized techniques easily scaled up, we expect that the present technology can be used for large-scale production of TPNFs and supercapacitors. The present strategy provides a new opportunity for promoting the further development of supercapacitors by enhancing the true performance. Our study demonstrates the fabrication of through-pore structured metallic films for use in advanced energy systems and opens up a new route for enhancing the energy density of various energy storage devices.
Limitations of the Study
For the currently used laser machine, it is difficult to further decrease the pore size and increase the pore density of TPNFs, which limits further enhancement of the supercapacitor performance. It is anticipated that by employing more precise laser machines, the pore structures and areal mass density of the TPNFs can be further optimized, achieving higher true performance of the supercapacitors.
Methods
All methods can be found in the accompanying Transparent Methods supplemental file.
Acknowledgments
This work was supported by Shenzhen Basic Research Program (JCYJ20160318093244885 and JCYJ20170413112249615) and the National Natural Science Foundation of China (No. 51272057).
Author Contributions
Conceptualization, Z.R. and J.Y.; Methodology, Z.R. and J.Y.; Investigation, Z.R. and Y.L.; Writing – Original Draft, Z.R.; Supervision, J.Y.
Declaration of Interests
The authors declare no competing interests.
Published: November 30, 2018
Footnotes
Supplemental Information includes Transparent Methods and 22 figures and can be found with this article online at https://doi.org/10.1016/j.isci.2018.10.016.
Supplemental Information
References
- Bao Q., Wu J., Fan L., Ge J., Dong J., Jia J., Zeng J., Lin J. Electrodeposited NiSe2 on carbon fiber cloth as a flexible electrode for high-performance supercapacitors. J. Energy Chem. 2017;26:1252–1259. [Google Scholar]
- Conway B.E. Springer Science+Business Media, LLC; 1999. Electrochemical Supercapacitors: Scientific Fundamentals and Technological Applications. [Google Scholar]
- Chen H., Hu L., Yan Y., Che R., Chen M., Wu L. One step fabrication of ultrathin porous nickel hydroxide-manganese dioxide hybrid nanosheets for supercapacitor electrodes with excellent capacitive performance. Adv. Energy Mater. 2013;3:1636–1646. [Google Scholar]
- Fu K.K., Cheng J., Li T., Hu L. Flexible batteries: from mechanics to devices. ACS Energy Lett. 2016;1:1065–1079. [Google Scholar]
- Gogotsi Y., Simon P. True performance metrics in electrochemical energy storage. Science. 2011;334:917–918. doi: 10.1126/science.1213003. [DOI] [PubMed] [Google Scholar]
- Ghidiu M., Lukatskaya M.R., Zhao M.Q., Gogotsi Y., Barsoum M.W. Conductive two-dimensional titanium carbide ‘clay’ with high volumetric capacitance. Nature. 2014;516:78–81. doi: 10.1038/nature13970. [DOI] [PubMed] [Google Scholar]
- He D., Xing S., Sun B., Cai H., Suo H., Zhao C. Design and construction of three-dimensional flower-like CuO hierarchical nanostructures on copper foam for high performance supercapacitor. Electrochim. Acta. 2016;210:639–645. [Google Scholar]
- Huang Z.H., Song Y., Feng D.Y., Sun Z., Sun X., Liu X.X. High mass loading MnO2 with hierarchical nanostructures for supercapacitors. ACS Nano. 2018;12:3557–3567. doi: 10.1021/acsnano.8b00621. [DOI] [PubMed] [Google Scholar]
- Ji J., Zhang L.L., Ji H., Li Y., Zhao X., Bai X., Fan X., Zhang F., Ruoff R.S. Nanoporous Ni(OH)2 thin film on 3D ultrathin-graphite foam for asymmetric supercapacitor. ACS Nano. 2013;7:6237–6243. doi: 10.1021/nn4021955. [DOI] [PubMed] [Google Scholar]
- Linden D., Reddy T.B. Third Edition. McGraw-Hill; 2002. Handbook of Batteries. [Google Scholar]
- Liu L., Zhao H., Wang Y., Fang Y., Xie J., Lei Y. Evaluating the role of nanostructured current collectors in energy storage capability of supercapacitor electrodes with thick electroactive materials layers. Adv. Funct. Mater. 2018;28:1705107. [Google Scholar]
- Liu Y.H., Xu J.L., Gao X., Sun Y.L., Lv J.J., Shen S., Chen L.S., Wang S.D. Freestanding transparent metallic network based ultrathin, foldable and designable supercapacitors. Energy Environ. Sci. 2017;10:2534–2543. [Google Scholar]
- Li Q., Zhu S., Lu Y. 3D porous Cu current collector/Li-metal composite anode for stable lithium-metal batteries. Adv. Funct. Mater. 2017;27:1606422. [Google Scholar]
- Li W., Zhang B., Lin R., Ho-Kimura S., He G., Zhou X., Hu J., Parkin I.P. A dendritic nickel cobalt sulfide nanostructure for alkaline battery electrodes. Adv. Funct. Mater. 2018;28:1705937. [Google Scholar]
- Li W., Tekell M.C., Liu C., Hethcock J.A., Fan D. Flexible all-solid-state supercapacitors of high areal capacitance enabled by porous graphite foams with diverging microtubes. Adv. Funct. Mater. 2018;28:1800601. [Google Scholar]
- Meng F., Ding Y. Sub-micrometer-thick all-solid-state supercapacitors with high power and energy densities. Adv. Mater. 2011;23:4098–4102. doi: 10.1002/adma.201101678. [DOI] [PubMed] [Google Scholar]
- Miller J.R., Simon P. Electrochemical capacitors for energy management. Science. 2008;321:651–652. doi: 10.1126/science.1158736. [DOI] [PubMed] [Google Scholar]
- Mefford J.T., Hardin W.G., Dai S., Johnston K.P., Stevenson K.J. Anion charge storage through oxygen intercalation in LaMnO3 perovskite pseudocapacitor electrodes. Nat. Mater. 2014;13:726–732. doi: 10.1038/nmat4000. [DOI] [PubMed] [Google Scholar]
- Nethravathi C., Rajamathi C.R., Rajamathi M., Wang X., Gautam U.K., Golberg D., Bando Y. Cobalt hydroxide/oxide hexagonal ring–graphene hybrids through chemical etching of metal hydroxide platelets by graphene oxide: energy storage applications. ACS Nano. 2014;8:2755–2765. doi: 10.1021/nn406480g. [DOI] [PubMed] [Google Scholar]
- Ren Z., Li J., Ren Y., Wang S., Qiu Y., Yu J. Large-scale synthesis of hybrid metal oxides through metal redox mechanism for high-performance pseudocapacitors. Sci. Rep. 2016;6:20021. doi: 10.1038/srep20021. [DOI] [PMC free article] [PubMed] [Google Scholar]
- Ren Z., Yu J., Li Y., Zhi C. Tunable free-standing ultrathin porous nickel film for high performance flexible nickel–metal hydride batteries. Adv. Energy Mater. 2018;8:1702467. [Google Scholar]
- Stoller M.D., Ruoff R.S. Best practice methods for determining an electrode material’s performance for ultracapacitors. Energy Environ. Sci. 2010;3:1294–1301. [Google Scholar]
- Simon P., Gogotsi Y. Materials for electrochemical capacitors. Nat. Mater. 2008;7:845–854. doi: 10.1038/nmat2297. [DOI] [PubMed] [Google Scholar]
- Shi K., Yang X., Cranston E.D., Zhitomirsky I. Efficient lightweight supercapacitor with compression stability. Adv. Funct. Mater. 2016;26:6437–6445. [Google Scholar]
- Salunkhe R.R., Kaneti Y.V., Yamauchi Y. Metal–organic framework-derived nanoporous metal oxides toward supercapacitor applications: progress and prospects. ACS Nano. 2017;11:5293–5308. doi: 10.1021/acsnano.7b02796. [DOI] [PubMed] [Google Scholar]
- Sheng M., Zhang F., Ji B., Tong X., Tang Y. A novel tin-graphite dual-ion battery based on sodium-ion electrolyte with high energy density. Adv. Energy Mater. 2017;7:1601963. [Google Scholar]
- Song Y., Liu T., Yao B., Li M., Kou T., Huang Z.H., Feng D.Y., Wang F., Tong Y., Liu X.X. Ostwald ripening improves rate capability of high mass loading manganese oxide for supercapacitors. ACS Energy Lett. 2017;2:1752–1759. [Google Scholar]
- Shukla A.K., Venugopalan S., Hariprakash B. Nickel-based rechargeable batteries. J. Power Sources. 2001;100:125–148. [Google Scholar]
- Tang Z., Tang C.H., Gong H. A high energy density asymmetric supercapacitor from nano-architectured Ni(OH)2/carbon nanotube electrodes. Adv. Funct. Mater. 2012;22:1272–1278. [Google Scholar]
- Wang J., Zhang Q., Li X., Zhang B., Mai L., Zhang K. Smart construction of three-dimensional hierarchical tubular transition metal oxide core/shell heterostructures with high-capacity and long-cycle-life lithium storage. Nano Energy. 2015;12:437–446. [Google Scholar]
- Wang X., Liu B., Liu R., Wang Q., Hou X., Chen D., Wang R., Shen G. Fiber-based flexible all-solid-state asymmetric supercapacitors for integrated photodetecting system. Angew. Chem. Int. Ed. 2014;53:1849–1853. doi: 10.1002/anie.201307581. [DOI] [PubMed] [Google Scholar]
- Xiao X., Ding T., Yuan L., Shen Y., Zhong Q., Zhang X., Cao Y., Hu B., Zhai T., Gong L. WO3−x/MoO3−x core/shell nanowires on carbon fabric as an anode for all-solid-state asymmetric supercapacitors. Adv. Energy Mater. 2012;2:1328–1332. [Google Scholar]
- Xue Q., Gan H., Huang Y., Zhu M., Pei Z., Li H., Deng S., Liu F., Zhi C. Boron element nanowires electrode for supercapacitors. Adv. Energy Mater. 2018;8:1703117. [Google Scholar]
- Xu W., Canfield N.L., Wang D., Xiao J., Nie Z., Li X.S., Bennett W.D., Bonham C.C., Zhang J.G. An approach to make macroporous metal sheets as current collectors for lithium-ion batteries. J. Electrochem. Soc. 2010;157:A765–A769. [Google Scholar]
- Xu C., Li Z., Yang C., Zou P., Xie B., Lin Z., Zhang Z., Li B., Kang F., Wong C.P. An ultralong, highly oriented nickel-nanowire-array electrode scaffold for high-performance compressible pseudocapacitors. Adv. Mater. 2016;28:4105–4110. doi: 10.1002/adma.201505644. [DOI] [PubMed] [Google Scholar]
- Yan J., Wang Q., Wei T., Fan Z. Recent advances in design and fabrication of electrochemical supercapacitors with high energy densities. Adv. Energy Mater. 2014;4:1300816. [Google Scholar]
- Yu D., Goh K., Wang H., Wei L., Jiang W., Zhang Q., Dai L., Chen Y. Scalable synthesis of hierarchically structured carbon nanotube–graphene fibres for capacitive energy storage. Nat. Nanotechnol. 2014;9:555–562. doi: 10.1038/nnano.2014.93. [DOI] [PubMed] [Google Scholar]
- Yu D., Goh K., Zhang Q., Wei L., Wang H., Jiang W., Chen Y. Controlled functionalization of carbonaceous fibers for asymmetric solid-state micro-supercapacitors with high volumetric energy density. Adv. Mater. 2014;26:6790–6797. doi: 10.1002/adma.201403061. [DOI] [PubMed] [Google Scholar]
- Yu Y., Zhong J., Sun W., Kumar R., Koratkar N. Solid state hybrid fibrous supercapacitors produced by dead-end tube membrane ultrafiltration. Adv. Funct. Mater. 2017;27:1606461. [Google Scholar]
- Zhang Z., Huang X., Li H., Wang H., Zhao Y., Ma T. All-solid-state flexible asymmetric supercapacitors with high energy and power densities based on NiCo2S4@MnS and active carbon. J. Energy Chem. 2017;26:1260–1266. [Google Scholar]
- Zhu C., Yang P., Chao D., Wang X., Zhang X., Chen S., Tay B.K., Huang H., Zhang H., Mai W. All metal nitrides solid-state asymmetric supercapacitors. Adv. Mater. 2015;27:4566–4571. doi: 10.1002/adma.201501838. [DOI] [PubMed] [Google Scholar]
- Zhu Y.H., Yang X., Bao D., Bie X.F., Sun T., Wang S., Jiang Y.S., Zhang X.B., Yan J.M., Jiang Q. High-energy-density flexible potassium-ion battery based on patterned electrodes. Joule. 2018;2:736–746. [Google Scholar]
- Zhou C., Zhang Y., Li Y., Liu J. Construction of high-capacitance 3D CoO@polypyrrole nanowire array electrode for aqueous asymmetric supercapacitor. Nano Lett. 2013;13:2078–2085. doi: 10.1021/nl400378j. [DOI] [PubMed] [Google Scholar]
Associated Data
This section collects any data citations, data availability statements, or supplementary materials included in this article.