Abstract
SOX transcription factors have important roles during astrocyte and oligodendrocyte development, but how glial genes are specified and activated in a sub‐lineage‐specific fashion remains unknown. Here, we define glial‐specific gene expression in the developing spinal cord using single‐cell RNA‐sequencing. Moreover, by ChIP‐seq analyses we show that these glial gene sets are extensively preselected already in multipotent neural precursor cells through prebinding by SOX3. In the subsequent lineage‐restricted glial precursor cells, astrocyte genes become additionally targeted by SOX9 at DNA regions strongly enriched for Nfi binding motifs. Oligodendrocyte genes instead are prebound by SOX9 only, at sites which during oligodendrocyte maturation are targeted by SOX10. Interestingly, reporter gene assays and functional studies in the spinal cord reveal that SOX3 binding represses the synergistic activation of astrocyte genes by SOX9 and NFIA, whereas oligodendrocyte genes are activated in a combinatorial manner by SOX9 and SOX10. These genome‐wide studies demonstrate how sequentially expressed SOX proteins act on lineage‐specific regulatory DNA elements to coordinate glial gene expression both in a temporal and in a sub‐lineage‐specific fashion.
Keywords: ChIP‐seq, gliogenesis, prebinding, single‐cell RNA‐sequencing, SOX proteins
Subject Categories: Development & Differentiation, Neuroscience, Transcription
Introduction
During the development of the vertebrate central nervous system (CNS), self‐renewing stem cells located in the ventricular zone (VZ) first generate neurons, followed by the cells of the glial sub‐lineages, astrocytes and oligodendrocytes 1. The generation of differentiated progeny from neural stem cells is a stepwise process that involves lineage specification, suppression of progenitor features, and subsequent activation of neuronal or glial gene expression profiles. Although the mechanisms controlling gene expression during neurogenesis have been extensively studied, it is not understood on a genome‐wide level how glial genes are activated in a timely and sub‐lineage‐specific fashion.
The HMG‐box transcription factors of the SOX family play key roles during neuro‐ and gliogenesis. The SOXB1 proteins (SOX1, SOX2, and SOX3) are co‐expressed in most neural precursor cells (NPCs), and gain‐of‐function and loss‐of‐function studies in the developing and adult CNS have demonstrated their relevance in regulating fundamental processes, such as NPC maintenance, proliferation, and neuronal cell fate specification 2, 3, 4, 5, 6. Consistent with their diverse roles during neurogenesis, genome‐wide binding studies have shown that SOX2 and SOX3, apart from binding a wide array of genes expressed in NPCs, also prebind a large number of silent genes that are first activated in differentiating neurons 7, 8. As NPCs commit to neuronal differentiation, SOXB1 proteins are downregulated and their binding is, at many DNA regions, replaced by the subsequently expressed SOXC transcription factors SOX4 and SOX11, which results in activation of neuronal genes 7, 9.
The generation of astrocytes and oligodendrocytes from glial precursor cells (GPCs) is regulated by the SOXE proteins, SOX9 and SOX10 10. The expression of SOX9 is first detected in the VZ of the mouse spinal cord around embryonic day (E) 10.5, just prior to the onset of gliogenesis 11. SOX9 continues to be expressed in maturing astrocytes but is also transiently expressed in migratory oligodendrocytes undergoing differentiation. Interestingly, conditional deletion of Sox9 leads to an extended period of neurogenesis and a significant delay in the onset of gliogenesis 12. The role of SOX9 in regulating gliogenesis appears, at least in part, to be achieved through the activation of the CCAAT‐box binding transcription factor NFIA, which is necessary for the proper initiation of gliogenesis and generation of astrocytes 13, 14.
While the loss of SOX9 leads to a permanent reduction in the number of generated astrocytes 12, the formation of oligodendrocytes is eventually restored. The recovery of oligodendrocyte formation in SOX9 mutant mice is likely due to the compensatory function of SOX10, which starts to be expressed in migrating oligodendrocyte precursors, and is maintained as these cells settle in the white matter and terminally differentiate 12. SOX10 directly regulates the expression of genes involved in myelin production, which is severely disrupted in oligodendrocytes lacking SOX10 11. While these findings demonstrate an important role of SOXE proteins at various stages of gliogenesis, it is not known how astrocyte and oligodendrocyte genes are regulated to ensure their proper temporal and sub‐lineage‐specific activation.
To examine how gliogenesis is regulated, it is necessary to understand the cell‐type‐specific gene expression profiles of developing astrocytes and oligodendrocytes. In this paper, we have conducted single‐cell RNA‐sequencing (scRNA‐seq) and defined the transcriptomes specific to the major cell types in the developing mouse spinal cord. ChIP‐seq experiments in NPCs and GPCs further show that astrocyte‐ and oligodendrocyte‐specific gene programs are extensively preselected prior to the onset of gliogenesis, through the prebinding by SOX3 and SOX9. While SOX3 prebinding correlates with the presence of active chromatin, it also prevents premature activation of astrocyte genes by SOX9. Together, these analyses reveal novel insights into how glial gene expression is regulated in a sub‐lineage and temporally defined manner.
Results
Neuronal‐ and glial‐specific gene expression revealed by scRNA‐seq
To define gene expression profiles that characterize developing neuronal and glial lineages in the CNS, we performed scRNA‐seq on CD133‐sorted precursor cells isolated from embryonic (E) day 11.5 mouse spinal cord tissue, as well as on cells randomly isolated from similar regions of E15.5 spinal cords (Fig 1A). scRNA‐seq libraries were generated using a modified Smart‐seq2 protocol 15 and sequenced on Illumina HiSeq 2000 (See Materials and Methods). Following quality control (Fig EV1), a total of 350 cells were selected for gene expression analysis. To define subtypes among the sequenced cells, their transcriptomes were analyzed through t‐distributed neighbor embedding (t‐SNE), instructed by the 495 most differentially expressed genes previously identified in bulk RNA‐seq samples of adult mouse neurons, astrocytes, and oligodendrocytes 16. The output from the t‐SNE was used to create an adjacency matrix 17 that was visualized in Igraph (CRAN), in which seven distinct cell clusters were defined through Walktrap community (Igraph; Fig 1A and B). Having delineated distinct Walktrap cell clusters, we next defined their specific gene expression signatures by cross‐comparing each of the cell clusters using the single‐cell differential expression (SCDE) software package 18 (Fig 1B; Dataset EV1). The majority of the gene expression profiles of the various Walktrap cell clusters consisted of hundreds of differentially expressed genes, but for one of the cell clusters, labeled in orange (Fig 1B), only two differentially expressed genes could be significantly defined. This cell cluster was therefore omitted from any further analysis.
Figure 1. scRNA‐seq analysis of mouse spinal cord cells.
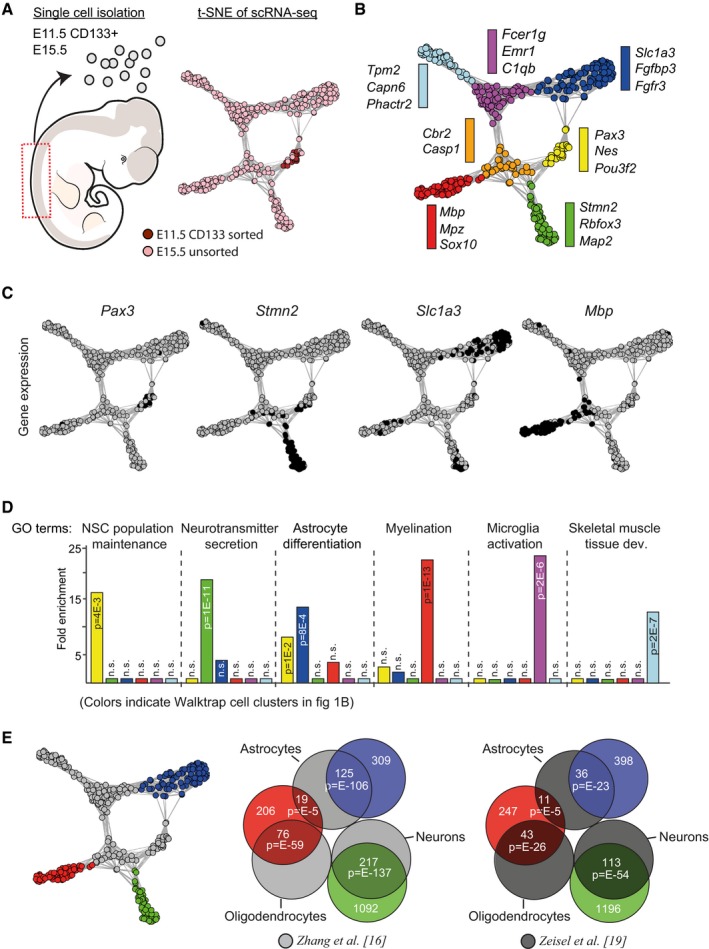
- Experimental setup for scRNA‐seq analysis. E11.5 CD133+ spinal cord progenitor cells were isolated using magnetic cell sorting (MACS), whereas E15.5 cells were randomly isolated from dissociated spinal cord tissue. Bioinformatic analyses, including t‐SNE, revealed clustering of 350 E11.5 CD133+ progenitor cells and E15.5 cells. Colors in the graph indicate cell origin (pink for E15.5 cells and brown for E11.5 cells).
- Walktrap community (Igraph) analysis of the cells revealed seven distinct cell clusters within the t‐SNE graph (colored according to the Walktrap clusters), highlighted in blue, yellow, green, red, light blue, magenta, and orange. Differential expression analysis revealed genes specifically expressed in each cell cluster. Examples of two to three specifically expressed genes from each cell cluster are presented.
- Figures show the presence of differentially expressed genes within the analyzed single cells. Black color indicates cells with RPKM values above 40 for Pax3, 300 for Stmn2, 200 for Slc1a3, and 100 for Mbp.
- GO analysis of the differentially expressed genes in each Walktrap cell cluster.
- Overlap between differentially expressed genes in three Walktrap cells clusters (marked by blue, green, and red) and genes expressed in adult murine astrocytes, oligodendrocytes, and neurons. Adult neuronal and glial expression profiles were derived from two individual studies 16, 19. P‐values (phyper, R) are calculated from the total number of genes for the mm10 assembly (23,389). Non‐significant overlaps were excluded.
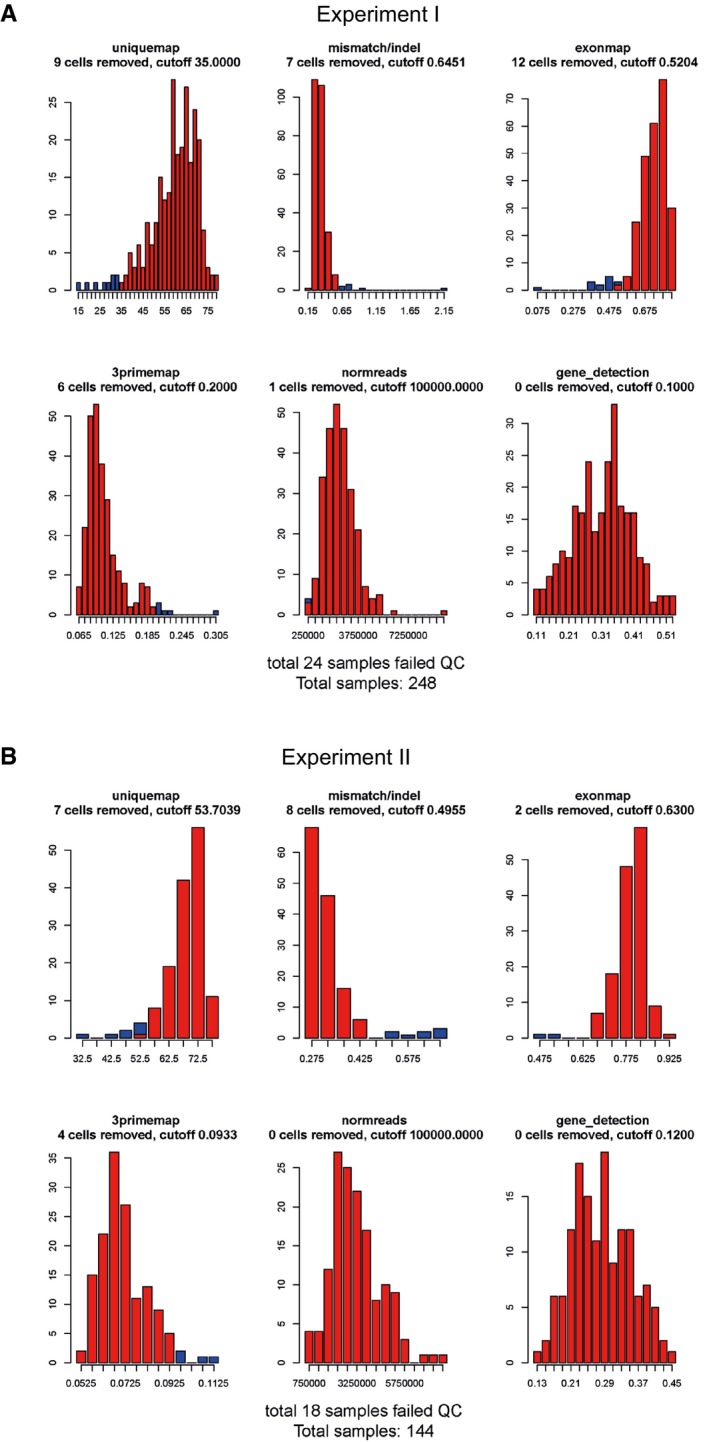
Figure EV1. Quality control (qc) for single‐cell RNA‐seq.
-
A, BHistograms showing percent uniquely mapping reads, fraction mismatches, fraction exon‐mapping reads, fraction of reads mapping to a region at the 10% most 3 prime end of each transcript, fraction of reads mapping to mRNA (for normalization), and fraction of gene detection (> 1 RPKM) from two independent experiments (in A and B). Blue bars represent samples that did not pass the filtering criteria, and red bars represent wells passing the criteria. Filtering cutoffs are indicated above each histogram (n = 392).
Within the differentially expressed gene sets of the remaining Walktrap cell clusters, we identified genes characteristic of neural precursor cells (e.g., Nes, Pax3, and Pou3f2; yellow cluster), neurons (e.g., Rbfox3, Map2, and Stmn2; green cluster), astrocytes (e.g., Slc1a3; blue cluster), and oligodendrocytes (e.g., Mbp, Mpz, and Sox10; red cluster; Fig 1B and C). Moreover, gene ontology (GO) analysis of the differentially expressed genes in the various cell clusters revealed significant enrichment of the GO terms “Neuronal stem cell population maintenance” (yellow cell cluster), “Neurotransmitter secretion” (green cell cluster), “Astrocyte differentiation” (blue cell cluster), and “Myelination” (red cell cluster), respectively (Fig 1D). The differentially expressed genes of the remaining cell clusters, marked with magenta and light blue, did not contain specific genes characteristic of cells originating within the CNS (Fig 1B), but were highly enriched for the GO terms “Microglia activation” and “Skeletal muscle tissue development”, respectively (Fig 1D).
Consistent with the results above, comparing the specific genes of the different Walktrap cell clusters to those genes previously reported to define specific cell types in the adult mouse brain 16, 19 revealed a highly significant overlap between the genes of the green, blue, and red cell clusters and the genes expressed in adult neurons, astrocytes, and oligodendrocytes, respectively (Fig 1E). The genes representing the cell cluster marked by magenta instead overlapped with genes expressed in microglia 19 (Fig EV2A). Thus, the Walktrap cell clusters appear to represent precursor cells, neurons, astrocytes, and oligodendrocytes of the developing CNS, as well as cells of mesodermal origin.
Figure EV2. Cells from E11.5 and E15.5 cluster together.
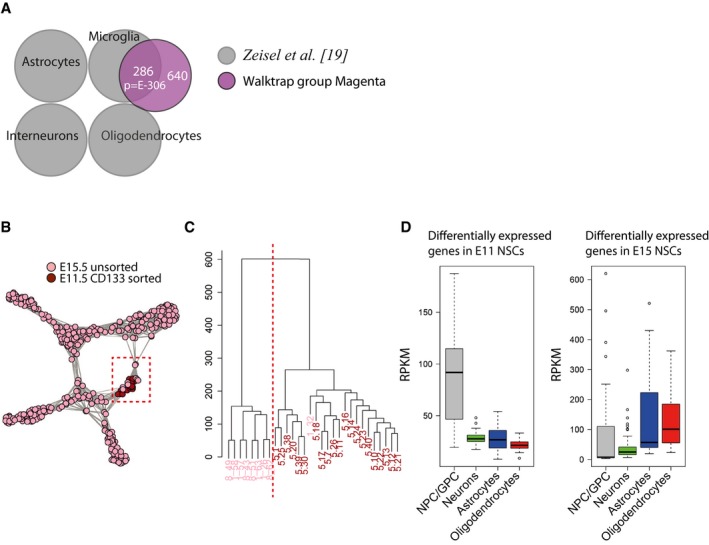
- Differentially expressed genes from Walktrap cell cluster colored by magenta significantly overlap with genes expressed in microglial cells from adult mouse brain 19. P‐values (phyper, R) are calculated from the total number of genes for mm10 (23,389).
- t‐SNE graph of cells from scRNA‐seq that were colored according to their developmental stage. Cells from E11.5 and E15.5 spinal cords were similar enough to cluster together (a Walktrap cell cluster defined as NPC/GPC, marked by red box).
- Histogram graph of cells from the NPC/GPC Walktrap cell cluster. Cells were divided into two major clusters through hclust software (R), which were highly overlapping to the developmental stages of the cells (pink E11.5; red E15.5).
- Genes that were significantly higher expressed in E11.5 progenitor cells compared to E15.5 progenitor cells were genes expressed in NPC/GPC. Genes that had increased expression in E15.5 cells were instead genes expressed in the NPC/GPC, astrocytes, and oligodendrocytes. In the boxplots, all genes expressed at RPKM > 1 are shown and include therefore genes expressed in more than one cell type. Boxplot whiskers show 1.5 IQR of highest and lowest quartile, outliers are included (dots). n = 194 for NPC/GPC, 1309 for neurons, 434 for astrocytes, and 301 for oligodendrocytes.
Notably, although progenitor cells isolated at E11.5 and E15.5 were similar enough to group together in the yellow Walktrap cell cluster, hierarchical clustering analysis 20 divided these cells into two subgroups, generally based on their developmental age (Figs 1A and EV2B and C). A comparison of the genes differentially expressed in the two subgroups, with the genes of the different Walktrap cell clusters, revealed that the separation of the precursor cells depended, at least in part, on a shift toward a glial expression profile in the E15.5 progenitor cells (Fig EV2D). Hence, the yellow progenitor cell cluster appears to consist of both NPCs and GPCs.
Glial genes are prebound by SOX3 and SOX9
ChIP‐seq studies in NPCs have demonstrated that SOX3 prebinds neuronal genes that are subsequently bound and activated by SOX4 and SOX11 in differentiating neurons 7, 9, but whether genes activated during gliogenesis are regulated in a similar fashion by sequentially acting SOX proteins is unclear. To address this, we established in vitro cultures of differentiating embryonic stem cells (ESCs), which recapitulate the sequential generation of NPCs and GPCs, and used the resulting cells to analyze the binding pattern of the NPC marker SOX3 and the GPC marker SOX9 (Figs 2A and EV3A) 21. 4 days of differentiating conditions (DDC) lead to the formation of cells expressing SOX3 both at the mRNA and protein levels and that were competent of generating differentiated TUJ1+ neurons, but not glia (Fig 2B and C). After 11 DDC, the cells additionally upregulated high mRNA and protein levels of the GPC marker SOX9, and these cells were instead competent of generating GFAP+ and SOX10+ astrocytes and oligodendrocytes, but not neurons (Fig 2B and C). Performing ChIP‐seq experiments, we next analyzed the binding pattern of SOX3 and SOX9, as well as the active chromatin marker H3K27Ac 22, within the ESC‐derived NPCs and GPCs.
Figure 2. Glial genes are prebound in NPCs.
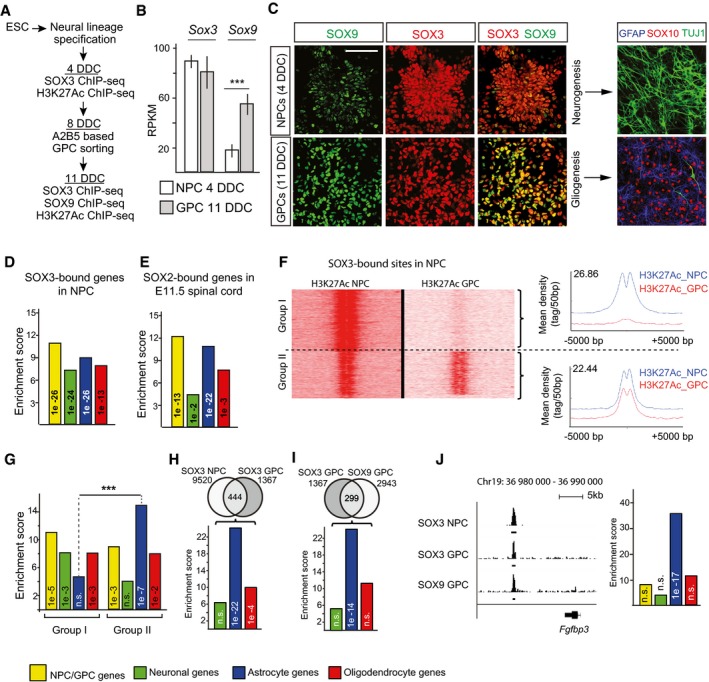
- Experimental setup for ESC‐based in vitro derivation of NPCs (4 days of differentiation condition, DDC) and GPCs (11 DDC). Time points for SOX3, SOX9, and H3K27Ac ChIP‐seq experiments are as indicated.
- Expression (RPKM) of Sox3 and Sox9 in NPC and GPC cultures from RNA‐seq experiments. Results are represented as mean ± SEM from three to four experiments (n = 3 for NPC and n = 4 for GPC, *** equals P = 4 × 10⁻⁵, t‐test).
- Immunohistochemical analysis of SOX3 and SOX9 expression in ESC‐derived NPC and GPC cultures. Analysis of TUJ1, GFAP, and SOX10 protein expression in differentiated cultures revealed that NPCs give rise to neurons and GPCs to astrocytes and oligodendrocytes. Scale bar: 40 μm.
- Bar graph shows enrichment of genes bound by SOX3 in NPCs within the differentially expressed gene sets. Yellow bar represents enrichment within NPC/GPC genes, green bar within neuronal genes, blue bar within astrocytic genes, and red bar within oligodendrocytic genes.
- Bar graph shows enrichment of genes bound by SOX2 in mouse E11 spinal cord within the different gene sets. SOX2 data from Ref. 23.
- H3K27Ac read density in NPCs or GPCs around DNA regions bound by SOX3 in NPCs. SOX3 DNA regions with different H3K27Ac read density patterns in NPCs and GPCs were categorized as group I and II loci. Graphs show the mean read density of H3K27Ac in NPCs and GPCs at group I and II loci.
- Expression pattern of genes associated with group I and II loci (from Fig 2E) within differentially expressed gene sets. Significance calculated by prop.test R, ***P < 0.001.
- Venn diagram shows overlap between SOX3 binding in NPCs and GPCs. Bar graph shows expression pattern of genes continuously bound by SOX3 NPCs and GPCs.
- Venn diagram shows overlap between SOX3 and SOX9 binding in GPCs. Bar graph shows expression pattern of genes co‐bound by SOX3 and SOX9 in GPCs.
- ChIP‐seq peak graphics around the astrocyte gene Fgfbp3. ChIP‐seq peaks are derived from three different experiments: SOX3 ChIPs in NPCs, SOX3 ChIPs in GPCs, and SOX9 ChIPs in GPCs. Both ChIP‐seq reads and called peak regions (underlying black lines) are shown for all data sets. Bar graphs show the distribution of differentially expressed genes that are bound by all three factors. P‐Values (phyper, R) are calculated from the total number of protein‐coding genes in mm10 assembly (23,389).
Figure EV3. Supportive data for SOX ChIP‐seq experiments.
-
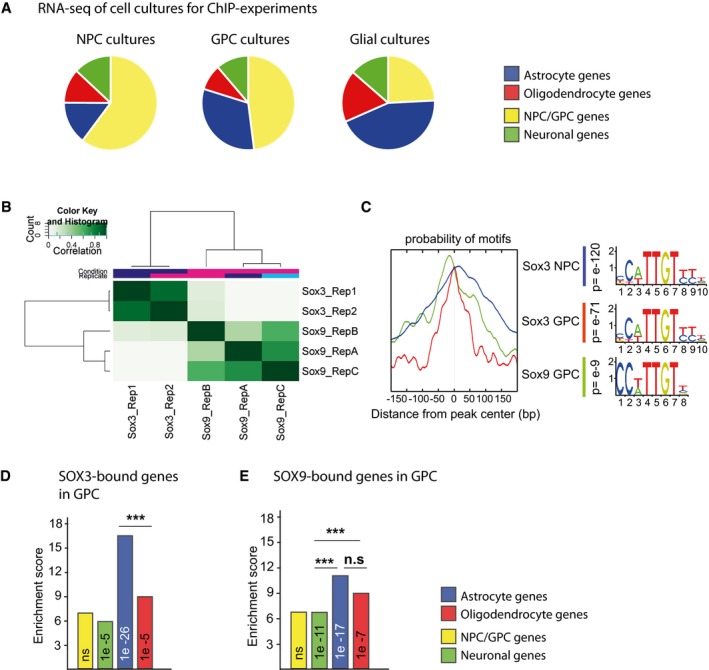
AGene expression of RNA‐seq of NPC and GPC cultures used for ChIP‐seq experiments and their correlation to differentially expressed genes in NPC/GPC, neuronal, astrocytic, and oligodendrocyte cell clusters from scRNA‐seq. NPC and GPC cultures correlate mostly to the NPC/GPC‐specific genes from scRNA‐seq. Also, correlation of gene expression from the GPC‐derived glial culture is shown. In the graphs, all genes expressed at RPKM > 1 are shown and include therefore genes expressed in more than one cell type.
-
BHistogram showing the correlation between ChIP experiments for SOX3 (two replicates) and SOX9 (three replicates) in GPCs.
-
CSox DNA motifs were centrally enriched in consensus peaks (from replicates shown in A) for SOX3 ChIPs in GPCs and SOX9 in GPCs. Peaks from SOX3 ChIP experiments in NPCs also contain centrally enriched Sox motifs 7.
-
D, E(D) Correlation between SOX3‐bound genes in GPCs and genes specifically expressed in NPC/GPC, neurons, astrocytes, and oligodendrocytes. (E) Correlation between SOX9‐bound genes in GPCs and genes specifically expressed in NPC/GPC, neurons, astrocytes, and oligodendrocytes. P‐values (phyper, R) are calculated using the total number of protein‐coding genes in mm10 assembly (23,389). Significance calculated by prop.test R, ***P > 0.001, based on the size of the gene groups (NPC/GPC = 194, neurons = 1309, astrocytes = 434, oligodendrocytes = 301).
Comparing the genes bound by SOX3 in NPCs 7 with the differentially expressed genes of the defined Walktrap cell clusters demonstrated that SOX3, apart from targeting many genes expressed in precursor cells and neurons, also prebound many genes that are first activated in developing astrocytes and oligodendrocytes (Fig 2D). Interestingly, the prebinding of glial genes could also be detected with SOX2 ChIP‐seq experiments on mouse spinal cord E11.5 NPCs (Fig 2E) 23. Moreover, focusing on DNA regions targeted by SOX3 in NPCs we next mapped H3K27Ac ChIP‐seq read density in NPCs and GPCs. These analyses revealed one subset of active chromatin regions that could only be detected in NPCs (Fig 2F) and another subset of active chromatin that were observed in both NPCs and GPCs (Fig 2F). Interestingly, enrichment analysis showed that DNA regions with high levels of H3K27Ac ChIP‐seq read density in NPCs (group I loci) were associated with genes expressed in NPCs, neurons, or oligodendrocytes, but not astrocytes (Fig 2G). In contrast, DNA regions with high levels of H3K27Ac in both NPCs and GPCs (group II loci) were strongly enriched around genes specifically expressed in astrocytes (Fig 2G). Thus, although SOX3 prebinds many chromatin regions in NPCs that are associated with both neuronal and glial genes, it is mainly those in the proximity of astrocyte‐specific genes that remain active in GPCs.
The SOX3‐ and SOX9‐based ChIP‐seq experiments in GPCs resulted in the identification of thousands of significant peaks for both the transcription factors (Dataset EV2). The different DNA regions targeted by SOX3 and SOX9 showed a high internal concordance between the different ChIP‐seq replicates, as well as centrally enriched SOX DNA‐binding motifs within the consensus peak sets (Fig EV3B and C). SOX3 targeted many new sites in GPC, but approximately one‐third of its binding sites were conserved from NPCs (Fig 2H). Consistent with the finding that mainly astrocyte‐specific genes maintained an association with H3K27Ac between NPC and GPC stages (Fig 2G), astrocyte genes were also most strongly enriched among the genes that were bound by SOX3 in both NPCs and GPCs (Figs 2H and EV3D). The binding of SOX9 was primarily enriched around genes specifically expressed in astrocytes and oligodendrocytes (Fig EV3E). Moreover, SOX9 shared a significant portion of its targets with SOX3 in GPCs (Fig 2I). Interestingly, the majority of these DNA regions were also bound by SOX3 in NPCs (Fig 2J) and were specifically and highly enriched in the vicinity of genes expressed in astrocytes (Fig 2J). Hence, while both astrocyte‐ and oligodendrocyte‐specific genes are prebound by SOX9 in GPCs, a specific feature of astrocyte genes is that this prebinding occurs in conjunction with SOX3.
Prebound genes are expressed throughout glial differentiation
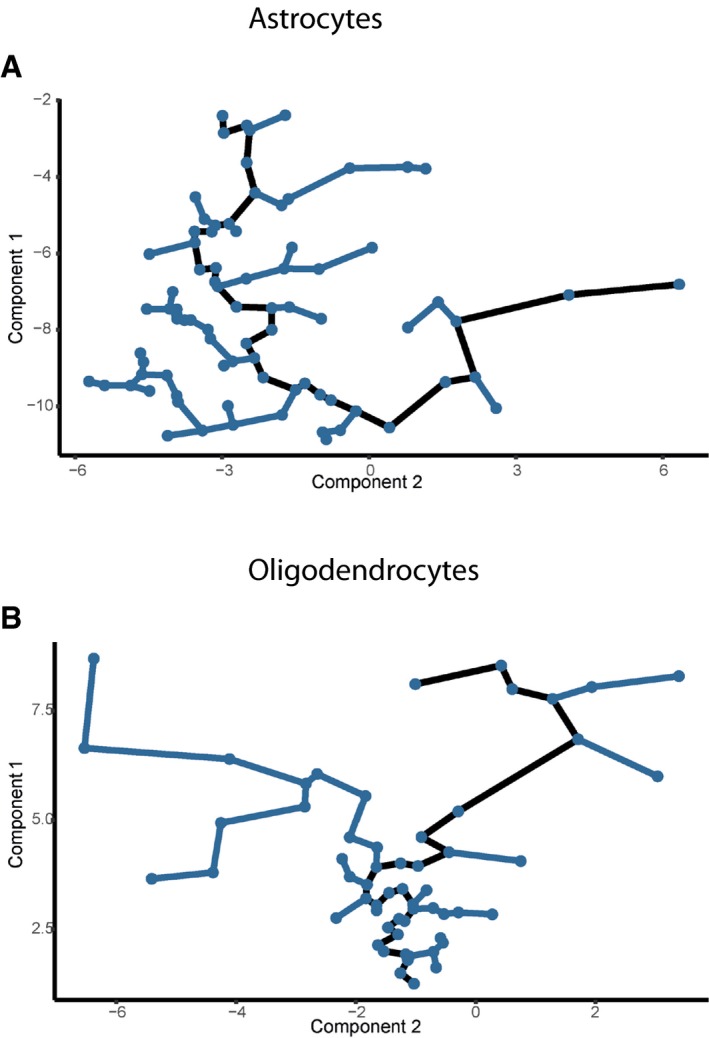
The observation that SOX3 and SOX9 prebind silent glial genes raised the question about the timing during astrocyte and oligodendrocyte differentiation these genes start to be expressed. To address this issue, we first employed Monocle 24 to position cells of the astrocyte and oligodendrocyte Walktrap cell clusters along pseudotime axes, representing glial maturation (Fig EV4). Gene expression analysis revealed that the astrocyte genes, Sox9 and Slc1a3 (Fig 1B), increased strongly along the astrocyte pseudotime axis (Fig 3A), confirming an accurate positioning of these cells based on their maturation. Moreover, we could not detect expression of the neuronal marker Rbfox3 or the oligodendrocyte gene Mbp within these cells (Figs 1B and 3A). Along the oligodendrocyte pseudotime axis, we instead detected increasing expression of Mbp and Sox10 (Fig 3B), whereas Sox9 had the opposite expression pattern and was gradually decreased with maturation (Fig 3B). Expression of Rbfox3 could not be detected in maturing oligodendrocytes (Fig 3B).
Figure EV4. Astrocytes and Oligodendrocytes arranged in a pseudotemporal order.
-
A, BCell expression profiles (points) for astrocytes (A) and oligodendrocytes (B) in a two‐dimensional independent component space. Black lines indicate the main backbones of Monocle's pseudotime ordering of the cells.
Figure 3. SOX3 and SOX9 prebind genes expressed at both early and late stages of gliogenesis.
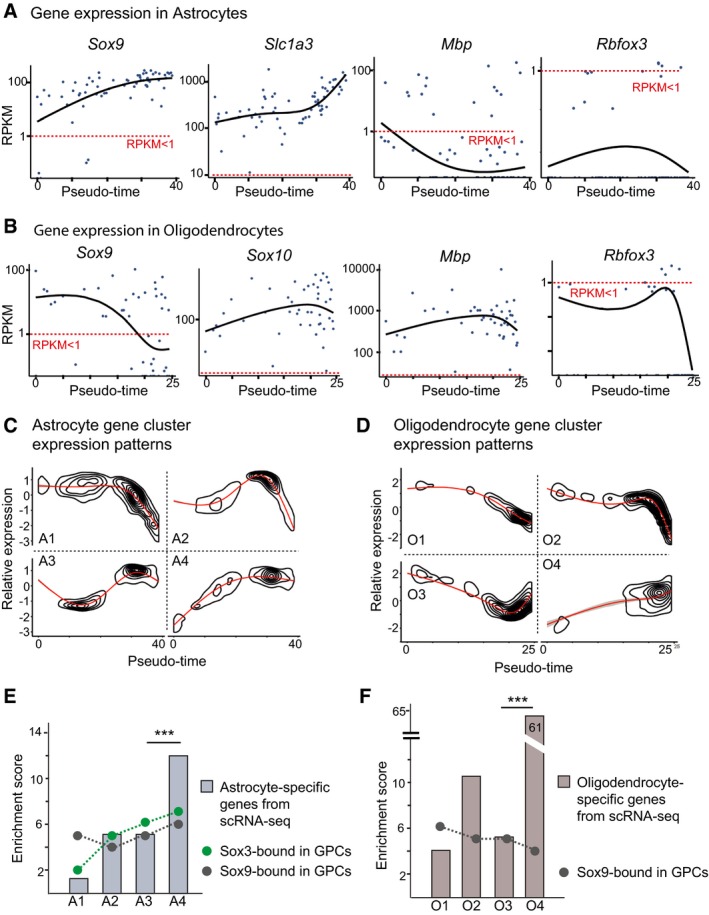
- Sox9, Slc1a3, Mbp, and Rbfox3 expression in astrocytes that have been arranged according to a pseudotemporal order. Dashed lines denote threshold levels RPKM = 1.
- Sox9, Sox10, Mbp, and Rbfox3 expression in oligodendrocytes that have been arranged according to a pseudotemporal order. Dashed lines denote threshold levels RPKM = 1.
- 4,000 randomly selected genes expressed in astrocytes (threshold RPKM > 2) were clustered into four groups (A1–A4) according to their expression patterns along the pseudotime axis.
- 4,000 randomly selected genes expressed in oligodendrocytes (threshold RPKM > 2) were clustered into four groups (O1–O4) according to their expression patterns along the pseudotime axis.
- Enrichment of astrocyte‐specific genes (from scRNA‐seq) and genes bound by SOX3 and SOX9 in GPCs in the four different astrocyte gene clusters (A1–A4), shown in panel (C). Three‐star significance equals P‐value e‐13 (prop.test, R) based on the size of the gene groups (A1 = 740, A2 = 1,019, A3 = 882, A4 = 1,236).
- Enrichment of oligodendrocyte‐specific genes (from scRNA‐seq) and genes bound by SOX3 and SOX9 in the four different oligodendrocyte gene clusters (O1–O4), shown in panel (D). Three‐star significance equals P‐value e‐16 for cluster O4 (prop.test, R) based on the size of the gene groups (O1 = 1,371, O2 = 1,451, O3 = 839, O4 = 141).
We next used Monocle to randomly sample 4000 genes from gene expression profiles (RPKM > 2) of the astrocyte and oligodendrocyte Walktrap cell clusters (Fig 1B). The selected genes were categorized into four gene clusters, depending on their expression pattern along the astrocyte and oligodendrocyte pseudotime axes (Fig 3C and D). By examining the different gene clusters for the presence of the astrocyte‐ and oligodendrocyte‐specific genes defined by our scRNA‐seq experiments (Dataset EV1), we found that these were significantly enriched in the gene clusters representing the most mature cells (clusters A4 and O4; Fig 3E and F). Thus, differential gene expression between glial subtypes appears to increase with cellular maturation. Moreover, while genes prebound by SOX9 in GPCs were evenly distributed among the four astrocyte and oligodendrocyte gene clusters (A1‐A4, O1‐O4; Fig 3E and F), genes prebound by SOX3 were preferentially activated at late stages of astrocyte development (Fig 3E).
NFIA motifs in SOX3‐ and SOX9‐bound astrocyte enhancer regions
While SOX9 is important for astrocyte development, it is also involved in the specification of oligodendrocytes together with SOX10 12 (Fig 4A). To examine how SOX9‐targeted genes are activated in a glial sub‐lineage‐specific manner, we first compared the binding pattern of SOX9 to that of SOX10 in oligodendrocytes 25. The SOX10 ChIP‐seq data set included thousands of target genes, in which oligodendrocyte‐specific genes were the most significantly enriched (Fig 4B). Interestingly, considering SOX10‐bound genes in GPCs were selectively prebound by SOX9, but not by SOX3 (Fig 2I), we identified, apart from an even further enrichment of oligodendrocyte‐specific genes (Fig 4C), also a strong enrichment of genes specifically expressed in astrocytes (Fig 4C). Thus, in GPCs, SOX9 prebinds astrocyte‐specific genes together with SOX3, and without SOX3, it prebinds astrocyte and oligodendrocyte genes that are subsequently targeted by SOX10 in oligodendrocytes (Fig 4D).
Figure 4. Enrichment of NFI binding motifs around astrocyte‐specific genes.
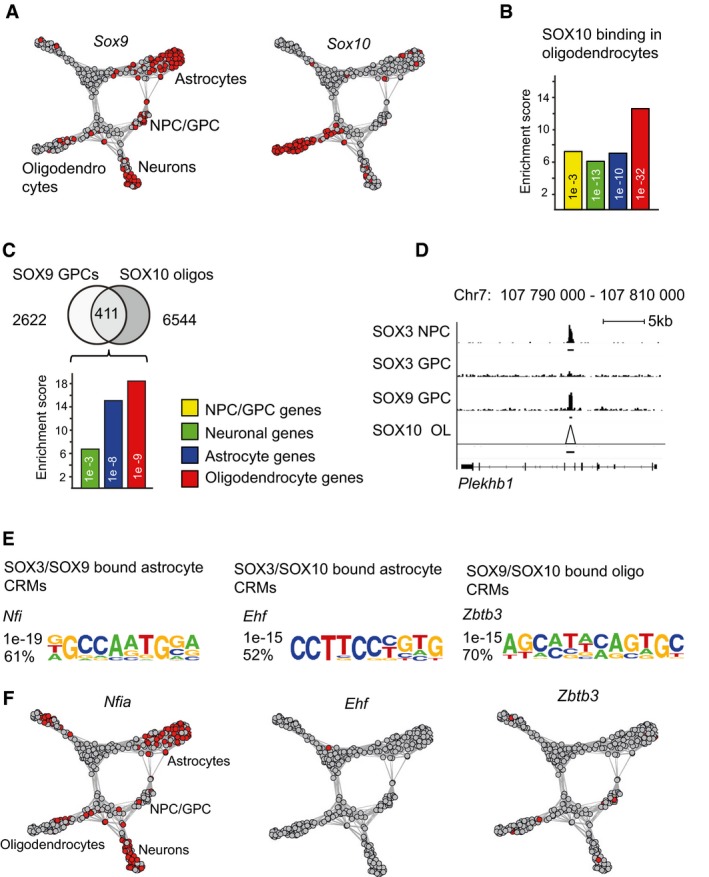
- Graphical view showing SOX9 and SOX10 expression among spinal cord cells analyzed with scRNA‐seq.
- Bar graph shows enrichment of genes bound by SOX10 in rat oligodendrocytes within the differentially expressed gene sets. Yellow bar represents enrichment within NPC/GPC genes, green bar within neuronal genes, blue bar within astrocytic genes, and red bar within oligodendrocytic genes. SOX10 ChIP‐seq data from Ref. 25.
- Venn diagram shows 2,622 SOX9‐bound sites in GPCs, which are not co‐targeted by SOX3, and their overlap with SOX10‐bound sites in mature oligodendrocytes. Bar graph shows that mostly oligodendrocyte‐specific genes are sequentially bound by SOX9 in GPCs and by SOX10 in oligodendrocytes. However, SOX9 and SOX10 also bind genes that are selectively expressed in astrocytes.
- ChIP‐seq peak graphics around the oligodendrocyte gene Plekhb1. ChIP‐seq peaks are derived from four different experiments: SOX3 ChIP‐seq in NPCs, SOX3 ChIP‐seq in GPCs, SOX9 ChIP‐seq in GPCs, and SOX10 ChIP‐seq in oligodendrocytes. Both ChIP‐seq reads and called peak regions (underlying black lines) are shown for all data sets except for SOX10, for which only called peak regions are shown (black line). Triangle in the SOX10 data set indicates called peak. SOX10 ChIP raw reads could not be transferred from rn5 to mm9 assembly, and therefore, only SOX10 peak regions are shown in the figure. Scale bar: 5 kb.
- Figure shows most strongly enriched DNA‐binding motifs within three specific peak sets: SOX3‐ and SOX9‐bound regions around astrocyte‐specific genes, SOX9‐ and SOX10‐bound regions around astrocyte‐specific genes, and SOX9‐ and SOX10‐bound regions around oligodendrocyte‐specific genes.
- Expression of Nfia, Ehf, and Zbtb3 among spinal cord cells analyzed with scRNA‐seq. Red color indicates cells with RPKM values above 55 for Nfia, 5 for Zbtb3, and 5 for Ehf. n = 3 for SOX9 and 2 for SOX3. P‐Values (phyper, R) are calculated from the total number of genes for mm10 (23,389).
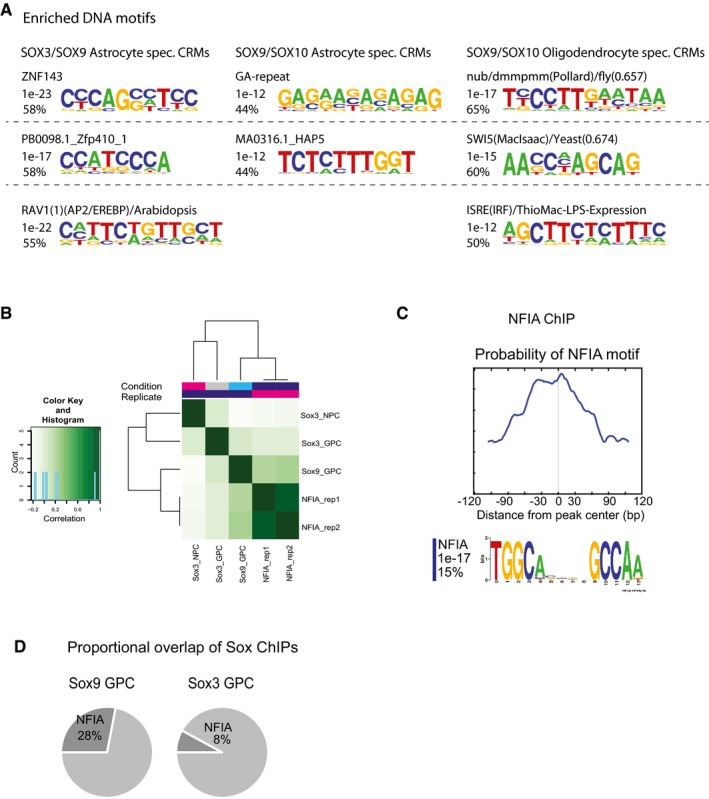
We next cross‐compared SOX9‐bound DNA regions associated with astrocyte and oligodendrocyte genes for the specific enrichment of potential partner transcription factor binding motifs. These analyses revealed that DNA regions around astrocyte genes, which are prebound by SOX9 and SOX3 in GPCs, were primarily enriched for Nfi motifs (Figs 4E and EV5A). In contrast, SOX9‐bound DNA regions that are subsequently targeted by SOX10 in oligodendrocytes were around astrocytic genes enriched for Ehf motifs (Figs 4E and EV5) and around oligodendrocyte genes enriched for Zbtb3 motifs (Figs 4E and EV5). However, among the relevant candidate transcription factors targeting the enriched DNA motifs, only Nfia, which binds Nfi motifs 13, was significantly expressed within our scRNA‐seq‐derived Walktrap cell clusters (Fig 4F; Dataset EV1). Consistently, ChIP‐seq experiments in GPCs revealed that NFIA binding was more strongly enriched at SOX9‐targeted DNA regions (28% of SOX9‐bound regions) compared to site target by SOX3 only (Fig EV5B–D). Thus, the specific enrichment of transcription factor binding motifs within SOX9‐targeted DNA regions is strongly correlated with the additional binding by SOX3 or subsequently SOX10 and whether these DNA regions are associated with astrocyte or oligodendrocyte genes.
Figure EV5. NFIA ChIP‐seq in GPCs.
-
ADNA motifs enriched in three groups of CRMs: SOX3/SOX9‐bound CRMs associated with astrocyte genes, SOX9/SOX10‐bound CRMs associated with astrocyte genes, and SOX9/SOX10 CRMs associated with oligodendrocyte genes. Figure shows the two to four most frequent motifs enriched for each group over the other two groups (the most frequent motifs from each group are shown in Fig 4E). Analysis was performed with HOMER software with default settings except for background settings (see Materials and Methods section).
-
BHistogram showing the correlation between NFIA ChIP experiments (two replicates) and SOX3 ChIP in NPC and GPC and SOX9 ChIP in GPC.
-
CCentrally enriched NFIA motifs were found in the NFIA consensus peak set.
-
DNFIA ChIP peaks overlap with 28% of Sox9‐ChIP peaks and with 8% only of the Sox3‐ChIP peaks in GPCs.
Astrocyte gene expression is prevented by SOX3
During neurogenesis, SOX3 can prevent premature activation of neuronal genes by SOX4 and SOX11 7, but whether glial gene expression is regulated similarly by sequentially expressed SOX proteins is unknown. To address this issue, prebound cis‐regulatory modules (CRMs), selected based on their conservation and on the expression of their associated glial genes (see Materials and Methods), were inserted into luciferase (luc) reporter vectors and analyzed in the mouse carcinoma cell line p19. Luc reporters containing CRMs associated with the astrocyte‐specific genes Fgfbp3 and Ttyh1, which are prebound by SOX3 and SOX9 in GPCs, were activated by SOX9 (Fig 5A). Moreover, consistent with the enrichment of Nfi motifs in these CRMs, they were synergistically activated by SOX9 and NFIA (Fig 5A), even though NFIA failed to activate the CRMs on its own (Fig 5A).
Figure 5. Sequentially acting SOX proteins control neuronal‐ and glial‐specific CRMs.
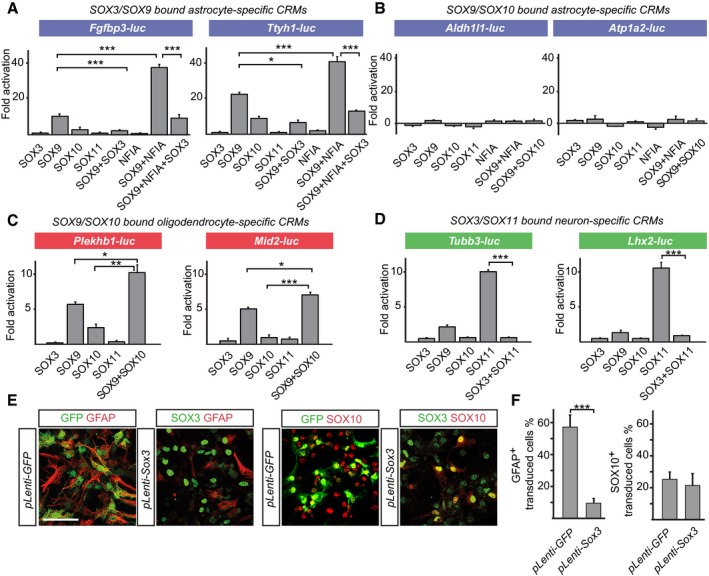
- Luc reporter assays in P19 cells. Luc reporters containing SOX3‐ and SOX9‐bound CRMs around the astrocyte‐specific genes Fgfbp3 and Ttyh1 were strongly activated by SOX9 in synergy with NFIA, an activation that could be efficiently blocked by SOX3. No activation of these reporters could be detected with SOX10 or SOX11.
- Luc reporters containing SOX9‐ and SOX10‐bound DNA regions around the astrocyte genes Aldh1l1 and Atp1a2, which are not expressed in SOX10+ oligodendrocytes, could not be activated by SOX9 or SOX10.
- Luc reporters containing SOX9‐ and SOX10‐bound CRMs around the oligodendrocyte‐specific genes Plekhb1 and Mid2 were activated in an additive manner by SOX9 and SOX10. No activation could be detected with SOX11.
- Luc reporters containing SOX3‐ and SOX11‐bound CRMs of the neuronal genes Tubb3 and Lhx2, which are sequentially bound by SOX3 and SOX11, could be activated by SOX11 and efficiently repressed by SOX3. No activation could be detected with SOX10.
- Forced expression of SOX3 for 96 h in differentiating GPCs blocked the formation of astrocytes but not oligodendrocytes. Scale bar: 25 μm.
- Statistical view of panel (E). Bars represent mean values (of three experiments) of cells expressing GFAP or SOX10 in GFP or Sox3‐transduced cells.
The regulation of CRMs that are sequentially bound by SOX9 and SOX10 in GPCs and oligodendrocytes was dependent on whether these were associated with astrocyte or oligodendrocyte genes. While astrocytic CRMs that are sequentially bound by SOX9 and SOX10 could not be activated by either of these proteins (Fig 5B), CRMs associated with the oligodendrocyte genes Plekhb1 and Mid2 were activated by SOX9 and SOX10 in an additive manner (Fig 5C). Moreover, both SOX9 and SOX10 showed a glial specificity and could not activate CRMs associated with the neuronal genes Tubb3 and Lhx2 (Fig 5D). Hence, these transactivation studies provide evidence for a high degree of functional specificity of SOX9, SOX10, and SOX11 in the activation of glial and neuronal CRMs.
While SOX3 prebinds astrocyte genes in GPCs, it failed to activate their examined CRMs and in fact significantly suppressed their activation by SOX9 and NFIA (Fig 5A). This finding raised the possibility that the presence of SOX3 negatively controls the onset of astrocyte differentiation. Consistent with this idea, lentiviral expression of SOX3 for 96 hrs in GPCs reduced the generation of GFAP+ cells fivefold (Fig 5E and F), compared to those cells transduced with a control lentivirus expressing GFP only. Interestingly, the formation of SOX10+ oligodendrocytes was not affected by high levels of SOX3 expression (Fig 5E and F).
SOX3 represses premature induction of spinal cord astrocytes by SOX9
The ability of SOX3 to counteract astrocyte gene expression and maturation in vitro raises the possibility that SOX3 hinders progenitor cells in the developing CNS from committing to premature astrocyte differentiation. To address this possibility, we used chick in ovo electroporation to either increase or decrease the activity of SOX3 in embryonic spinal cord. Consistent with the ability of SOX3 to block astrocyte gene expression, overexpression of SOX3 for 48 hrs decreased the expression of astrocyte genes FGFR2, NFIA, and Fgfr3 (Fig 6A), whereas misexpression of a dominant negative version of SOX3 (dnSOXB1) promoted cells to prematurely express these markers already 24 hrs post‐transfection (Fig 6B). High levels of SOX9 have previously been shown to induce premature astrocyte differentiation in the chick spinal cord 14. Interestingly, while misexpression of SOX9 for 24 hrs induced the expression of FGFR2, NFIA, and Fgfr3 (Fig 6C), these were efficiently blocked by co‐electroporated SOX3 (Fig 6D). Thus, SOX3 has the capacity to prevent premature astrocyte formation in the developing CNS.
Figure 6. SOX3 prevents premature astrocyte induction in the chick spinal cord.
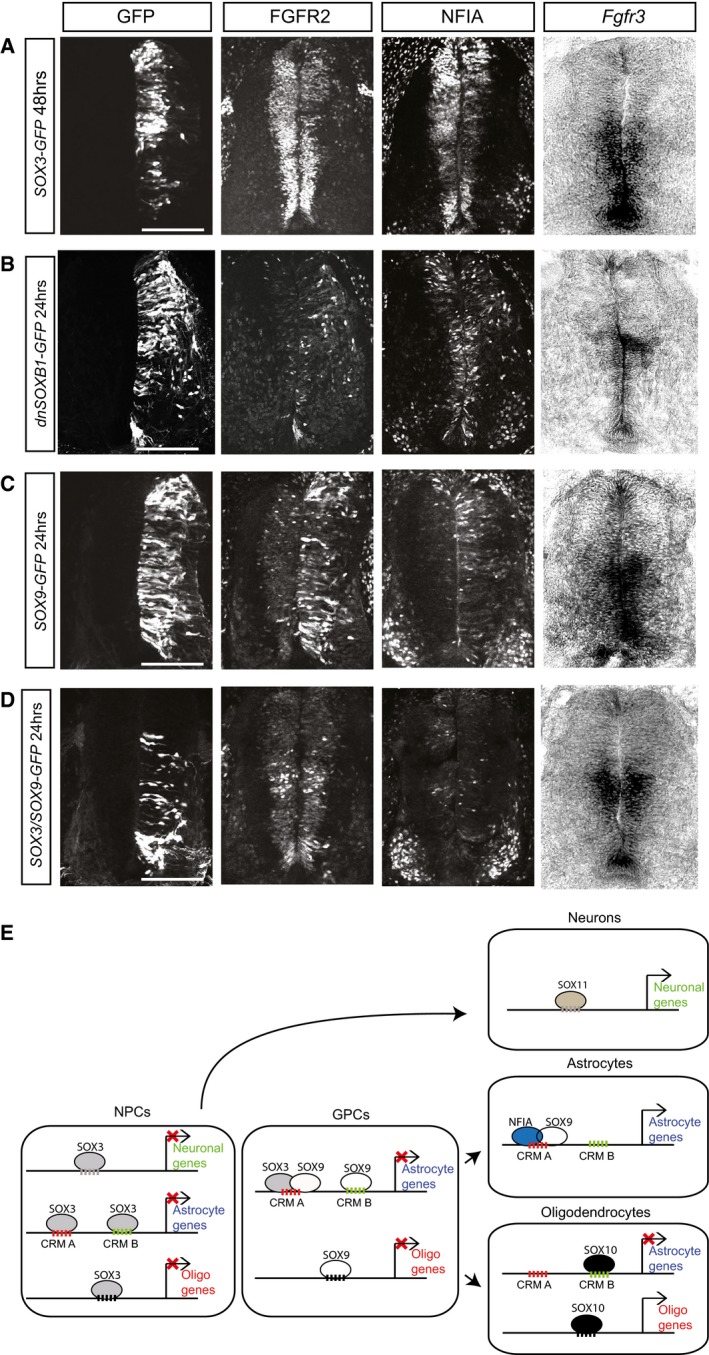
- SOX3 overexpression experiments in chicken spinal cord at E4. 48 h post‐electroporation, transfected side showed decreased expression of FGFR2, NFIA, and Fgfr3. Scale bar: 50μm.
- 24 h after miss‐expression of a dominant negative version of SOXB1 (dnSOXB1), premature expression of FGFR2, NFIA, and Fgfr3 was found in the transfected side. Scale bar: 40 μm.
- 24 h after SOX9 overexpression in chicken spinal cord (at E4), increased expression of FGFR2, NFIA, and Fgfr3 was shown compared to the un‐transfected control side. Scale bar: 40 μm.
- Sox3 and Sox9 co‐electroporation in chicken spinal cord at E4 could rescue the effect of SOX9 overexpression, and FGFR2, NFIA, and Fgfr3 levels were comparable to the un‐transfected control side. Embryos were analyzed 24 h post‐electroporation. Scale bar: 40 μm.
- Proposed model of sequentially acting SOX proteins in neuronal and glial lineage specification. Silent neuronal, astrocyte, and oligodendrocyte genes are all prebound by SOX3 in NPCs. In GPCs, transactivating astrocytic enhancers (CRM A), enriched for NFI motifs, become additionally targeted by SOX9, whereas non‐activating astrocytic enhancers (CRM B) or CRMs around oligodendrocyte genes become prebound by SOX9 only. While SOX3 represses the activation of prebound genes, neuronal and glial gene expression become activated when SOX3 is downregulated and a cellular context of activating transcription factors has developed, which according to the model can consist of SOX11 in neurons, SOX10 in oligodendrocytes, and NFIA and SOX9 in astrocytes. It should be noted that we do not provide any evidence that SOX3/SOX9 or NFIA/SOX9 physically interact or co‐bind DNA.
Discussion
In ESCs, it is well established that SOX2, apart from regulating genes necessary for the specification of the pluripotent state, also prebinds many silent genes that are first activated in the emerging embryonic lineages 26. SOX2 and SOX3 target, in a similar fashion, a significant number of silent genes in NPCs that are first expressed in neurons 6, 7. Furthermore, in this study we demonstrated how SOX3 and SOX9 preselect gene programs in NPCs and GPCs that first are activated during gliogenesis.
What role does prebinding play in regulating target gene expression? One possibility is that prebinding of genes licenses their expression by maintaining the accessibility of important CRMs for the subsequent binding of activating proteins (Fig 6E). Consistent with this idea, SOX2 has recently been demonstrated to possess pioneering functions, by facilitating the opening of chromatin regions, previously inaccessible to transcription factor binding 27. For instance, together with OCT4, KLF4, and c‐MYC, SOX2 plays a prominent role in the reprogramming of human fibroblasts into iPS cells, a function that it shares with SOX1 and SOX3 28, 29. Under these reprogramming conditions, ectopic SOX2 can target chromatin regions that are DNase I‐resistant and that lack markers of open chromatin, such as H3K27Ac and H3K4me3 30. The efficiency by which condensed chromatin is targeted may be explained by the fact that the conformation of DNA wrapped around histones widens the minor groove, which is bound by SOX2 31. Moreover, apart from their proposed pioneering functions, SOX2 and SOX3 have also been demonstrated to possess the ability to establish activating H3K4 methylation, both in hematopoietic cells 32 and in the mesodermal cell line C2C12 upon their misexpression 7. It is likely that these functions promote the formation of permissive chromatin around targeted CRMs, which in turn facilitates the expression of associated genes when a cellular context of activating transcription factors has developed (Fig 6E).
In addition to promote subsequent gene activation, prebinding by SOX2 and SOX3 also appears to prevent premature activation of the targeted genes 7. For instance, SOX2 and SOX3 have been shown to block premature activation of prebound neuronal genes 7. Furthermore, in this study we show through gain‐of function and loss‐of function experiments in vitro and in the chick spinal cord that SOX3 has a similar function during astrocyte development and that it efficiently hinders SOX9 from activating astrocytic gene expression (Fig 6). While this activity may be achieved through several indirect mechanisms, our previous observation showing that the DNA‐binding HMG domains of SOX2 and SOX3 can hinder the onset of prebound neuronal genes 7 suggests that the repression of prebound genes can be accomplished through direct competition for binding motifs with activating SOX proteins. While SOX3 performs a negative regulation of prebound astrocyte genes and their activation are dependent on the downregulation of SOX3, SOX3 expression did not affect oligodendrocyte formation. In fact, both SOX2 and SOX3 are necessary for proper oligodendrocyte differentiation by negatively regulating miR145, which in turn inhibits genes promoting myelination 33.
While SOX9 targets genes of both glial sub‐lineages, its expression within GPCs, astrocytes, and oligodendrocytes raises the question of how SOX9 can direct gene expression specificity among these cell types. In a HOMER‐based search for regulatory motifs within CRMs around astrocyte and oligodendrocyte genes, a selective enrichment of Nfi motifs was identified within astrocytic CRMs, targeted by SOX3 and SOX9. Consistently, NFIA has previously been demonstrated to promote the formation of astrocytes upon misexpression in the embryonic chick spinal cord 14 and we have provided evidence for a synergistic function between NFIA and SOX9 in the transactivation of astrocyte‐specific CRMs. Although our scRNA‐seq experiments suggest that Nfia expression is primarily confined to astrocytes, we could also detect a limited number of Nfia + cells among progenitor cells and oligodendrocytes (Fig 4E) 13, 14. In this respect, it was interesting to note that the synergistic activity between SOX9 and NFIA was significantly blocked by the presence of SOX3 and that NFIA has previously been shown to be antagonized by SOX10 in oligodendrocytes 34. Thus, NFIA activity is primarily confined to developing astrocytes and is likely to act together with SOX9 in directing gene expression specificity among glial subtypes.
Materials and Methods
Preparation of cDNA libraries, sequencing, read alignments, and quality control
E11.5 and E15.5 mouse spinal cords (thoracic region) were dissected and cells dissociated into single‐cell suspension using MACS Neural Tissue Dissociation Kit (Miltenyi Biotec, 130‐092‐628). An additional step was performed on E11.5 tissue, whereby cells were magnetically sorted using an antibody against CD133 for enrichment of neural stem cells (according to the manufacturer's recommendations; kit CD133). Single cells from E15.5 dissociated tissue and E11.5 CD133+ cells were manually picked, using a pulled capillary glass needle, and transferred to single tubes containing 2 μl lysis buffer 15. RNA and cDNA were prepared according to Smart‐seq2 protocol 15, except for preamplification that was carried out using 21 PCR cycles. Libraries were prepared according to the instructions following the Nextera XT DNA Library Prep Kits (FC‐131‐1024, Illumina) using dual indexes (i5+i7) and sequenced on Illumina HiSeq 2000, giving 43 bp reads following de‐multiplexing. Sequencing was done to the average depth of 6 × 10⁶ reads per cell. Reads were aligned to the mm10 mouse assembly using STAR v2.3.1o (default settings). Gene expression values were calculated as reads per kilobase gene model and million mappable reads (RPKMs) for each RefSeq transcript using rpkmforgenes 35. Quality control (QC) based on fraction exon‐mapping reads, gene coverage, mapping rate, and mismatch/indel rate were done according to Ref. 36 where cutoffs were set at the tail of the distributions for each of these metrics for two individual runs of sequencing (Fig EV1). Forty‐two cells of a total of 392 did not pass the quality control and were excluded from further analysis; 350 cells were left for further analyses.
Defining cell populations and specifically expressed genes
t‐distributed stochastic neighbor embedding (t‐SNE) of the 350 cells passing the quality control was conducted based on the expression of the 495 most differentially expressed genes in astrocytes, oligodendrocytes, and neurons according to (http://web.stanford.edu/group/barres_lab/brain_rnaseq.html) 16 was performed 10 times (initial dims = 25, perplexity = 15, theta = 0.01). The outputs from t‐SNE were applied to create an adjacency matrix that was used to build an Igraph (CRAN) network 17. In that network, seven distinct cell clusters were defined through Walktrap community (Igraph, CRAN, Pascal Pons, Matthieu Latapy: Computing communities in large networks using random walks, http://arxiv.org/abs/physics/0512106). To define specifically expressed/enriched genes, we performed single‐cell differential expression (SCDE) 18 on each of the seven Walktrap clusters vs all other cells. Genes were considered specific when mle > 1.5 (maximum likelihood estimate of the 95 ce conservative estimate of expression fold change) and adjusted P‐value < 0.05. Genes that met these criteria in more than one group were removed in order to establish stringent gene expression data for each cell cluster and to avoid genes expressed by intermediate cell stages. The generated gene lists from the seven cell clusters were subjected to statistical overrepresentation tests (Panther, http://pantherdb.org/, default settings, without Bonferroni correction) in order to find the clusters containing neurons, astrocytes, oligodendrocytes, and progenitor cells. Our lists containing genes specifically expressed in mouse embryonic spinal cord astrocytes, oligodendrocytes, and neurons were further compared to gene lists for astrocytes, oligodendrocytes, and interneurons from single‐cell RNA‐seq experiments of adult mouse brain 19 as well as to the top 500 most differentially expressed genes in astrocytes, oligodendrocytes, and neurons from bulk RNA‐seq experiments of adult mouse brain 16. P‐values (phyper, R package) for overlaps are calculated from the total number of protein‐coding genes reported in mm10 mouse assembly (23,389) without Bonferroni correction.
Hierarchical clustering of NPCs/GPCs
Dimensionality reduction was performed with t‐stochastic neighbor embedding (t‐SNE) with 20 first principal components, a perplexity of 9 and theta = 0.001 using the R software package (Krijthe, J. Rtsne: T‐distributed stochastic neighbor embedding using Barnes–Hut implementation. R package version 0.9). Due to the randomness in t‐SNE output, 20 runs with Rtsne were used for hierarchical clustering and bootstrapping with the pvclust R package 20, which clearly separated out two groups with 100% bootstrap values.
Pseudotemporal ordering of astrocytes and oligodendrocytes
For Monocle 24, the transcriptomes of the astrocyte and oligodendrocyte populations (designated in blue and red, respectively, in Fig 1B) were isolated and all genes expressed at RPKM > 2 in minimum of five cells (astrocytes) and four cells (oligodendrocytes) of the populations were used to derive a pseudotime axis. Expression of single genes was plotted using the function plot_genes_in_pseudotime. By using Monocle's gene clustering algorithm, 4,000 expressed genes (randomly chosen) from each cell type were clustered into four groups, respectively, based on their expression pattern along the pseudotime axis. All genes from each of these gene clusters were compared to our astrocyte‐specific and oligodendrocyte‐specific gene lists as well as to SOX3‐ and SOX9‐bound genes in GPCs. Overlaps are presented as enrichment score (Es): Es = (overlap/(size group1 × size group2) × 104).
ES cell culturing
Embryonic stem cells were propagated in feeder‐free conditions as described before 37. Neural differentiation was induced in N2B27 medium 37 by 0.1 μM All‐trans RA (Sigma) on bovine fibronectin (Sigma)‐treated culture plastic. GPCs were isolated from differentiating cultures by magnetic sorting with A2B5 magnetic beads (Miltenyi Biotec, 130‐093‐388) according to the manufacturer's instructions at d8 and propagated on fibronectin‐treated plastic in N2B27 media in the presence of EGF and FGF2 (10 ng/ml, Life Technologies).
Chromatin immunoprecipitation
ChIP experiments were done according to established protocols 7 with the use of the following antibodies: rabbit α‐SOX3 7, rabbit α‐SOX9 (Millipore, AB5535), rabbit α‐NFIA (Sigma, HPA006111), and α‐H3K27Ac (Diagenode, C15410174). ChIP libraries were prepared using TruSeq ChIP Library Prep Kit (Illumina) according to the manufacturer's recommendations followed by sequencing on Illumina HiSeq 2000 giving 43 bp reads, 7–20 × 106 reads per ChIP experiment. Individual ChIP experiments were confirmed by qPCR for enrichment over IgG control sample at specific target sites for each factor before sequencing (primers available upon request).
ChIP‐seq bioinformatics analyses
ChIP reads were aligned to the mouse genome assembly mm9 by star/2.3.1o 38. Mapped reads from ChIP‐seq replicates (SOX3 ChIP: 2 replicates, SOX9 ChIP: 3 replicates, NFIA ChIP: 2 replicates, and H3K27Ac ChIP: 3 replicates) were pooled for each factor and peak calling performed on pooled files according to Lun et al 39. The highest possible score for centrally enriched binding motifs for the specific factor decided which peak calling approach that finally was used for the processed files, for SOX3 ChIP‐seq, MACS14 (default settings), for SOX9 ChIP‐seq, MACS2 (default settings), and for NFIA ChIP‐seq, SISSRS (FDR 10‐7). For H3K27Ac ChIP‐seq, mapped reads were pooled from all three replicates and the pooled file was used with no further processing. Centrally enriched motifs for the different consensus peak sets are shown in Figs EV3 and EV5. Mapping and peak calling of SOX3 ChIPs in NPCs have been described elsewhere 7. The rat SOX10 ChIP‐seq peak coordinates 25 were converted to the mouse genome (mm9) using LiftOver (UCSC, default settings). We did not convert raw reads from rat SOX10 ChIP into the mm9 assembly. Overlaps between ChIP‐seq peaks were considered when > 1 bp at maximum 150 bp from peak center using BEDTools intersect function 40. For overlap between SOX3‐ChIPs in NPC and GPC and H3K27Ac in NPCs and GPCs, we used seqMINER software (JAVA) 41 to directly map reads from H3K27Ac‐ChIP experiments onto SOX3 peak regions. Fractions of DNA regions were further analyzed when mean density of H3K27Ac reads was > 22 tags/50 bp of SOX3‐bound regions. Gene annotation was performed using GREAT 3.0.0. Motif enrichment was performed using HOMER software 42 following the findMotifsGenome.pl function (default settings) where the two remaining peak sets were used as background for the three individual HOMER runs in Fig 4.
Sub‐cloning of DNA enhancers, transactivation assays, and Sox3 overexpression in GPCs
Mouse genomic regions (mm9) in Fig 5 were selected based on ChIP‐seq and single‐cell RNA‐seq experiments and conservation: Fgfbp3 chr19:36985056‐36985557, Ttyh1 chr7:4075162‐4075662, Aldh1l1 chr6:90481980‐90482073, Atp1a2 chr1:174226087‐174226172, Mid2 chrX:137195192‐137195362, Plekhb1 chr7:107802449‐107802717, Tubb3 and Lhx3 enhancer regions have been described elsewhere 7. These DNA regions were synthesized by GenScript between BglII and XhoI sites and sub‐cloned into a pTK‐luc vector. Transactivation assays were performed in P19 cells as described elsewhere with the exception of 100ng of pTK‐luc vectors and 50ng of SOX and/or NFIA expression vectors: pCAGG‐Sox3 (mouse), pCAGG‐Sox9 (mouse), pCAGG‐Sox10 (rat), pCAGG‐Sox11 (mouse, M. Wegner, University of Erlangen), and pCAGG‐Nfia (mouse), alone or in combinations. For SOX3 overexpression, ESC‐derived GPCs were transduced with pLenti‐Sox3 or pLenti‐GFP and cells were cultured under differentiation conditions for 4 days before fixed in 2% PFA for 20 min at RT and processed for immunohistochemistry using the following antibodies: rabbit α‐GFAP (DAKO), goat α‐SOX10 (Santa Cruz), rabbit α‐SOX3 (S. Wilson, Umea University, Sweden), goat α‐SOX3 (R&D), rabbit α‐GFP (Molecular Probes), and goat α‐GFP (Abcam). Results are presented as mean value and standard deviation from five to seven individual samples, and three‐star significance indicates P‐value > 0.001 (t‐test).
Chick neural tube electroporation
Electroporation of chicken neural tube was done at stage E4, and embryos were harvested 24 or 48 h post‐transfection. Following plasmids were co‐electroporated with eGFP‐pCAGG (0.5 μg/μl) control vector and in combinations: mSox3‐pCAGG (1 μg/μl) 3, dnSoxB1‐pCAGG (1 μg/μl) 43, Sox9‐pCAGG (1 μg/μl) 44. Other details concerning chick electroporation have been described elsewhere 7. Antibodies used for staining of chicken tissue were as follows: rabbit α‐NFIA (Sigma, HPA006111), rabbit α‐FGFR2, and goat α‐GFP. In situ hybridization was done according to standard procedures at frozen sections, and probe targeting chicken α‐Fgfr3 were synthesized from whole brain lysate (chicken, E7) using the following primers: Forward 5′‐ATACTTGAGGAGCGAGACCGCCT‐3′, Reverse 5′‐AGTATATTCCCCAGCATCCTCA‐3′.
Data availability
The accession number for the raw sequence data and processed files for ChIP‐seq experiments and RNA‐seq experiments reported in this paper is GEO: GSE117997. The accession number for raw sequence data for single‐cell RNA‐seq experiment is SRA accession: SRP155924.
Author contributions
SK, CZ, MB, and JM planned the study and designed the experiments. SK, CZ, ZA, ÅKB, and MB carried out the experiments and analyses. SK, CZ, DWH, JE, MB, and JM interpreted the results. MB and JM wrote the manuscript.
Conflict of interest
The authors declare that they have no conflict of interest.
Supporting information
Expanded View Figures PDF
Dataset EV1
Dataset EV2
Review Process File
Acknowledgements
We wish to thank D. Ramsköld, N. Kee, and K. Tiklova for bioinformatic advice, J. Holmberg for comments on the manuscript, and members of the Muhr and Ericson laboratories for fruitful discussions and advice. We are grateful to Science for Life Laboratory, the National Genomics Infrastructure, NGI, and Uppmax for providing assistance in massive parallel sequencing and computational infrastructure. This research was supported by grants from the Swedish Research Council, The Swedish Cancer Foundation, and The Knut and Alice Wallenberg Foundation.
EMBO Reports (2018) 19: e46635
Contributor Information
Jonas Muhr, Email: jonas.muhr@ki.se.
Maria Bergsland, Email: maria.bergsland@ki.se.
References
- 1. Molofsky AV, Krencik R, Krenick R, Ullian EM, Ullian E, Tsai H‐H, Deneen B, Richardson WD, Barres BA, Rowitch DH (2012) Astrocytes and disease: a neurodevelopmental perspective. Genes Dev 26: 891–907 [DOI] [PMC free article] [PubMed] [Google Scholar]
- 2. Oosterveen T, Kurdija S, Alekseenko Z, Uhde CW, Bergsland M, Sandberg M, Andersson E, Dias JM, Muhr J, Ericson J (2012) Mechanistic differences in the transcriptional interpretation of local and long‐range shh morphogen signaling. Dev Cell 23: 1006–1019 [DOI] [PubMed] [Google Scholar]
- 3. Bylund M, Andersson E, Novitch BG, Muhr J (2003) Vertebrate neurogenesis is counteracted by Sox1–3 activity. Nat Neurosci 6: 1162–1168 [DOI] [PubMed] [Google Scholar]
- 4. Ferri ALM, Cavallaro M, Braida D, Di Cristofano A, Canta A, Vezzani A, Ottolenghi S, Pandolfi PP, Sala M, DeBiasi S et al (2004) Sox2 deficiency causes neurodegeneration and impaired neurogenesis in the adult mouse brain. Development 131: 3805–3819 [DOI] [PubMed] [Google Scholar]
- 5. Graham V, Khudyakov J, Ellis P, Pevny L (2003) SOX2 functions to maintain neural progenitor identity. Neuron 39: 749–765 [DOI] [PubMed] [Google Scholar]
- 6. Gómez‐López S, Wiskow O, Favaro R, Nicolis SK, Price DJ, Pollard SM, Smith A (2011) Sox2 and Pax6 maintain the proliferative and developmental potential of gliogenic neural stem cells In vitro. Glia 59: 1588–1599 [DOI] [PubMed] [Google Scholar]
- 7. Bergsland M, Ramskold D, Zaouter C, Klum S, Sandberg R, Muhr J (2011) Sequentially acting Sox transcription factors in neural lineage development. Genes Dev 25: 2453–2464 [DOI] [PMC free article] [PubMed] [Google Scholar]
- 8. Lodato MA, Ng CW, Wamstad JA, Cheng AW, Thai KK, Fraenkel E, Jaenisch R, Boyer LA (2013) SOX2 co‐occupies distal enhancer elements with distinct POU factors in ESCs and NPCs to specify cell state. PLoS Genet 9: e1003288 [DOI] [PMC free article] [PubMed] [Google Scholar]
- 9. Bergsland M, Werme M, Malewicz M, Perlmann T, Muhr J (2006) The establishment of neuronal properties is controlled by Sox4 and Sox11. Genes Dev 20: 3475–3486 [DOI] [PMC free article] [PubMed] [Google Scholar]
- 10. Stolt CC, Wegner M (2010) SoxE function in vertebrate nervous system development. Int J Biochem Cell Biol 42: 437–440 [DOI] [PubMed] [Google Scholar]
- 11. Stolt CC, Rehberg S, Ader M, Lommes P, Riethmacher D, Schachner M, Bartsch U, Wegner M (2002) Terminal differentiation of myelin‐forming oligodendrocytes depends on the transcription factor Sox10. Genes Dev 16: 165–170 [DOI] [PMC free article] [PubMed] [Google Scholar]
- 12. Stolt CC, Lommes P, Sock E, Chaboissier M‐C, Schedl A, Wegner M (2003) The Sox9 transcription factor determines glial fate choice in the developing spinal cord. Genes Dev 17: 1677–1689 [DOI] [PMC free article] [PubMed] [Google Scholar]
- 13. Deneen B, Ho R, Lukaszewicz A, Hochstim CJ, Gronostajski RM, Anderson DJ (2006) The transcription factor NFIA controls the onset of gliogenesis in the developing spinal cord. Neuron 52: 953–968 [DOI] [PubMed] [Google Scholar]
- 14. Kang P, Lee HK, Glasgow SM, Finley M, Donti T, Gaber ZB, Graham BH, Foster AE, Novitch BG, Gronostajski RM et al (2012) Sox9 and NFIA coordinate a transcriptional regulatory cascade during the initiation of gliogenesis. Neuron 74: 79–94 [DOI] [PMC free article] [PubMed] [Google Scholar]
- 15. Picelli S, Björklund ÅK, Faridani OR, Sagasser S, Winberg G, Sandberg R (2013) Smart‐seq2 for sensitive full‐length transcriptome profiling in single cells. Nat Methods 10: 1096–1098 [DOI] [PubMed] [Google Scholar]
- 16. Zhang Y, Chen K, Sloan SA, Bennett ML, Scholze AR, O'Keeffe S, Phatnani HP, Guarnieri P, Caneda C, Ruderisch N et al (2014) An RNA‐sequencing transcriptome and splicing database of glia, neurons, and vascular cells of the cerebral cortex. J Neurosci 34: 11929–11947 [DOI] [PMC free article] [PubMed] [Google Scholar]
- 17. Kee N, Volakakis N, Kirkeby A, Dahl L, Storvall H, Nolbrant S, Lahti L, Björklund ÅK, Gillberg L, Joodmardi E et al (2017) Single‐cell analysis reveals a close relationship between differentiating dopamine and subthalamic nucleus neuronal lineages. Cell Stem Cell 20: 29–40 [DOI] [PubMed] [Google Scholar]
- 18. Kharchenko PV, Silberstein L, Scadden DT (2014) Bayesian approach to single‐cell differential expression analysis. Nat Methods 11: 740–742 [DOI] [PMC free article] [PubMed] [Google Scholar]
- 19. Zeisel A, Muñoz‐Manchado AB, Codeluppi S, Lönnerberg P, La Manno G, Juréus A, Marques S, Munguba H, He L, Betsholtz C et al (2015) Brain structure. Cell types in the mouse cortex and hippocampus revealed by single‐cell RNA‐seq. Science 347: 1138–1142 [DOI] [PubMed] [Google Scholar]
- 20. Suzuki R, Shimodaira H (2006) Pvclust: an R package for assessing the uncertainty in hierarchical clustering. Bioinformatics 22: 1540–1542 [DOI] [PubMed] [Google Scholar]
- 21. Dias JM, Alekseenko Z, Applequist JM, Ericson J (2014) Tgfβ signaling regulates temporal neurogenesis and potency of neural stem cells in the CNS. Neuron 84: 927–939 [DOI] [PubMed] [Google Scholar]
- 22. Creyghton MP, Cheng AW, Welstead GG, Kooistra T, Carey BW, Steine EJ, Hanna J, Lodato MA, Frampton GM, Sharp PA et al (2010) Histone H3K27ac separates active from poised enhancers and predicts developmental state. Proc Natl Acad Sci USA 107: 21931–21936 [DOI] [PMC free article] [PubMed] [Google Scholar]
- 23. Hagey DW, Zaouter C, Combeau G, Lendahl MA, Andersson O, Huss M, Muhr J (2016) Distinct transcription factor complexes act on a permissive chromatin landscape to establish regionalized gene expression in CNS stem cells. Genome Res 26: 908–917 [DOI] [PMC free article] [PubMed] [Google Scholar]
- 24. Trapnell C, Cacchiarelli D, Grimsby J, Pokharel P, Li S, Morse M, Lennon NJ, Livak KJ, Mikkelsen TS, Rinn JL (2014) The dynamics and regulators of cell fate decisions are revealed by pseudotemporal ordering of single cells. Nat Biotechnol 32: 381–386 [DOI] [PMC free article] [PubMed] [Google Scholar]
- 25. Lopez‐Anido C, Sun G, Koenning M, Srinivasan R, Hung HA, Emery B, Keles S, Svaren J (2015) Differential Sox10 genomic occupancy in myelinating glia. Glia 63: 1897–1914 [DOI] [PMC free article] [PubMed] [Google Scholar]
- 26. Chen X, Xu H, Yuan P, Fang F, Huss M, Vega VB, Wong E, Orlov YL, Zhang W, Jiang J et al (2008) Integration of external signaling pathways with the core transcriptional network in embryonic stem cells. Cell 133: 1106–1117 [DOI] [PubMed] [Google Scholar]
- 27. Iwafuchi‐Doi M, Zaret KS (2014) Pioneer transcription factors in cell reprogramming. Genes Dev 28: 2679–2692 [DOI] [PMC free article] [PubMed] [Google Scholar]
- 28. Takahashi K, Yamanaka S (2006) Induction of pluripotent stem cells from mouse embryonic and adult fibroblast cultures by defined factors. Cell 126: 663–676 [DOI] [PubMed] [Google Scholar]
- 29. Nakagawa M, Koyanagi M, Tanabe K, Takahashi K, Ichisaka T, Aoi T, Okita K, Mochiduki Y, Takizawa N, Yamanaka S (2008) Generation of induced pluripotent stem cells without Myc from mouse and human fibroblasts. Nat Biotechnol 26: 101–106 [DOI] [PubMed] [Google Scholar]
- 30. Soufi A, Donahue G, Zaret KS (2012) Facilitators and impediments of the pluripotency reprogramming factors' initial engagement with the genome. Cell 151: 994–1004 [DOI] [PMC free article] [PubMed] [Google Scholar]
- 31. Kamachi Y, Uchikawa M, Kondoh H (2000) Pairing SOX off: with partners in the regulation of embryonic development. Trends Genet 16: 182–187 [DOI] [PubMed] [Google Scholar]
- 32. Liber D, Domaschenz R, Holmqvist P‐H, Mazzarella L, Georgiou A, Leleu M, Fisher AG, Labosky PA, Dillon N (2010) Epigenetic priming of a pre‐B cell‐specific enhancer through binding of Sox2 and Foxd3 at the ESC stage. Cell Stem Cell 7: 114–126 [DOI] [PubMed] [Google Scholar]
- 33. Hoffmann SA, Hos D, Küspert M, Lang RA, Lovell‐Badge R, Wegner M, Reiprich S (2014) Stem cell factor Sox2 and its close relative Sox3 have differentiation functions in oligodendrocytes. Development 141: 39–50 [DOI] [PMC free article] [PubMed] [Google Scholar]
- 34. Glasgow SM, Zhu W, Stolt CC, Huang T‐W, Chen F, LoTurco JJ, Neul JL, Wegner M, Mohila C, Deneen B (2014) Mutual antagonism between Sox10 and NFIA regulates diversification of glial lineages and glioma subtypes. Nat Neurosci 17: 1322–1329 [DOI] [PMC free article] [PubMed] [Google Scholar]
- 35. Ramsköld D, Wang ET, Burge CB, Sandberg R (2009) An abundance of ubiquitously expressed genes revealed by tissue transcriptome sequence data. PLoS Comput Biol 5: e1000598 [DOI] [PMC free article] [PubMed] [Google Scholar]
- 36. Björklund ÅK, Forkel M, Picelli S, Konya V, Theorell J, Friberg D, Sandberg R, Mjösberg J (2016) The heterogeneity of human CD127(+) innate lymphoid cells revealed by single‐cell RNA sequencing. Nat Immunol 17: 451–460 [DOI] [PubMed] [Google Scholar]
- 37. Andersson E, Tryggvason U, Deng Q, Friling S, Alekseenko Z, Robert B, Perlmann T, Ericson J (2006) Identification of intrinsic determinants of midbrain dopamine neurons. Cell 124: 393–405 [DOI] [PubMed] [Google Scholar]
- 38. Dobin A, Davis CA, Schlesinger F, Drenkow J, Zaleski C, Jha S, Batut P, Chaisson M, Gingeras TR (2013) STAR: ultrafast universal RNA‐seq aligner. Bioinformatics 29: 15–21 [DOI] [PMC free article] [PubMed] [Google Scholar]
- 39. Lun ATL, Smyth GK (2014) De novo detection of differentially bound regions for ChIP‐seq data using peaks and windows: controlling error rates correctly. Nucleic Acids Res 42: e95 [DOI] [PMC free article] [PubMed] [Google Scholar]
- 40. Quinlan AR, Hall IM (2010) BEDTools: a flexible suite of utilities for comparing genomic features. Bioinformatics 26: 841–842 [DOI] [PMC free article] [PubMed] [Google Scholar]
- 41. Ye T, Krebs AR, Choukrallah MA, Keime C, Plewniak F, Davidson I, Tora L (2011) seqMINER: an integrated ChIP‐seq data interpretation platform. Nucleic Acids Res 39: e35 [DOI] [PMC free article] [PubMed] [Google Scholar]
- 42. Heinz S, Benner C, Spann N, Bertolino E, Lin YC, Laslo P, Cheng JX, Murre C, Singh H, Glass CK (2010) Simple combinations of lineage‐determining transcription factors prime cis‐regulatory elements required for macrophage and B cell identities. Mol Cell 38: 576–589 [DOI] [PMC free article] [PubMed] [Google Scholar]
- 43. Shih Y‐H, Kuo C‐L, Hirst CS, Dee CT, Liu Y‐R, Laghari ZA, Scotting PJ (2010) SoxB1 transcription factors restrict organizer gene expression by repressing multiple events downstream of Wnt signalling. Development 137: 2671–2681 [DOI] [PubMed] [Google Scholar]
- 44. Hagey DW, Muhr J (2014) Sox2 acts in a dose‐dependent fashion to regulate proliferation of cortical progenitors. Cell Rep 9: 1908–1920 [DOI] [PubMed] [Google Scholar]
Associated Data
This section collects any data citations, data availability statements, or supplementary materials included in this article.
Supplementary Materials
Expanded View Figures PDF
Dataset EV1
Dataset EV2
Review Process File
Data Availability Statement
The accession number for the raw sequence data and processed files for ChIP‐seq experiments and RNA‐seq experiments reported in this paper is GEO: GSE117997. The accession number for raw sequence data for single‐cell RNA‐seq experiment is SRA accession: SRP155924.


