

Abstract
Here, we address the regulation of microtubule nucleation during interphase by genetically ablating one, or two, of three major mammalian γ‐TuRC‐binding factors namely pericentrin, CDK5Rap2, and AKAP450. Unexpectedly, we find that while all of them participate in microtubule nucleation at the Golgi apparatus, they only modestly contribute at the centrosome where CEP192 has a more predominant function. We also show that inhibiting microtubule nucleation at the Golgi does not affect centrosomal activity, whereas manipulating the number of centrosomes with centrinone modifies microtubule nucleation activity of the Golgi apparatus. In centrosome‐free cells, inhibition of Golgi‐based microtubule nucleation triggers pericentrin‐dependent formation of cytoplasmic‐nucleating structures. Further depletion of pericentrin under these conditions leads to the generation of individual microtubules in a γ‐tubulin‐dependent manner. In all cases, a conspicuous MT network forms. Strikingly, centrosome loss increases microtubule number independently of where they were growing from. Our results lead to an unexpected view of the interphase centrosome that would control microtubule network organization not only by nucleating microtubules, but also by modulating the activity of alternative microtubule‐organizing centers.
Keywords: AKAP450, centrosome, Golgi apparatus, microtubule nucleation, PCNT
Subject Categories: Cell Adhesion, Polarity & Cytoskeleton
Introduction
The centrosome has been traditionally considered as the major microtubule (MT)‐organizing center (MTOC) of animal cells. It consists of a pair of centrioles organizing a matrix, the pericentriolar material (PCM), where MT nucleation and anchoring activities are localized 1. In the last years, it has become increasingly clear that MT nucleation also takes place in other subcellular locations 2, 3. During interphase, the Golgi apparatus (GA) is an active MTOC in many cell types 4, 5, and during mitosis, spindle MTs and kinetochores also act as additional MTOCs 6.
An increasing body of data indicates that MT nucleation activities of the centrosome and the GA are coordinately regulated. For example, during G2‐M transition, the centrosome gains MT nucleation activity 7, while MT nucleation activity of the GA is lost 8. The process is reversed after mitotic exit when MT‐nucleating activity of the GA is fully recovered. Down‐regulation of centrosome‐associated MT nucleation activity, or even centrosome loss, is also observed during cell differentiation 9, while that of the GA becomes dominant, as occurs for example in neurons, skeletal muscles, or pancreatic β‐cells 9, 10, 11, 12, 13. The molecular mechanisms underlying the coordination between these two MTOCs remain however mostly unexplored.
Microtubule nucleation primarily relies on γ‐tubulin and its associated proteins (GCP2‐GCP6). In higher eukaryotes, these proteins form ring‐shaped complexes known as γ‐TuRCs that serve as scaffolds for tubulin dimers in order to promote MT polymerization 14. Efficient γ‐tubulin‐mediated MT nucleation depends however on additional regulatory factors that activate or target γ‐TuRCs to MTOCs 15. Binding of γ‐TuRCs to the centrosome appears to be mediated by a large number of factors. Among them, four mammalian proteins, pericentrin (PCNT) and its paralog AKAP450 (also known as AKAP350 or CG‐NAP) and CDK5Rap2 (CEP215) and its paralog myomegalin, contain conserved, yet degenerate, motifs for γ‐tubulin binding 15 and have been shown to bind γ‐tubulin in vitro 16, 17, 18, 19. Based on these features, these proteins have been traditionally considered γ‐TuRC receptors, and it has been generally assumed that they play a role in MT nucleation at the centrosome. However, direct evidence supporting this view is scarce, especially during interphase. Other centrosomal proteins such as CEP192 20, MZT1 21, and NEDD1 22, 23 have also been reported to participate in γ‐TuRC recruitment and MT nucleation.
In addition to the centrosome, AKAP450, CDK5Rap2, and myomegalin do also localize at the cis‐face of the GA in most cells 19, 24, 25, 26, whereas PCNT has only been detected at the GA of skeletal muscle fibers so far 11. The key factor for MT nucleation at the GA has been proven to be AKAP450. Indeed, siRNA‐driven knock‐down, gene knock‐out, or dissociation of AKAP450 from the GA completely abolishes Golgi‐associated MT nucleation 24, 27, 28. CDK5Rap2 and myomegalin, recruited to the GA by AKAP450, appear to facilitate MT assembly by providing MT stabilization/anchoring activities 18, 28. In addition to these players, assembly of Golgi‐associated MTs requires the dynein/dynactin complex 24, 27 and the MT‐binding proteins CLASPs 5. Other proteins such as microtubule‐cross‐linking factor 1 (MTCL1) that binds both AKAP450 and CLASPs 29 and calmodulin‐regulated spectrin‐associated protein family member 2 (CAMSAP2) that binds myomegalin 8 28 and EBs proteins 30 also participate in the dynamics of GA‐nucleated MTs.
How cells specifically regulate GA or centrosome MT nucleation during interphase and how these MT‐nucleating activities are coordinated are questions that need to be better understood. Recently, the catalytic subunit of DNA polymerase δ (PolD1) has been shown to bind γ‐TuRC and to potently inhibit γ‐TuRC‐mediated MT nucleation. Intriguingly, PolD1 regulates MT nucleation at the GA without affecting the centrosome activity 31. Loss of centrosomes induced by the PLK4 inhibitor centrinone 32 has been reported to increase γ‐tubulin recruitment to the GA although, quite surprisingly, MTs at the GA in such conditions remained unperturbed 28.
To gain further insights into a possible crosstalk between the centrosome and the GA, we focused on proteins shared by both organelles, that is, PCNT, AKAP450, and CDK5Rap2. Myomegalin was not included in this analysis since several isoforms are present at the centrosome 19, and suitable tools for a thorough analysis are lacking except for the GA‐associated MM8 isoform 28. We have generated single and double hTERT‐RPE1 knock‐out (KO) cell lines of the three proteins. The characterization of mutant cell lines has revealed an important role of all these proteins in regulating GA‐mediated MT nucleation and only a minor contribution to centrosomal MT nucleation. The latter seems to be more dependent of CEP192 and of uncharacterized mechanisms. We have also used the Plk4‐specific inhibitor centrinone to alter centriole number 32. By combining these tools, we have shown that MT nucleation appears as a hierarchically regulated process, the centrosome controlling MT nucleation at other subcellular locations. Strikingly, in the absence of activity at the two main nucleating centers—the centrosome and the GA—a MT cytoskeleton fills the cell, but is poorly organized. Our results support a model for normal MT network organization in animal cells during interphase, in which the centrosome exerts its nucleating activity while negatively regulates that of the GA and inhibits assembly in the cytosol.
Results
Characterization of CRISPR‐Cas9‐induced knock‐out hTERT‐RPE1 cell lines
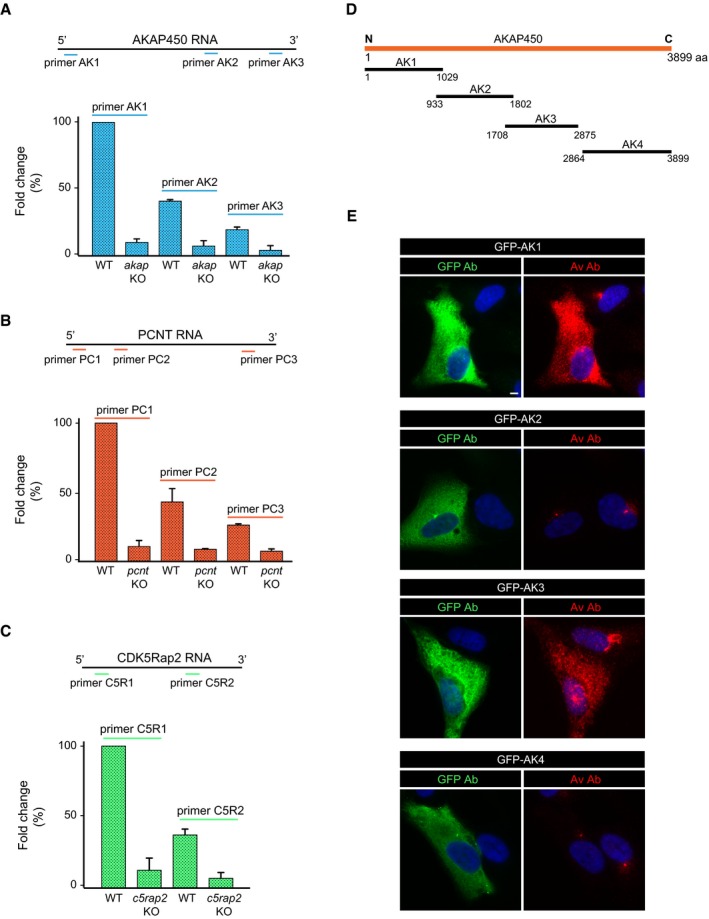
In order to achieve selective inhibition of MT nucleation either from the GA or the centrosome, we generated single or double hTERT‐RPE1 knock‐out (KO) cell lines targeting the AKAP450, CDK5Rap2, and/or PCNTB/kendrin (PCNT hereafter) proteins. Each of these mutant cell lines was generated by CRISPR/Cas9 nickase‐mediated mutagenesis. To improve the efficiency and specificity of this process, we developed a vector containing two cloning sites for two single guide RNAs (sgRNAs; see Appendix Fig S1A and Materials and Methods for details). These sgRNAs were designed to target the first exons of each protein (exons 2, 1, and 5 for the akap450, cdk5rap2, and pcnt genes, respectively, Appendix Fig S1B). KO cells for each gene were initially identified by immunofluorescence (IF) analysis, and, after clonal expansion, the targeted genomic regions of the selected KO clones were sequenced. Sequence analysis confirmed that the mutations introduced produced premature stop codons in both alleles of the respective gene. The amino acid sequence of the putative truncated polypeptides expressed in the KO clones, if any, is depicted in Appendix Fig S2A–H. However, the generations of these peptides are likely to be negligible since the mRNA expression of these genes was diminished approximately 90% in the KO cells when assessed by qPCR using different pairs of primers for each gene (Fig EV1), consistent with transcript degradation by 5′–3′ non‐sense‐mediated mRNA decay 33. Notably, the viability of the KO cell lines was not compromised in any way.
Figure EV1. Real‐time RT–PCR quantification of mRNAs of AKAP450, PCNT, and CDK5Rap2 in knock‐out cell lines and characterization of the anti‐AKAP450 Av antibody.
-
A–CqPCR analysis of AKAP450 (A), PCNT (B), and CDK5Rap2 (C) mRNA expression in both WT and KO cell lines. For AKAP450 and PCNT, three pairs of primers specific to different regions of mRNAs were used while two pairs of primers were used for CDK5Rap2 (as indicated). mRNA levels normalized to GADPH were then referred to the respective mRNA level of WT cells amplified with the most 5′ pair of primers. Data are expressed as the mean ± SD of two independent experiments (three replicates each).
-
DSchematic diagram showing the position of AKAP450 truncated mutants used in (E). Numbers represent amino acid positions in the full‐length protein.
-
ERPE‐1 cells transfected with plasmids coding for different AKAP450 deletion mutants fused to GFP (as indicated). Merged images of cells labeled for GFP (green) or AKAP450‐Av (red) and DAPI are shown. Scale bars, 5 μm.
At least two KO clones of each mutated gene were selected for further characterization in Western blots (WB) and by IF, using four anti‐AKAP450, four anti‐PCNT, and three anti‐CDK5Rap2 antibodies that recognized epitopes distributed all over the respective protein sequence (see Fig 1A). Although raised against the N‐terminal part of AKAP450 (marked Av), the polyclonal anti‐AKAP450 Aviva antibody also recognized the third quarter of the protein (marked Av*, see Fig EV1E). The SC3‐1 and SC3‐2 anti‐CDK5Rap2 polyclonal antibodies were generated and characterized in house (see Fig EV2A and B, and Materials and Methods). In WBs probed with any of the antibodies tested, no protein signal was detected in extracts of akap450 KO (akap KO), pcnt KO, and cdk5rap2 KO (c5rap2 KO) cell lines (Figs 1B and EV2A–C). Similarly, there was no specific IF signal obtained with any of the anti‐PCNT or anti‐CDK5Rap2 antibodies in KO clones, further demonstrating the loss of both proteins (Figs 1C and EV2E and F). Likewise, no AKAP450 signal was observed in akap450 KO mutant cells probed with the antibodies recognizing either the N‐terminus (named 7/AK), the central part (named A24), or the C‐terminus (named Ct‐AK) of the protein (Fig EV2D). However, residual centrosomal labeling was detected with the polyclonal Av antiserum, probably due to the cross‐reaction of this antiserum with a centrosomal epitope rather than to the expression of a minor centrosomal isoform of the protein. Indeed, the antibody Ct‐AK that recognizes the centrosomal targeting sequence did not reveal any signal at the centrosome in KO clones. Moreover, rabbit pre‐immune sera frequently contain anti‐centrosome antibodies. Finally, the qPCR data also supported this hypothesis. Thus, as far as we can tell, the KO cell lines generated appear to be suitable for our purposes.
Figure 1. Characterization of single and double knock‐out cell lines.
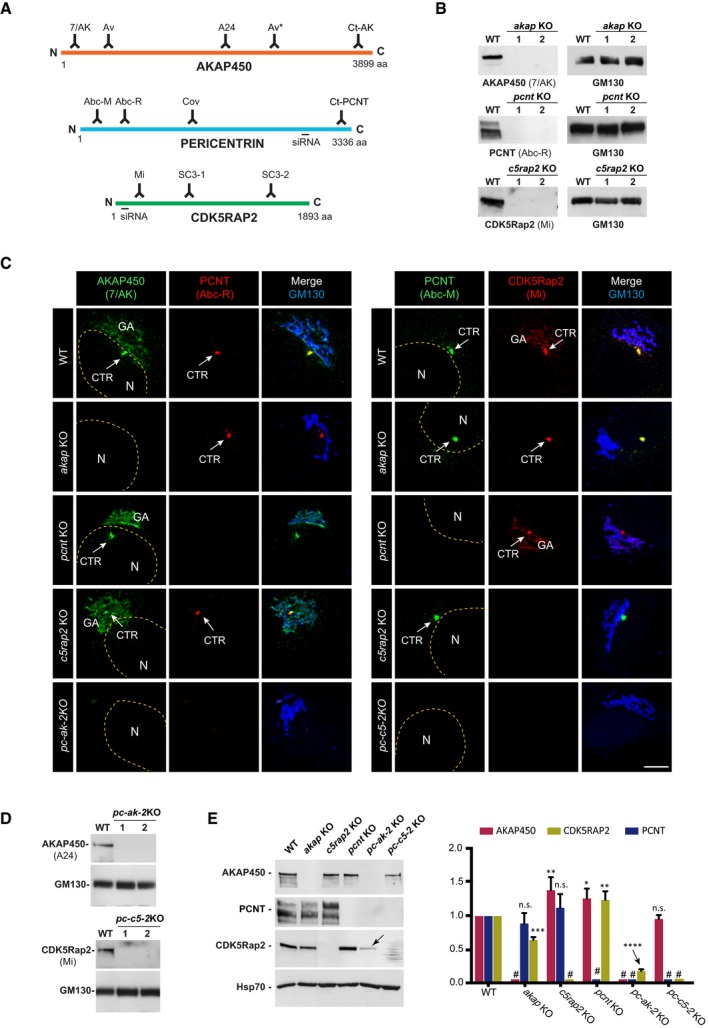
- Schematic representation of AKAP450, PCNT, and CDK5Rap2 proteins illustrating localization of the epitopes recognized by the antibodies and the sequences targeted by the siRNAs used in this study.
- Representative WBs of RPE‐1 wild‐type (WT) cells and the two selected KO clones for AKAP450 (akap KO), PCNT (pcnt KO), and CDK5Rap2 (c5rap2 KO) probed with the indicated antibodies.
- Confocal IF images of RPE‐1 WT, single KO (akap KO, pcnt KO, and c5rap2 KO), and double KO (pc‐ak‐2KO, left panels; pc‐c5‐2KO, right panels) cells stained with the indicated antibodies. The yellow dashed line indicates the nucleus contour, (N) and the arrows point the centrosome (CTR). GA marks the Golgi apparatus. Scale bars: 5 μm.
- Representative WB of RPE‐1 WT cells and the two selected PCNT/AKAP450 (pc‐ak‐2KO) and PCNT/CDK5Rap2 (pc‐c5‐2KO) double knock‐out‐mutated clones probed with the indicated antibodies.
- Representative WB of RPE‐1 WT cells and the indicated single or double KO cell lines probed with anti‐AKAP450, PCNT, and CDK5Rap2 antibodies (left). Quantification of signal intensity from three independent WB experiments is shown at right. # indicates KO proteins. The arrow points the dramatic decrease in CDK5Rap2 levels in pc‐ak‐2KO cell line. Bars represent mean values ± standard deviation (SD) of three independent experiments.
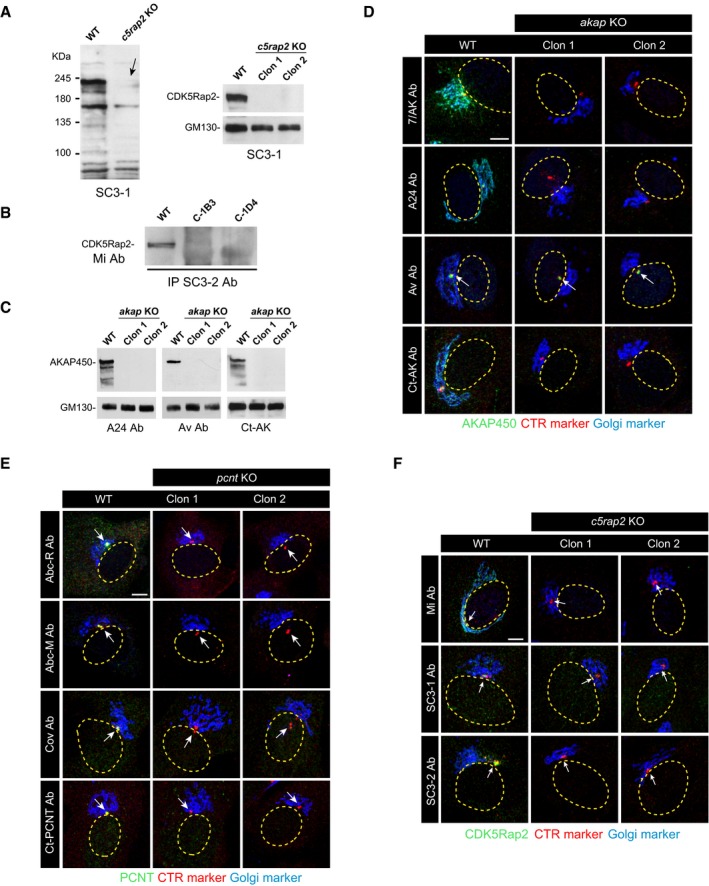
Figure EV2. Further characterization of akap9, cdk5rap2, and pcnt knock‐out cell lines.
-
AWB characterization of the anti‐CDK5Rap2 antibody SC3‐1 used in this study (left). A representative WB of RPE‐1 WT cells and the two selected c5rap2 knock‐out clones probed with the SC3‐1 antibody is shown at right. The arrow points to the specific band.
-
BImmunoprecipitation of cell extracts from WT and c5rap2 KO cell lines using the anti‐CDK5Rap2 antibody SC3‐2. Beads were tested for the presence of CDK5Rap2 by WB with the anti‐CDK5Rap2 (Mi) antibody.
-
CRepresentative WBs of RPE‐1 WT cells and the two selected akap9‐mutated clones probed with three anti‐AKAP450 antibodies (A24, Av, and Ct‐AK) as indicated.
-
D–FConfocal IF images of RPE‐1 WT cells and RPE‐1 akap KO (D), pcnt KO (E), and c5rap2 KO (F) cells with different antibodies as indicated. Arrows point to centrosomes.
To generate the pcnt/akap450 and pcnt/cdk5rap2 double KO cell lines, pcnt KO cells were transfected with the plasmids used to mutate AKAP450 or CDK5Rap2, respectively. The double KO clones were identified and characterized as above, and both the double pcnt/akap450 (pc‐ak‐2KO) and pcnt/cdk5rap2 (pc‐c5‐2KO) KO cells lacked their respective mutated proteins as revealed by IF (Fig 1C) and WB (Fig 1D). As AKAP450, PCNT, and CDK5Rap2 interact in vivo 17, the absence of one of them might affect the protein levels of the other proteins. However, depletion of PCNT or CDK5Rap2 alone, or together in the pcnt/cdk5rap2 KO cells, only modestly affected the amount of the other proteins (ranging from 90 to 125%: Fig 1E). However, akap450 KO cells did contain significantly less CDK5Rap2 (60%), an effect that was enhanced dramatically by the further depletion of PCNT. Under these conditions, CDK5Rap2 was almost completely depleted, and thus, the stability of CDK5Rap2 might depend on its interaction with AKAP450 and/or PCNT.
The role of the three canonical γ‐TuRC‐binding factors in MT nucleation
To evaluate the effect of inhibiting GA‐associated MT nucleation on centrosomal MTOC activity, we analyzed akap450 KO cells. As expected from previous work 24, these cells did not nucleate MTs from the GA, but they still exhibited centrosomal asters in MT regrowth experiments after nocodazole (NZ)‐induced MT depolymerization. The MTOC activity of the centrosome under these conditions was quantified through two complementary approaches. First, we scored EB1 comets surrounding the centrosome as a measure of newly nucleated MTs (Fig 2A and B). Second, we determined the MT density of the centrosomal aster after a short NZ washout (Fig 2C and D). Since MT dynamics is very sensitive to time and temperature conditions, we performed regrowth experiments in mixed populations of WT and KO cells. Only slight differences between WT‐ and AKAP450‐depleted cells were detected using either of these methods (96 and 98%, respectively; Fig 2B and D) indicating that inhibition of GA‐mediated MT nucleation does not significantly affect centrosomal MT nucleation activity. Thus, it appears that the centrosome functions as an autonomous MTOC. These data also reveal that AKAP450 is dispensable for MT nucleation at the centrosome.
Figure 2. Analysis of centrosome and GA MT nucleation.
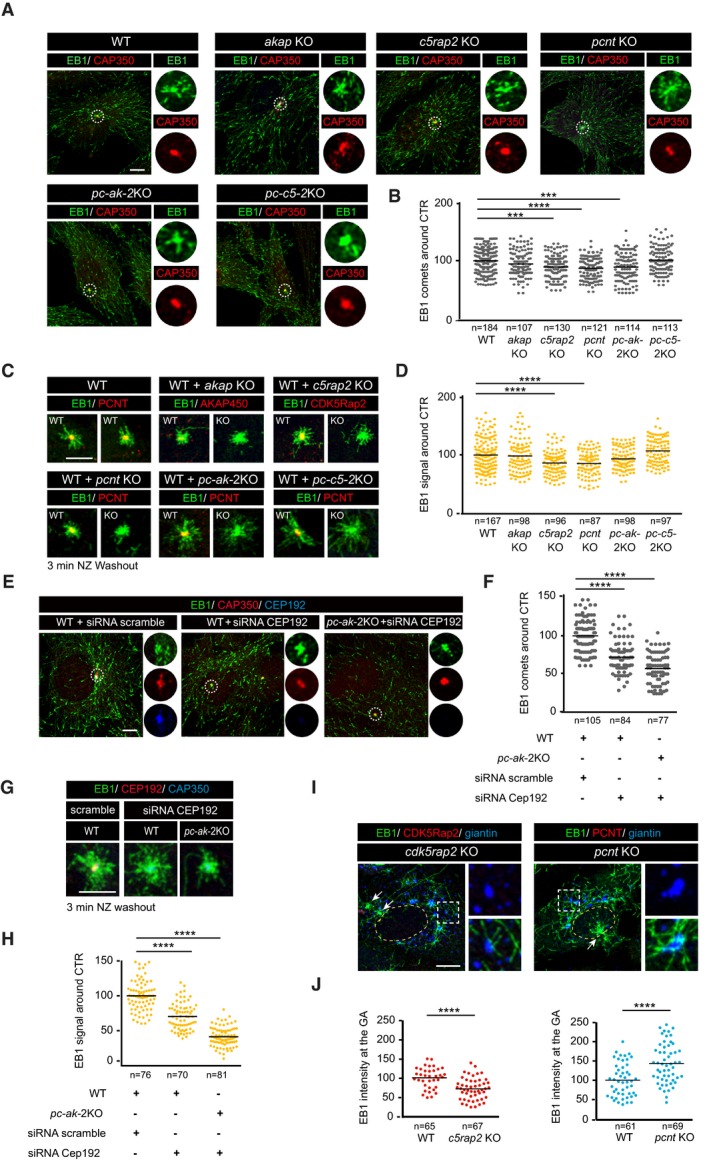
- Confocal images of WT, akap KO, c5rap2 KO, pcnt KO, pc‐ak‐2KO, and pc‐c5‐2KO cells stained for EB1 (green) and the centrosomal protein CAP350 (red). High‐magnification single‐channel images of selected areas are shown at right.
- Scatter plot showing quantification of EB1 comets from three independent experiments as that shown in (A). A region of interest of 3 μm radius around the CAP350 signal was used to count the number of comets. Horizontal black lines represent the mean.
- MT regrowth experiments of WT cells mixed with either WT (as a control), akap KO, c5rap2 KO, pcnt KO, pc‐ak‐2KO, or pc‐c5‐2KO cells. Samples were fixed 3 min after NZ washout and stained for EB1 (green) and the indicated protein in the red channel.
- Quantification of EB1 signal intensity around the centrosome from three experiments as that shown in (C).
- WT and pc‐ak‐2KO cells were transfected with a combination of three siRNAs against CEP192, fixed, and triple‐labeled for EB1, CEP192, and CAP350, as a centrosomal marker. Scramble siRNA was used as a control.
- EB1 comets around the centrosome were quantified as in (A).
- Three‐minute MT regrowth experiments in WT and pc‐ak‐2KO cells transfected with either scramble or CEP192 siRNAs.
- Quantification of the EB1 signal intensity around the centrosome as in (D).
- MT regrowth experiments in WT and c5rap2 KO or pcnt KO cells. Cells were stained as indicated. Arrows point the centrosome.
- Quantification of EB1 signal intensity at Golgi membranes.
To evaluate the contribution of the other canonical γ‐TuRC‐binding factors to centrosomal MT nucleation, we analyzed single cdk5rap2 and pcnt KO cells, as well as the double PCNT/AKAP450‐ and PCNT/CDK5Rap2‐depleted cell lines (Fig 2A–D). Cells lacking either CDK5Rap2 or PCNT exhibited almost normal MT nucleation from the centrosome (90 and 86%, and 88 and 85%, respectively; see Fig 2B and D). Even in dual pcnt/akap450 KO cells, in which CDK5Rap2 was also strongly diminished (see Fig 1E), MT nucleation at the centrosome was only reduced by approximately 10% (90 and 94%, respectively; Fig 2B and D). Since myomegalin is released from the centrosome in the absence of AKAP450 19, we concluded from these results that MT nucleation at the centrosome is only modestly affected by the absence of all four canonical γ‐TuRC‐binding factors. This unexpected result prompted us to examine the contribution of another key γ‐TuRC‐recruiting factor to centrosomal MT nucleation, namely CEP192. We first tried to generate CRISPR/Cas9‐mediated cep192 KO cells. However, although we were able to identify cells lacking CEP192 labeling just after transfection, we failed to obtain cep192 KO stable cell lines. Therefore, we decided to assess the role of CEP192 in MT nucleation by siRNA (Fig EV3). When the EB1 comets (Fig 2E) and MT regrowth after NZ removal (Fig 2G) were quantified in cells in which CEP192 was silenced, MT nucleation from the centrosome was reduced by 27 and 31%, respectively (Fig 2F and H). CEP192 depletion in double pcnt/akap450 KO cells, that also lack CDK5Rap2, further reduced centrosomal MT nucleation with respect to the WT cells (a 41.2 and 59.3% decrease, respectively). These results revealed a significant role of CEP192 in centrosomal MT nucleation during interphase which, together with the canonical γ‐TURC‐binding factors, is responsible for more than 50% of centrosomal MT nucleation.
Figure EV3. Efficiency of CEP192 siRNAs.
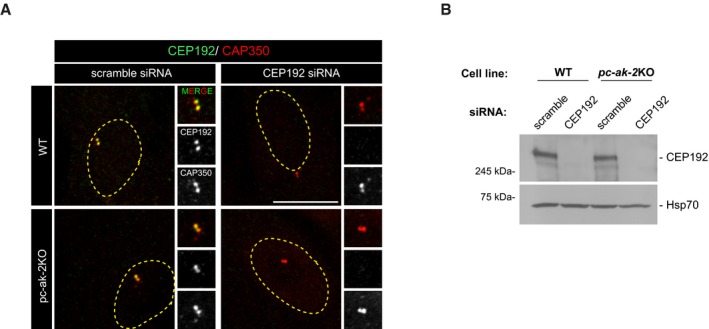
- IF images of WT and pc‐ak‐2KO RPE‐1 cells transfected with either scramble or CEP192 siRNAs as indicated. Cells were double‐stained for CEP192 and CAP350 as a centrosomal marker. High‐magnification images of centrosomes are shown at right. The yellow dashed line indicates the nucleus contour. Scale bars: 5 μm.
- Representative WB of WT and pc‐ak‐2KO cells transfected with either scramble or CEP192 siRNAs and revealed with the anti‐CEP192 antibody. Hsp70 was used as loading control.
Source data are available online for this figure.
Recovery from NZ treatment was also used to analyze the impact of genetic ablation of γ‐TuRC‐binding proteins on MT nucleation at the GA. Quantification of the EB1 signal associated with elements of the GA showed a moderate decrease in GA‐associated MT nucleation (a 27% decrease) in cdk5rap2 KO cells compared to WT cells (Fig 2I and J) consistent with earlier data 28. Remarkably, while PCNT is only detected weakly at the GA in WT RPE‐1 cells, we noticed a significant increase in GA‐associated MT nucleation in cells lacking PCNT (143%; Fig 2J). The molecular basis for this result is explored further below, yet nevertheless, we conclude that MT nucleation at the GA is strictly dependent on AKAP450, whereas it is facilitated by CDK5Rap2 and negatively regulated by PCNT.
Together, these data demonstrate that canonical γ‐TuRC‐binding proteins control GA‐associated MT nucleation, while they only contribute mildly to centrosomal MT nucleation, which is more dependent on CEP192 and on additional uncharacterized mechanisms. However, why the four canonical γ‐TuRC‐binding factors are recruited to the centrosome despite their minor contribution to centrosomal nucleation remains an important question.
Intracellular distribution of the different complexes containing γ‐TuRC‐binding factors
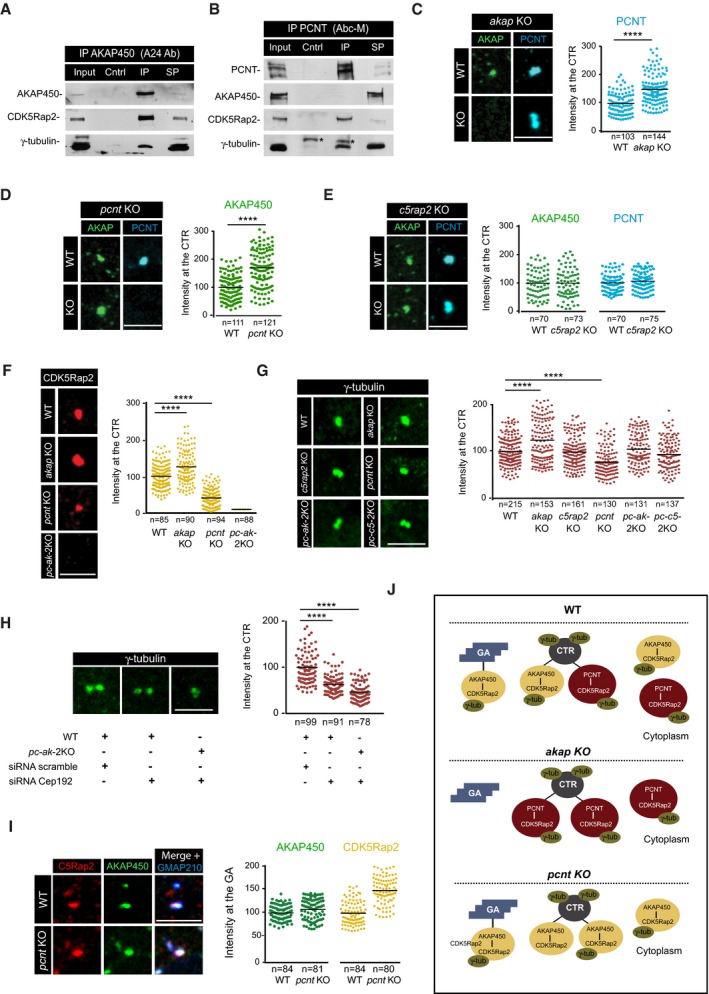
We further attempted to clarify the mutual interactions between the different γ‐TuRC‐binding factors at their different intracellular localizations. First, we immunoprecipitated endogenous proteins from the soluble fraction of WT cells, and we found that CDK5Rap2 and γ‐tubulin co‐immunoprecipitated when either AKAP450 or PCNT was pulled down (Fig 3A and B). However, unlike data reported in HeLa cells 17, we failed to co‐immunoprecipitate AKAP450 with PCNT and vice versa (Fig 3B and data not shown). Hence, RPE1 cells contain at least two kinds of γ‐TuRC‐binding complexes, one formed by PCNT‐CDK5Rap2‐γ‐tubulin and the other by AKAP450‐CDK5Rap2‐γ‐tubulin (see schemes in Fig 3J).
Figure 3. Distribution of γ‐TuRC‐binding factors containing complexes.
-
A, BWB of AKAP450 (A) and PCNT (B) co‐immunoprecipitation assays revealed with the indicated antibodies. Asterisks mark immunoglobulin heavy chains. Cntrl, non‐specific Igs immunoprecipitates; IP, specific Igs immunoprecipitates; SP, supernatant.
-
C–G(Left) Centrosomes from WT, single, and double KO cells, as indicated, were labeled for AKAP450 and PCNT (C–E), CDK5Rap2 (F), and γ‐tubulin (G). Right panels show quantifications. A region of interest of 1.5 μm radius was drawn around the centrosome, and fluorescence intensity was determined and normalized to WT mean.
-
HWT and pc‐ak‐2KO cells were transfected with either scramble or CEP192 siRNAs, fixed, and stained for γ‐tubulin. Quantification of the fluorescence intensity is shown at right.
-
IIF images of WT and pcnt KO RPE‐1 cells treated with NZ for 3 h and triple‐stained for AKAP450 (green), CDK5Rap2 (red), and GMAP210 as a Golgi marker (blue). At right, quantification of fluorescence co‐localization of either AKAP450 or CDK5Rap2 with the Golgi marker GMAP210 in WT and pcnt KO cells.
-
JScheme summing up the changes in AKAP450‐based and PCNT‐based complexes distribution in WT, akap KO, and pcnt KO RPE‐1 cells and their impact on γ‐tubulin recruitment. GA, Golgi apparatus. CTR, centrosome.
We assessed the intracellular distribution of these complexes in either WT or KO cells by IF. Since the GA usually surrounds the centrosome in RPE‐1 cells, centrosome‐ and GA‐associated protein pools frequently overlap. To circumvent this problem, cells were treated with NZ to fragment the GA and disperse the Golgi elements throughout the cytoplasm prior to performing IF. Notably, AKAP450 depletion resulted in a 1.5‐fold increase in PCNT at the centrosome (Fig 3C), and reciprocally, depletion of PCNT augmented AKAP450 to a similar extent (Fig 3D). Hence, AKAP450 and PCNT appear to target the centrosome independently, suggesting that they compete for centrosome binding, the absence of one favoring the accumulation of the other. Since both AKAP450 and PCNT share a common C‐terminal centrosome‐docking domain, the PACT domain, one possibility is that PCNT and AKAP450 compete for PACT domain‐binding sites at the PCM.
CDK5Rap2 depletion did not affect either AKAP450 or PCNT binding to the centrosome, indicating that this protein lies downstream of the association of these proteins with the PCM (Fig 3E). Finally, the loss of PCNT greatly reduced (60%) CDK5Rap2 binding to the centrosome (Fig 3F), although this increased slightly in akap450 KO cells. No CDK5Rap2 staining at the centrosome was observed in double pcnt/akap450 KO cells. However, there was a dramatic reduction in the total CDK5Rap2 under these conditions (Fig 3F and see Fig 1E).
To assess the relative contributions of all these factors to the centrosomal localization of γ‐tubulin, we quantified the γ‐tubulin IF signal in the WT and mutant cell lines. Interestingly, the loss of AKAP450 enhanced the binding of γ‐tubulin to the centrosome by 21%, while the loss of PCNT reduced its binding by the same amount (Fig 3G). The loss of CDK5Rap2 did not affect centrosomal γ‐tubulin levels (99%), and more strikingly, the centrosomal γ‐tubulin in the two double KO cell lines was similar to that in the WT cells (104 and 95%, respectively; Fig 3G). These results indicate that depletion of the three main canonical γ‐TuRCs from the interphase centrosome (AKAP450, PCNT, and CDK5Rap2) does not severely compromise γ‐tubulin centrosomal recruitment, consistent with the absence of significant changes in centrosomal MT nucleation (see Fig 2). Conversely, considerable centrosomal γ‐tubulin was redistributed after CEP192 depletion (38%; Fig 3H), which was more evident in CEP192‐depleted double pcnt/akap450 KO cells (54%; Fig 3H).
Finally, our data confirmed the distribution of these proteins at the GA reported previously 25 indicating that CDK5Rap2 is recruited to the GA through its interaction with AKAP450 (not shown). Punctate PCNT staining in the GA area did not co‐localize precisely with Golgi markers in our experimental conditions (see Fig 5A). However, in agreement with the increase in GA‐mediated MT nucleation described above (Fig 2), there was a modest increase in AKAP450 labeling at the Golgi membrane in pcnt KO cells (108%), in conjunction with a considerable increase in Golgi‐associated CDK5Rap2 (144%; Fig 3I).
Figure 5. Redistribution of γ‐TuRC‐binding factors to the GA in the absence of the centrosome.
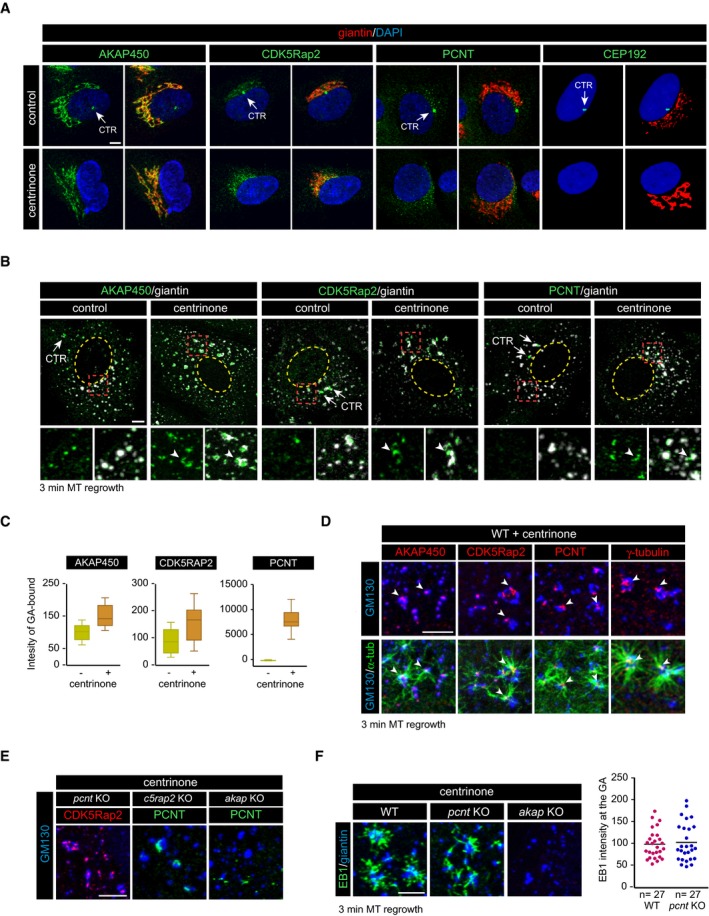
- Control (top) and centrinone‐treated (bottom) RPE‐1 cells double‐stained for either AKAP450, CDK5Rap2, PCNT, or CEP192 (all shown in green) and giantin (red) as a Golgi marker. DNA was counterstained with DAPI and is shown in blue. Single‐channel (left, green) and merged images (right) are shown in each case. White arrows indicate the centrosome (CTR).
- IF images of control and centrinone‐treated RPE‐1 cells treated with NZ to induce GA fragmentation and double‐stained with either anti‐AKAP450, anti‐CDK5Rap2, or anti‐PCNT (all shown in green) and anti‐giantin antibodies (white). Enlarged views of the boxed areas are presented at the bottom with or without the signal of the Golgi marker. The yellow dashed line indicates the contour of the nucleus. Arrowheads point to the accumulation of the respective proteins in Golgi membrane surfaces.
- Box‐and‐whisker plots showing quantification of association between the indicated protein and Golgi elements (see Materials and Methods for details). Top and bottom ends of the boxes represent 75th and 25th percentiles, and whiskers represent 90th and 10th percentiles. The median is depicted with a solid line. Individual Golgi elements from at least 14 cells were delineated (> 500 elements/experiment), and the intensity of each protein spot associated with each Golgi element was measured. Data were collected from two independent experiments and normalized to WT mean.
- MT regrowth experiment after NZ treatment in centrinone‐treated cells. High‐magnification images at the bottom are representative of a triple staining with α‐tubulin (green), GM130 (blue), and the indicated protein (red) and show MTs growing from the surface of the GA. Double labeling without α‐tubulin is also shown (top) to allow better visualization of PCM‐protein spots on Golgi elements acting as MT nucleation sites (arrowheads).
- Centrinone‐treated pcnt KO, c5rap2 KO, and akap KO cells were incubated with NZ for 3 h, fixed, and double‐labeled for GM130 and either CDK5Rap2 or PCNT as indicated (n = 3).
- MT regrowth assay in centrinone‐treated WT, pcnt KO, and akap KO RPE‐1 cells stained with antibodies to EB1 and giantin. At right, quantification of EB1 intensity at the Golgi membranes in WT and pcnt KO cells treated with centrinone, as a measure of MT nucleation from the GA. Data were collected from two independent experiments and normalized to WT mean.
A cartoon summarizing the behavior of the different γ‐TuRC‐binding protein complexes studied here is presented in Fig 3J. Our results support the existence of at least two types of protein complexes: those containing AKAP450 and CDK5Rap2 (AKAP450‐based complexes) that are present at both the GA and the centrosome; and those formed by PCNT and CDK5Rap2 (PCNT‐based complexes) that specifically localize to the centrosome. When AKAP450 is depleted, we detected higher levels of PCNT at the centrosome that might account for the increase in centrosomal γ‐tubulin observed. In the absence of PCNT, there is less γ‐tubulin at the centrosome in conjunction with increased AKAP450. The loss of PCNT also stimulated CDK5Rap2 recruitment to the GA, which could explain the increment in GA‐mediated MT nucleation.
The role of the centrosome in GA‐mediated MT nucleation
While depleting canonical γ‐TuRC‐binding factors was successful to assess the impact of inactivating GA‐mediated MT nucleation on centrosome activity, we did not find experimental conditions that allowed us to block, or even significantly diminish, centrosomal MT nucleation without affecting GA MT nucleation. Therefore, we employed an alternative approach using the PLK4 inhibitor centrinone, which blocks centriole duplication and induces the loss of the centrosome 32. This approach can also generate cells with extra centrosomes, as removal of the inhibitor triggers a wave of centrosome duplication 32.
When cells lacking the centrosome were subjected to MT regrowth for 3 min after NZ‐induced MT disassembly, virtually all MTs grew as asters from scattered Golgi elements (Fig 4A). To assess the changes in MT‐nucleating activity of the GA upon the loss of the centrosome, we used software that automatically identifies individual Golgi elements, as well as MTs growing from each of these elements (see cartoon in Fig 4B). Individual cells were defined before the analysis, and the centrosome of control cells was also identified and excluded from the analysis. Quantification of more than 50 control or centrinone‐treated centrosome‐less cells revealed that in the absence of centrosomes, there was a threefold increase in the number of GA‐associated growing MTs per cell (42.7 MTs/control cell versus 118.6 MTs/centrinone‐treated cell; Fig 4C). A detailed analysis revealed that the number of MTs nucleated from each Golgi element increased from 1.9 to 3.7 and that the number of nucleating Golgi elements per cell increased 1.3‐fold in centrosome‐less cells (24.3 versus 31.6; Fig 4C). To rule out that this were a direct effect of PLK4 inhibition on the MT‐nucleating activity of the GA, we performed similar polymerization experiments in cells harboring a normal centrosome number but treated with centrinone for 3 or 12 h. Exposure to centrinone did not produce any differences relative to the control cells (Fig EV4A), confirming that the increase in the MT‐nucleating activity of the GA in centrinone‐treated cells was a consequence of centrosome loss.
Figure 4. The centrosome regulates MT nucleation activity of the GA .
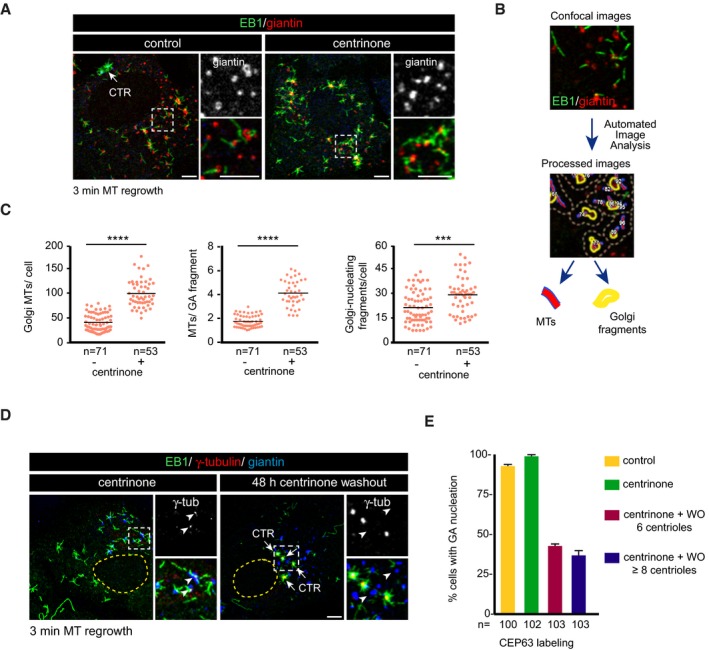
- Control and centrinone‐treated cells were subjected to a 3‐min MT regrowth assay, fixed, and labeled for EB1 (green) and giantin (red). Insets show magnified images of boxed regions.
- Workflow of the method used for quantifying MT nucleation from the GA.
- Quantification of the total number of growing MTs per cell (left), the number of MTs nucleated per Golgi fragment (middle), and the number of MT‐nucleating Golgi fragments (right) in both control and centrosome‐less RPE‐1 cells. Scatter plots show each individual data point. Horizontal black lines bars represent the mean.
- RPE‐1 cells were treated with centrinone for either 7 days (left) or for 5 days and then allowed to recover for 48 h in the absence of the drug prior to fixation (right). Representative images of a triple IF staining with EB1 (green), γ‐tubulin (red), and giantin (blue) as a Golgi marker are shown. Insets show MT nucleation from Golgi elements (left) or from multiple centrioles (right) and are enlarged at right. Arrowheads indicate the position of Golgi elements.
- Quantification of the percentage of cells exhibiting Golgi‐nucleating activity in centrinone‐treated cells 48 h after the washout of the drug. Cells were divided into two categories depending on the number of centrioles that were visualized by labeling for the centriole protein Cep63. At least 100 cells from two independent experiments were analyzed in each condition. Bars represent mean values ± SD.
Figure EV4. Further characterization of centrinone‐treated cells.
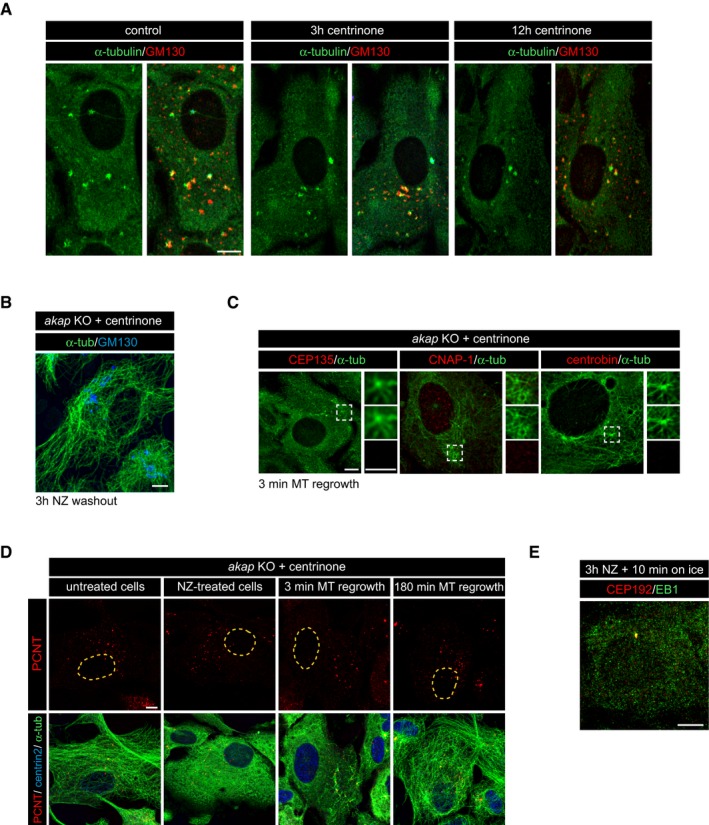
- Non‐treated, 3‐h centrinone‐treated or 12‐h centrinone‐treated RPE‐1 cells were subjected to a MT regrowth assay, fixed 3 min after drug washout, and double‐labeled for α‐tubulin and GM130.
- Complete MT network recovery of akap KO centriole‐less centrinone‐treated cells 3 h after removal of NZ. Cells were stained with anti‐α‐tubulin and anti‐GM130 antibodies.
- Centrinone‐treated akap KO cells were subjected to a MT regrowth assay and double‐stained with the indicated antibodies. High magnifications of the boxed areas are shown as merged images (top) or as individual green or red labelings (middle and bottom panels).
- Centrinone‐treated akap KO cells were treated with NZ and, at the indicated time points after NZ washout, fixed, and labeled for α‐tubulin (green), PCNT (red), and centrin 2 as a centrosomal marker (blue). Single labeling images for PCNT are shown at the top and the corresponding merged images at the bottom.
- RPE‐1 cells treated with NZ for 3 h and incubated for 10 min on ice after NZ removal were double‐labeled for EB1 and CEP192. No EB1 signal was visible throughout the cytoplasm demonstrating the complete depolymerization of MTs under these conditions.
We then performed similar experiments 48 h after removal of the drug, with centrinone washout resulting in transient hyper‐activation of PLK4 that provokes the generation of multiple centrosomes 32. Newly formed centrosomes actively recruited γ‐tubulin and nucleated MTs (Fig 4D), whereas the capacity of the GA to bind γ‐tubulin and to promote MT nucleation was markedly dampened in these conditions. To quantify this phenotype, we determined the percentage of cells containing two (control), none (centrinone‐treated), six, or more than eight centrosomes (centrinone washout), in which MT nucleation at the GA was inhibited (Fig 4E). Centrosomes were identified by CEP63 staining. Fifty‐seven percent of the cells containing six centrosomes did not nucleate MTs from the GA. This inhibitory effect was even stronger in cells containing more than eight centrosomes (63%). Thus, the high number of MT‐nucleating centrosomes under these conditions appears to dramatically reduce the capacity of Golgi membranes to efficiently assemble MTs.
In summary, the GA MT nucleation activity is not only dependent of the presence of a centrosome but also, it is affected by an extra number of centrosomes. Thus, the MT‐nucleating capacity of the GA during interphase is sensitive to aberrant numbers of centrosomes, which might be relevant for a number of pathological disorders in which such conditions arise.
Recruitment of γ‐TuRC‐binding factors to the GA in the absence of the centrosome
To identify the factor(s) involved in the enhanced GA‐mediated MT nucleation in the absence of the centrosome, we first examined the distribution of AKAP450, CDK5Rap2, and PCNT in centrinone‐treated cells by IF (Fig 5A). Consistent with earlier data 32, the GA exhibited a normal morphology and location despite the absence of the centrosome (Fig 5A), and AKAP450 staining and CDK5Rap2 staining were also apparently unchanged. However, PCNT labeling was redistributed as numerous spots concentrating around the GA rather than it associating with the PCM as in control cells (Fig 5A). Importantly, we did not observe any accumulation of CEP192 at the GA in cells lacking centrosomes (Fig 5A), indicating that the association of PCNT with Golgi membranes in the absence of centrioles is not due to a general redistribution of the entire PCM to the GA but rather, that is a specific effect on a subset of proteins.
Closer examination and quantification after NZ‐induced MT disassembly revealed that levels of Golgi‐bound AKAP450 and CDK5Rap2 increased 1.5‐fold in centrinone‐treated cells (a 151 and 154% increase, respectively). The accumulation of PCNT at the GA in centrosome‐less cells was more spectacular (> 8,000%: Fig 5B and C). MT regrowth experiments revealed that PCNT specifically localized to Golgi‐associated MT nucleation foci, where AKAP450, CDK5Rap2, and γ‐tubulin also accumulated (Fig 5D). These observations suggest that in the absence of the centrosome, all these proteins can form large protein complexes at the surface of cis‐Golgi membranes.
We next wondered how PCNT, which does not visibly bind to Golgi membranes under normal conditions, associates with the GA in centrosome‐less cells. We analyzed this question by assessing the distribution of these proteins in pcnt, cdk5rap2, or akap450 KO cells treated with centrinone. It must be noted that after 7 days in the presence of centrinone, cdk5rap2 and pcnt KO cell cultures contained very few cells without the centrosome, probably due to the role of these proteins in mitosis. Consequently, fewer cells could be analyzed in these experiments. The removal of PCNT did not alter the association of CDK5Rap2 with Golgi membranes in centrosome‐less cells (Fig 5E). Likewise, PCNT also remained attached to the GA in the absence of CDK5Rap2 and centrosomes (Fig 5E). However, in the absence of AKAP450, both PCNT and CDK5Rap2 (Fig 1C) dissociated from the GA (Fig 5E). These results suggest that in cells lacking centrosomes, PCNT‐based complexes redistribute from the PCM to the GA in an AKAP450‐dependent manner. Finally, quantification of MTs growing from Golgi elements revealed no significant differences in centrosome‐less pcnt KO cells compared to centrosome‐less WT cells (Fig 5F), indicating that PCNT‐based complexes did not significantly contribute to the enhanced MT‐nucleating activity of the GA induced by centrosome loss. Conversely, and as expected, GA‐associated MT nucleation was completely inhibited in centrosome‐less cells lacking AKAP450 (Fig 5F).
MT formation in the absence of the centrosome and GA‐associated MT nucleation
We then evaluated the impact of inhibiting MT nucleation at both the centrosome and the GA on MT cytoskeleton organization. We focused on centrinone‐derived centrosome‐less cells lacking AKAP450, cells that contained a cell‐wide MT network even though both centrosome‐ and GA‐associated MT nucleation were suppressed (Fig 6A). Hence, we wanted to determine whether this MT network was generated by spontaneous cytoplasmic MT polymerization or whether it was otherwise nucleated by previously unidentified MTOCs. Surprisingly, short‐term MT polymerization experiments revealed MT asters distributed throughout the cytoplasm that did not co‐localize with Golgi membranes (Fig 6B). Indeed, 3 h after NZ washout dense, non‐radial and highly abnormal MT networks were evident (Fig EV4B).
Figure 6. Cytoplasmic MT nucleation in the absence of centrosome‐ and Golgi‐mediated MT nucleation.
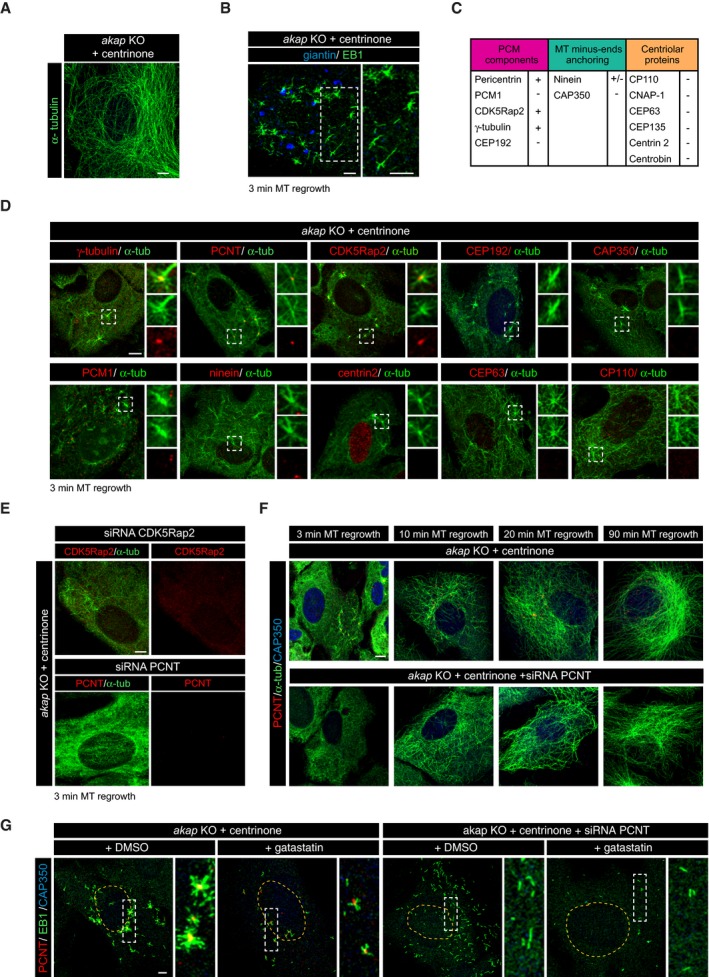
- Representative MT network of a centrosome‐less akap KO cell.
- MT regrowth experiment after NZ treatment in centrinone‐treated akap KO cells. A representative confocal image of a double labeling for EB1 (green) and giantin (blue) is shown. High magnification at right shows that growing MT asters are not associated with Golgi fragments.
- Summary table of proteins present (+) or excluded (−) from MT‐nucleating cytoplasmic structures.
- Centrinone‐treated akap KO cells were subjected to a MT regrowth assay and double‐stained with the indicated antibodies. High‐magnification images of the boxed areas are shown as merge (top) or individual green or red labeling (middle and bottom panels).
- Cells lacking AKAP450 were treated with centrinone in order to induce the formation of cytoplasmic aggregates and then transfected with siRNAs specific for CDK5Rap2 (top panels) or PCNT (bottom panels). After 3‐min MT regrowth, cells were fixed and stained with the indicated antibodies.
- MT regrowth experiments in centrinone‐treated akap KO cells transfected with either scramble or PCNT siRNAs. After a 3‐h NZ treatment, MTs were allowed to polymerize and, at the indicated time points after washout, cells were fixed and labeled for α‐tubulin (green), PCNT (red), and CAP350 (blue).
- MT re‐polymerization experiments in centrinone‐treated akap KO cells transfected with either scramble or PCNT siRNAs. After NZ treatment and removal, cells were incubated for 10 min on ice and then warmed for 3 min in culture medium containing either DMSO or 30 μM gatastatin. Cells were finally fixed and triple‐stained with EB1 (green), PCNT (red), and CAP350 (blue) antibodies. Enlarged views of the boxed areas are presented at right.
To identify and characterize the structures responsible for MT nucleation under these conditions, we tested a panel of antibodies against PCM proteins, minus‐end anchoring proteins, and centriole‐associated proteins (listed in Fig 6C). As such, we found that these structures consistently contained PCNT, CDK5Rap2, and γ‐tubulin, but they lacked CEP192 and, in the vast majority of cases, PCM1 (Fig 6D). The MT‐anchoring protein CAP350 was also absent from these structures, while the presence of ninein depended on the size of the structure and it was only detected in some of the larger ones (Fig 6D). None of the centriole markers tested were evident in these structures, such as centrin‐2, CEP63, CP110 (Fig 6D), CEP135, CNAP‐1, and centrobin (Fig EV4C). Therefore, these cytoplasmic structures appear to be similar to centrosomal PCNT‐based complexes, although they are fully capable of nucleating and anchoring MTs and thus of generating cell‐wide arrays of MTs. Analyzing the dynamics of these structures after NZ washout (Fig EV4D) revealed no significant variation in either their number or size during MT polymerization. Thus, these cytoplasmic aggregates exist both in the absence of MTs and in fully assembled MT networks, indicating that they represent stable MT‐nucleating complexes. Since they behave as true stable acentriolar cytoplasmic MTOCs, herein we will refer to these alternative cytoplasmic MT‐nucleating structures as cMTOCs.
To identify factors required for the formation of the cMTOCs, we performed either CDK5Rap2 or PCNT siRNA experiments on akap450 KO centrosome‐less cells (Fig 6E). Once again, knocking‐down CDK5Rap2 did not prevent either the formation of the cMTOCs or MT nucleation from them. By contrast, in the absence of PCNT, neither cMTOCs nor asters of growing MTs could be detected 3 min after NZ washout. We concluded that the absence of a centrosome and MT‐nucleating activity associated with the GA does not preclude the formation of a MT cytoskeleton, which is generated by PCNT‐ and CDK5Rap2‐containing cMTOCs.
Strikingly, depletion of PCNT in centrinone‐treated akap450 KO cells delayed but did not block MT formation (Fig 6E and F), yet scattered MTs were visible throughout the cytoplasm 10 min after NZ washout. This pattern of MT polymerization clearly differs from that of cells containing cMTOCs, in which MTs grew as asters (compare top and bottom panels in Fig 6F). However, in both cases, a disorganized meshwork of MTs completely filled the cytoplasm within 90 min (Fig 6F).
To gain further insight into these two modes of cytoplasmic MT generation, we performed short NZ washouts in cells lacking AKAP450 and the centrosome, in the presence or absence of PCNT (Fig 6G, as indicated). Furthermore, we treated the cells with the γ‐tubulin inhibitor gatastatin that is thought to partially inhibit and delay MT nucleation 34, 35. Cells were treated with NZ, and after removal of the drug, they were incubated for an additional 10 min on ice before inducing MT regrowth by warming. We confirmed the complete disappearance of MTs by processing cells just before warming (Fig EV4E). Emerging MTs were identified by EB1 labeling. As expected, no MT asters were observed in the absence of PCNT, but rather, numerous short randomly located individual EB1 tracks were seen throughout the cytoplasm. MT generation was significantly reduced and delayed by gatastatin treatment (see amplified images in Fig 6G) in both the presence and absence of PCNT, suggesting that γ‐tubulin is involved in both kinds of cytoplasmic MT nucleation.
Regulation of MT number by the centrosome
Finally, we wanted to quantitatively evaluate the effect of manipulating MT nucleation on the overall MT network organization. Thus, we labeled WT, single, and double KO cells, with or without the centrosome, for either α‐tubulin or EB1 (Fig 7A and B: On the right of each panel, a cartoon represents the active MT nucleation sites under each condition tested; see also Fig EV5A). Individual cells were defined, and the MT mass polymer and total EB1 comets were quantified (Fig 7C–F). The MT mass was estimated by quantifying the total α‐tubulin fluorescence in individual cells under each condition, normalizing the data to the mean signal of WT α‐tubulin (Fig 7C). As an independent method to quantify MT number, we determined the number of EB1 comets per cell under all conditions (Fig 7D). In accordance with previous reports 28, we noted that cells without the centrosome appeared larger than control cells (Fig EV5B) with a 30% increase in cell volume (Fig EV5C). As this caused cells without centrosomes to preferentially adhere to larger adhesive micropatterns than control cells (Fig EV5B), we also determined cell area (Fig 7E) and calculated the MT density under each condition by referring the total MT mass‐to‐cell surface ratio (Fig 7F).
Figure 7. The centrosome limits cytoskeleton MT density.
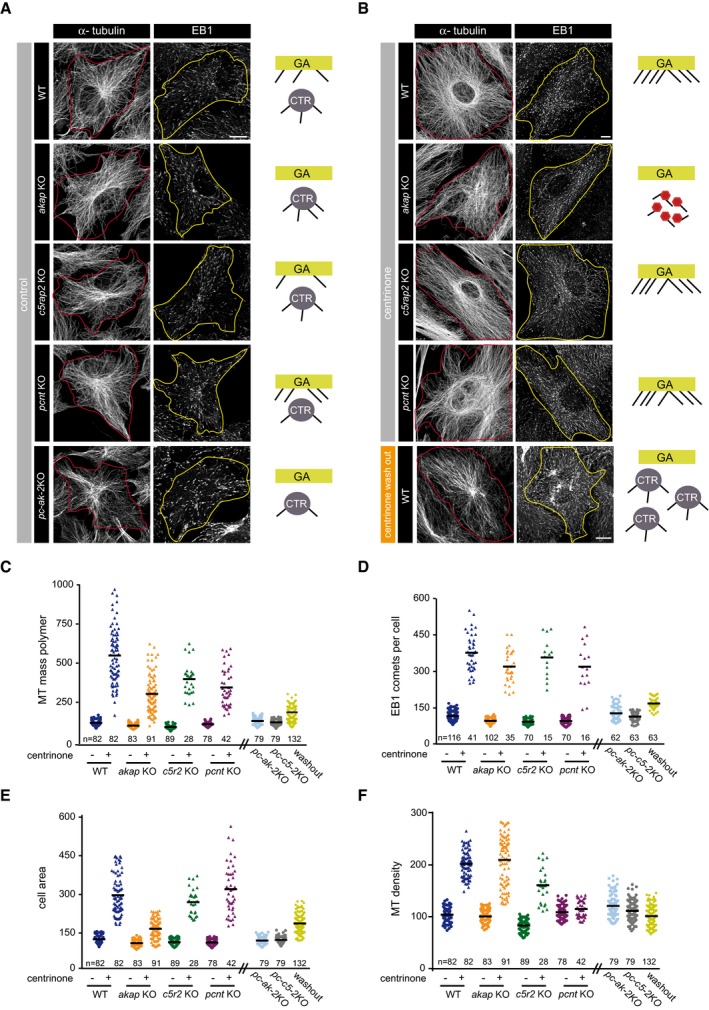
-
AConfocal images showing MT network in WT, akap KO, c5rap2 KO, pcnt KO, and pc‐ak‐2KO RPE‐1 cells fixed and stained with antibodies against α‐tubulin (left) or EB1 (right). The red and yellow lines indicate the contour of cells. A schematic representation of active MTOCs is shown in each case. GA, Golgi apparatus; CTR, centrosome.
-
BSame as in (A), but in centrinone‐treated WT, akap KO, c5rap2 KO, and pcnt KO backgrounds. Cells containing extra centrosomes induced by centrinone washout were also quantified (bottom panels).
-
C–FQuantification of α‐tubulin fluorescence intensity (as a measure of MT mass polymer; C), number of EB1 comets per cell; (D), cell area; and (E), MT density (MT mass polymer/cell area; F) in control and centrinone‐treated WT, akap KO, c5rap2 KO, and pcnt KO cells. Non‐centrinone‐treated double KO cells and centrinone‐treated WT cells after washout were also included. Scatter plots show each individual data point, and horizontal black lines bars represent the mean.
Figure EV5. Impact of centrinone treatment on cell size and overall MT network.
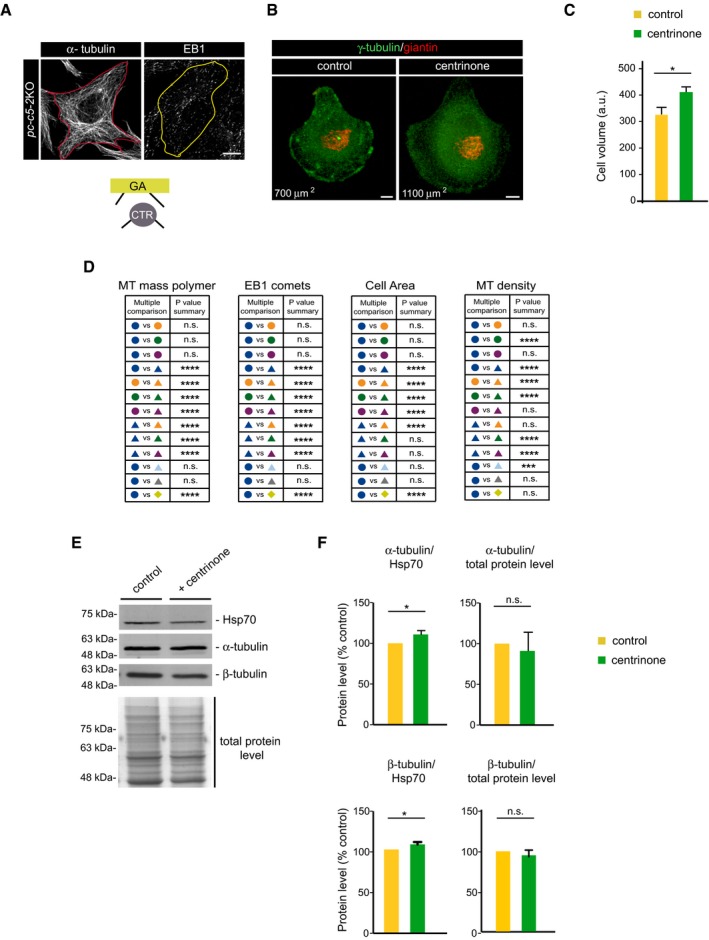
- Confocal images showing MT network in pc‐c5‐2KO RPE‐1 cells fixed and stained with antibodies against α‐tubulin (left) or EB1 (right). The red and yellow lines indicate the contour of the cell. A schematic representation of active MTOCs is shown at the bottom. Scale bars, 5 μm.
- Examples of control and centrinone‐treated cells plated on individual crossbow‐shaped micropatterned coverslips and labeled for γ‐tubulin (green) and giantin (red). Numbers in μm2 represent the approximate cell area depending on the pattern size. Scale bars, 5 ?m.
- Quantitative analysis of cell volume by FACS analysis in control and centrinone‐treated RPE‐1 cells. Arbitrary units (a.u.) in forward scatter (FSC‐H). Bars represent mean values ± SD of three independent experiments.
- Summary tables showing the most relevant data about statistical significance in the multiple comparisons test run for experimental data shown in Fig 7C–E.
- Control and centrinone‐treated RPE‐1 cell extracts (30 μg) were analyzed by WB with the indicated antibodies. At the bottom, a similar amount of cell extract was loaded onto gels and stained with Coomassie Blue for total protein normalization.
- Bar charts show α‐tubulin (top) and β‐tubulin (bottom) levels quantified and normalized against Hsp70 levels or against total protein levels, from three WB experiments as that showed in (E). Error bars represent mean values ± SD.
Depletion of AKAP450, CDK5Rap2, or PCNT, and dual depletion of PCNT‐AKAP450 or PCNT‐CDK5Rap2, led to minor or virtually no reductions in cell area (a 15, 10, 12, 5, and 2% decrease, respectively; Fig 7E). Conversely, the loss of centrosomes resulted in a threefold increase in the surface occupied (275.9%) with respect to untreated WT cells. This increase was significantly higher than that in cell volume determined by FACS analysis of centrosome‐less RPE‐1 cells, suggesting that adhesion to the substrate is altered in centrosome‐less cells. Indeed, we observed a similar increase in cell surface in CDK5Rap2‐depleted cells (248%) and this was even more pronounced in PCNT‐depleted cells (299.8%) in the absence of the centrosome. Centrosome‐less akap450 KO cells were also larger than akap450 KO cells containing a centrosome, albeit less strongly (142%). Unfortunately, it was not possible to deplete double knock‐out cells of their centrosomes. Finally, cells bearing extra centrosomes also increased their size (163.3%). Although additional work is required to further characterize this effect, these results strongly suggest that the number of centrosomes influences cell adhesion.
We also observed changes in MT polymer mass, with AKAP450‐ and PCNT‐depleted cells containing 18 or 9% less MTs than WT cells, respectively. Interestingly, changes in MT polymer mass for these mutants essentially matched those of cell area (Fig 7C and E). Since KO cells are smaller than WT cells, they ultimately had a similar MT density to WT cells (96.6 and 104%, respectively; Fig 7F). A more pronounced effect on MT density was observed upon CDK5Rap2 removal (20.9% decrease), possibly due to its proposed effect on MT stabilization (Fig 7C and F). Strikingly, the dual pcnt/akap450 and pcnt/cdk5rap2 KO cell lines also exhibited modest changes in cell area or MT polymer mass, resulting in almost normal MT density values (117 and 107%, respectively). Note that the changes in EB1 comet number were essentially identical to those in MT polymer mass (compare Fig 7C and D).
Nevertheless, these differences were almost negligible when compared with the effect of centrosome loss on the MT network. Indeed, in the absence of the centrosome, MT polymer mass increased fivefold (550%) and the MT density doubled (199.5%; Fig 7C and F). Centrosome‐less akap450 KO and cdk5rap2 KO cells also contained a larger MT mass than the corresponding KO cells with centrosomes (294.1 and 392.8%, respectively: Fig 7C), which translates to a higher MT density in both cases (207 and 167.6%, respectively). The only exception was for centrinone‐treated pcnt KO cells that had a similar MT density to untreated cells (111%) suggesting that PCNT could be instrumental in connecting centrosome loss to MT density. Finally, the number of EB1 comets augmented more than threefold in the absence of centrosomes in both WT and single KO cell lines (Figs 7D and EV5D).
To test the possibility that the increase in MT density in centrosome‐free cells was due to an increase in global tubulin content, we quantified the α‐ and β‐tubulin in WBs of control and centrinone‐treated cells. There were no substantial differences in either tubulin isoform when normalized to either the Hsp70 or total protein content (Fig EV5E and F), suggesting that the absence of centrosome significantly alters the dimer–polymer equilibrium.
Together, these results suggest that the centrosome controls the number of MTs per cell, irrespective of where they grow from, that is, from the GA in centrinone‐treated cells or from cMTOCs in akap450 KO cells treated with this drug. They also support the notion that the centrosome contributes to the generation of a less dense MT network by restricting global MT nucleation. To confirm this hypothesis, we quantified the same parameters in cells containing a large number of centrosomes induced by washing‐out centrinone. Cells with extra centrosomes had 1.5‐fold more MT mass (159.4%) and EB1 comets (153.3%) than control cells. However, since their cell area increased by the same proportion, their MT density was similar to that of control cells (97%: Fig 7C–F). We speculate that the presence of extra centrosomes could not only dampen GA‐based MT nucleation (see Fig 4) but also MT nucleation from each individual centrosome in order to control the MT cytoskeleton.
Discussion
This work aimed to clarify the functional links between the two major MTOCs in interphase mammalian cells, producing novel and rather unexpected results. Firstly, centrosomes from cells lacking the three PCNT, CDK5Rap2, and AKAP450 proteins can still nucleate MTs. The inhibition of MT nucleation at the GA through AKAP450 depletion does not alter centrosome activity. However, eliminating the centrosome stimulates AKAP450‐dependent MT nucleation at the GA, whereas the existence of a larger number of centrosomes prevents such activity. Moreover, switching off MT nucleation at the GA in cells lacking centrosomes induces the formation of cytoplasmic complexes containing PCNT, CDK5Rap2, and γ‐tubulin, which acquire MT‐nucleating activity. Further depletion of PCNT under these conditions promotes the generation of individual MTs throughout the cytoplasm and both kinds of cytoplasmic MT nucleation involve γ‐tubulin. Finally, regardless of where MTs are being nucleated from, centrosome‐less cells display a denser MT network than normal, although their α/β‐tubulin content is not modified.
The mechanisms behind the apparent hierarchy of MTOCs
The data presented here reveal substantial differences between the role of canonical γ‐TuRC‐binding factors at the centrosome and the GA. The PCNT, AKAP450, or CDK5Rap2 proteins were not required for MT nucleation at the centrosome, and strikingly, centrosomes lacking the three proteins, and probably myomegalin 19, still nucleated MTs almost normally. Conversely, MT nucleation at the GA was perturbed under all conditions, the effects ranging from complete inhibition in AKAP450‐depleted cells to moderate stimulation in cells lacking PCNT. Thus, MT‐generating activity at the GA during interphase depends on canonical γ‐TuRC‐binding proteins, unlike centrosomal nucleation. Our data show that CEP192 plays an important role at the centrosome, both under normal conditions and in the absence of the canonical γ‐TuRC‐binding proteins. Notably, the centrosome retained half of its MT‐nucleating capacity even under these latter conditions, suggesting that additional mechanisms are likely to operate at the centrosome. Indeed, MT nucleation can be promoted independently of γ‐tubulin by proteins such as chTOG and TPX2 36.
Our results are consistent with studies in different organisms, where PCNT either does not participate in MT nucleation during interphase 37, 38 or it may even inhibit MT nucleation at the centrosome 39 and GA 20. Moreover, in cells lacking CDK5Rap2, we did not detect any defects in γ‐TuRC recruitment or MT nucleation at the centrosome, in clear contrast to published data 13, 18, 21. A more extensive analysis will be necessary to define the true contribution of these γ‐TuRC‐binding proteins to centrosomal function during interphase. Although far from well understood at the mechanistic level, our results suggest that PCNT is possibly an important regulator of the influence exerted by the centrosome over the GA. Indeed, the capacity of the GA to nucleate MTs was stimulated by either PCNT depletion or centrosome loss, although to a different extent. PCNT depletion also prevented the increase in MT density induced by centrosome loss. It is possible that PCNT enables the centrosome to somehow sense MT nucleation at other sites due to its capacity to act as a signaling platform 40.
Alternative cytoplasmic‐nucleating sites
It is notable that when both the centrosome and AKAP450 were lacking, MT nucleation occurs from cytoplasmic MTOCs. These cMTOCs were able to organize a cell‐wide MT network, suggesting that they contain all the activities required for the successful formation of MTs. However, of all the centrosomal markers tested, we only detected PCNT, CDK5Rap2, γ‐tubulin, and sporadically, ninein, which could interact with γ‐tubulin‐containing complexes or with PCNT 41, 42. Remarkably, PCNT depletion completely inhibited the formation of cMTOCs, indicating a key role for this protein in the genesis of these structures. We speculate that the activity of PCNT as a scaffold protein for the assembly of the PCM reported previously 7 might also affect the formation of these cMTOCs. It should be noted that cMTOC activity is not generally observed in control cells, despite the abundant cytoplasmic pools of PCNT, CDK5Rap2, and γ‐tubulin. Conceivably, the recruitment of PCNT or CDK5Rap2 to the GA that is observed in centrosome‐less cells containing an active GA‐MTOC could correspond to complexes formed from the cytosolic pool of these proteins upon the suppression of the centrosome, and these complexes may be further sequestered by the GA.
Cytoplasmic MT nucleation foci were detected in early blastomeres of mouse embryos which lack centrioles and in Drosophila embryonic mitoses after centrosome inactivation 43, 44. In addition, acentriolar cytoplasmic MT‐nucleating structures have been observed in centrosome‐less human cells depleted of the ubiquitin ligase, TRIM37 45, or in cells depleted of AKAP450 and CAMSAP2 that lack centrosomes 28. However, these acentriolar entities clearly differ in both composition and structure from the cMTOCs reported here (see also Refs 46, 47). In any case, these observations do reveal the ability of PCM proteins to assemble into different kinds of MT‐nucleating complexes when the centrosome is absent. The possibility that GA‐associated MT nucleation might also be down‐regulated physiologically, leading to the formation of cytoplasmic MTOCs, is so far mere speculation. Theoretically, however, these cMTOCs could confer plasticity to the MT nucleation process, and thus, they might facilitate the organization of complex MT arrays in terminally differentiated cells.
Microtubule nucleation at the GA fully relies on complexes containing AKAP450, while that at cMTOCs requires PCNT. One may wonder why complexes containing PCNT and AKAP450 concentrate at the centrosome during interphase in control cells if their contribution to MT nucleation is negligible. Perhaps, the centrosome controls the organization of the cell's MT network in two ways: (i) by recruiting MT‐nucleating activities, such as CEP192; and (ii) by sequestering factors necessary for MT assembly elsewhere, such as regulatory components of PCNT complexes for cytoplasmic assembly or of AKAP450 complexes for GA‐associated MT nucleation. In this way, the centrosome could control the number of MTs within the cell by suppressing or dampening spontaneous assembly in the cytoplasm or assembly at the GA. In support of this hypothesis, centriole‐mediated suppression of MT nucleation in the cytosol was predicted from observations on mitosis in early Caenorhabditis elegans blastomeres 48. The notion that inhibiting one MT‐generating pathway can be compensated by stimulating the activity of another was initially proposed on the basis of the mechanisms that contribute to spindle formation in Drosophila embryo mitosis 44. However, our data suggest that different MTOCs do not occupy equivalent positions in the regulatory cascade, at least during interphase, and they situate the GA under the control of the centrosome. The dominant role of the centrosome in human cells also agrees with previous observations from cell fusion experiments of mitotic and differentiated intestinal cells performed in C. elegans embryos 49.
Notably, when all MT nucleation is apparently inhibited (i.e., in cells lacking the centrosome, AKAP450, and PCNT), numerous individual MTs still form throughout the cytoplasm that eventually organizes a MT network. MT generation was significantly delayed by gatastatin in this assay, indicating that γ‐tubulin is involved in this kind of cytoplasmic MT nucleation. Individual MT cytoplasmic nucleation from single γ‐TuRCs has been identified as the main mechanism of endoplasmic MT generation in protonemal cells of Physcomitrella patens 50. We show here that the mammalian cytoplasm also possesses this capacity, although whether it is employed in a physiological context is an exciting question that deserves further study.
A novel view on how the centrosome organizes the MT network at interphase
The global MT network configuration in individual cells is defined by the number of MTs and how these MTs are organized. Here, we provide evidence that the centrosome is not only able to control the distribution of cellular MT‐nucleating activity and hence MT organization, but also, it helps maintain the steady‐state number of MTs.
We found that in the absence of a centrosome, both in WT cells in which the GA becomes the only MTOC, or in akap450 KO cells in which MTs are nucleated from cMTOCs, the MT density was double that of control cells. In other words, centrosome loss increased the MT number, indicating that centrosomal control of MT number is achieved by down‐regulating the MT nucleation capacity of alternative MTOCs. Remarkably, this increase in MT density was prevented by PCNT but not by CDK5Rap2, suggesting a specific role of PCNT in the global regulation of MT nucleation. Overall, our data highlight a new role of the centrosome, namely that of restricting the total amount of assembled tubulin in cells.
It is also important to emphasize that global MT density was not significantly reduced when GA MT nucleation was inhibited, as occurs in AKAP450‐depleted cells. Likewise, cells bearing extra centrosomes only slightly increased the number of MTs. Thus, MT number is apparently a robust feature of cells, suggesting that they have the ability to respond to significant modifications in the MT nucleation activity of their MTOCs. The centrosome is the key factor for this exquisite control of MT number, since it is completely lost in the absence of a centrosome. Although pure speculation, one might imagine that inactivation of the centrosome during cell differentiation could release its control over MT number, allowing differentiated cells to create a denser MT network. Indeed, more MTs are detected both in young myotubes 51 and in pancreatic β‐cells where they regulate insulin secretion 12.
MT network changes during cell differentiation
Although there are diverse mechanisms underlying MT reorganization during cell differentiation, dampening the MT‐nucleating activity of the centrosome, or even centrosome elimination, is a quite common strategy 9. In neurons, muscle, or pancreatic cells, MT formation is ensured by Golgi membranes 10, 11, 12. Inactivation of the centrosome is usually accompanied by shedding PCM components such as γ‐tubulin, PCNT, CDK5Rap2, or AKAP450. Interestingly, these proteins are associated with Golgi membranes in both differentiated cells 11, 52 and in centrinone‐induced centrosome‐less cells (see herein). Again, in both cases, MT nucleation was driven by AKAP450, whereas CDK5Rap2 and, especially, PCNT, had no significant influence 52. These results suggest that centrinone‐treated cells mimic the behavior of naturally occurring centrosome‐inactivated differentiated cells. Why centrosome activity must be modified during cell differentiation is another issue. In any case, the constitutive plasticity of MT network organization demonstrated here, both in terms of MT number and sites of nucleation, would permit reorganization when necessary during differentiation.
In summary, this study provides us with an unexpected view of the interphase centrosome in human cells and of how plasticity in the control of the interphase MT network is ensured. In addition to its known role as a MT nucleator, the centrosome also controls MT network organization by dampening MT nucleation at the GA and suppressing it in the cytoplasm, thereby limiting MT formation and acting as a sensor of the overall MT network.
Materials and Methods
Cell culture, antibodies, and treatments
Immortalized human pigment epithelial cells hTERT‐RPE1 (ATCC) were grown in DMEM/F12 supplemented with 10% FBS at 37°C in 5% CO2. hTERT‐RPE1 FRT/TO cells were provided by J Pines (Gurdon Institute, Cambridge, UK).
hTERT‐RPE1 cells were treated with 125 nM centrinone (kindly provided by K Oegema and A Siau, Ludwig Institute for Cancer Research, La Jolla, CA), for 4–7 days to induce centrosome depletion as previously described 32. For washout experiments, we treated the cells with centrinone for either 5 days (Fig 4) or 12 h (Fig 7), and after washout of the drug, cells were maintained for 48 h prior to analysis. Gatastatin was a gift from T. Usui (University of Tsukuba, Japan) and I. Hayakawa (Okayama University, Japan).
For CYTOOchips experiments, control and centrinone‐treated cells were seeded on Starter′s CYTOOchips (CYTOO SA, Grenoble, France) following the manufacturer′s protocol. Briefly, trypsinized cells were diluted to a concentration of 12,500 cells/ml, 50,000 cells dispensed into each micropattern and allowed to sediment for 10 min under the hood before moving them to the incubator. After 45 min, the medium was changed, the coverslip surface was gently flushed, and finally, cells were allowed to spread for 5 h before fixation.
SC3‐1 and SC3‐2 anti‐CDK5Rap2 rabbit polyclonal antibodies were generated by Biomedal S.L. (Seville, Spain). To this purpose, constructs containing amino acids 650–900 or 1,400–1,600 of human CDK5Rap2 were inserted into the expression vector pMAB36‐6xHis‐LYTAG, and the resulting fusion proteins were purified by using the C‐LYTAG fusion protein purification system.
Rabbit polyclonal anti‐AKAP450 (A24), human sera against GMAP210, and mouse monoclonal anti‐CAP350 have been previously described 24, 53. Rabbit polyclonal anti‐PCM1 was from Bethyl laboratories (A301‐149A‐T). Monoclonal anti‐α‐tubulin (clone DM1A; T6199), anti‐γ‐tubulin (clone GTU88; T6557), and rabbit polyclonal anti‐centrobin (HPA023321) were from Sigma‐Aldrich; mouse monoclonal anti‐centrin‐2 (clone 20H5; 04‐1624), rabbit polyclonal anti‐CEP63 (06‐1292), and rabbit polyclonal anti‐CDK5Rap2 (Mi; 06‐1398) were from Millipore. Mouse monoclonal anti‐EB1 (clone 5/EB1; 610534) and anti‐AKAP450 (7/AK; clone 7/AKAP450; 611518) were from BD Biosciences. Mouse monoclonal anti‐CNAP‐1 (clone F‐7, sc‐390540) was from Santa Cruz Biotechnology. Rabbit polyclonal anti‐GFP (RGFP‐45A‐Z) was from ICL, rabbit polyclonal anti‐CP110 (12780‐1‐AP) was from Proteintech Group, and rabbit polyclonal anti‐AKAP9 (Av; ARP39871_P050) was from Aviva Systems Biology. Rabbit polyclonal anti‐CEP135 (ab75005), mouse monoclonal anti‐Hsp70 (clone BRM‐22, ab6535), mouse monoclonal (Abc‐M; mAbcam 28144), and rabbit polyclonal anti‐PCNT (Abc‐R; ab4448) were from Abcam. Goat polyclonal anti‐AKAP450 (Ct‐AK; MBS420313) was from MYBiosource.com, and rabbit polyclonal antibodies to pericentrin were from Biomatik (Ct‐PCNT; CAU23943) and Covance (Cov; PRB‐432C). Human anti‐α‐tubulin (F2C‐hFc2; A‐R‐H#02), anti‐β‐tubulin (S11BhFc1; A‐R‐H#23), and anti‐giantin (TA10 hFc2; A‐R‐H#03) were from the recombinant antibody platform of the Institut Curie. Rabbit anti‐CEP192, anti‐GM130, and goat anti‐CAP350 were generous gifts from L. Pelletier (Lunenfeld‐Tanenbaum Research Institute, Toronto, Canada), Y. Misumi (Fukuoka University, Japan), and E. Nigg (Biozentrum, University of Basel, Switzerland), respectively. All secondary antibodies were from Jackson ImmunoResearch.
Constructions, transfections, and RNA interference
The sequences of the siRNAs used were as follows: PCNTB‐1: 5′ AAAAGCTCTGATTTATCAAAAGAAG; PCNTB‐2: 5′ TGATTGGACGTCATCCAATGAGAAA; CDK5Rap2: 5′ CCTAAAGCTCCGCATCTATTT; CEP192‐1: 5′ CACATGATGCCTGCTAGTT; CEP192‐2: 5′ GACACTTTCTTCATGAGCA; and CEP192‐3: 5′ GGACTTAAGTGCTACTAGT. Scrambled siRNA was used as control. Duplexes were obtained from either Life Technologies or Sigma‐Aldrich. Assays were performed 72–96 h after transfection.
GFP‐AK1, GFP‐AK2, GFP‐AK3, and GFP‐AK4 fusion proteins have been previously described [27]. Both DNA and siRNA transfections were performed with Neon Transfection System (Invitrogen) by following instructions from the supplier.
CRISPR/Cas9 mutagenesis of akap450, cdk5rap2, and pericentrin genes in hTERT‐RPE1 cells
In order to generate RPE‐1 cell lines lacking either AKAP450, CDK5Rap2, or PCNT proteins, we first generated a new plasmid based on the Cas9‐nickase‐containing plasmid pSpCas9n (BB)‐2A‐GFP (PX461) (a gift from Feng Zhang, Addgene plasmid # 48140). We introduced in the XbaI site of PX461 a 409 bp DNA fragment containing a hU6 promoter, sgRNA BsaI cloning sites, and a scaffold RNA coding sequence. This fragment was obtained by PCR of pGL3‐U6‐sgRNA‐PGK‐puromycin (a gift from Xingxu Huang, Addgene plasmid # 51133) using the primers pFA2 (TCTAGAGAGCGGCCGCCCCCTTCACC) and pFA3 (TCTAGAGTCTCGAGGTCGAGGATTC). The new plasmid named plFA1 contains the features of PX461, an additional cloning site for an sgRNA coding sequence flanked by a hU6 promoter and a scaffold RNA coding sequence. plFA1 allows the expression of the Cas9n protein and two sgRNAs from a single plasmid, thus increasing the efficiency and the specificity of mutagenesis. Primers for targeting the exon 2 of akap450, the exon 1 of cdk5rap2, and the exon 5 of pcnt were designed and cloned into plFA1 following Feng Zhang Crispr web tools and protocols (http://crispr.mit.edu/). To facilitate the cloning of complementary primer pairs into plFA1, they were designed with overhand ends homologous to the overhands DNA strands generated by the digestion of plFA1 with BbsI or BsaI enzymes. The primer pairs used to generate the sgRNA coding sequences targeting akap450 exon 2 were CACCGAGAAATAACCAGTCATGAGC/AAACGCTCATGACTGGTTATTTCTC (to be cloned into the BbsI sites of plFA1) and CCGGGTTCTCATTATTGTAGATTC/AAACGAATCTACAATAATGAGAAC (to be cloned into the BsaI sites of pLFA1). The sequences of the primer pairs used to generate the sgRNA coding sequences targeting CDK5RAP2 exon 1 were CACCGAAGAGGACGTCACCGTCCCT/AAACAGGGACGGTGACGTCCTCTTC (to be cloned into the BbsI sites of plFA1) and CCGGCAAGTCCATCATGGCTACAG/AAACCTGTAGCCATGATGGACTTG (to be cloned into the BsaI sites of pLFA1). The primer pairs used to generate the sgRNA coding sequences targeting pcnt exon 5 were CACCGCAACATGCACACGGCGCAGC/AAACGCTGCGCCGTGTGCATGTTGC (BbsI sites) and CCGGGGCGCAGCGCCTCCAGCTCA/AAACTGAGCTGGAGGCGCTGCGCC (BsaI sites). The final plasmids containing the two sgRNAs coding sequences for targeting each of the genes were electroporated in RPE‐1 FRT/TO cells 54 with the Neon Transfection System (Invitrogen) following instructions from the supplier. Positively transfected cells (i.e., expressing the GFP reporter) were selected 48 h after transfection with the cell sorter FACSAria (BD Biosciences) pooled together and maintained. Cells were then analyzed by IF using anti‐AKAP450 antibody (A24), anti‐CDK5Rap2 antibody (Millipore), and anti‐PCNT (Abc‐R), respectively, in order to assess the efficiency of the mutagenesis process. Populations with a high frequency of mutant cells (i.e., more than 10% of cells negative for antibody staining) were used to isolate cells in a 96‐well plate format to generate clones. Pure clones carrying the mutations were selected by IF and further analyzed. Both RPE‐1 PCNT‐AKAP450 and PCNT‐CDK5RAP2 double KO cell lines were generated based on PCNT KO using the plasmid described before.
In order to sequence the mutated genomic region a fragment of approximately 500 bp covering the targeted area was amplified by PCR with the following primers: akap450‐FW 5′ AAGCAGTGAATGACAGTGCC, akap450‐RV 5′ ATCCCTGTCAAAATCCGTGG; cdk5rap2‐FW 5′ CTAGAAAAGCAAACACGAGG, cdk5rap2‐RV 5′ TTGTCCAACTCTAGCCAAGG; and pcnt‐FW 5′ GCTCTGTTATCCCCACAGGGCACAG, pcnt‐RV 5′ ACACCGTGACTTCCAGACACACAGG. The PCR products were cloned in pGEM‐T vector and sequenced using SP6 and T7 primers.
RNA isolation, retro‐transcription, and real‐time PCR
Total RNA was isolated using the RNeasy® Mini kit according to the manufacturer's instruction (QIAGEN®) and including DNase I digestion to avoid potential contaminations of DNA. Complementary DNA (cDNA) was synthesized with 3 μg of total RNA using random hexamers and SuperScript III Reverse Transcriptase (Invitrogen™). cDNAs were diluted in sterile water and used as template for the amplification by the PCR. Optimization and amplification of each specific gene product were performed using the Applied Biosystems 7500 Fast Real‐time PCR System (Thermo Fisher Scientific). Relative mRNA expression levels of the indicated genes were calculated by the method, using the expression of the GAPDH housekeeping gene as endogenous control. The designed primer sequences were as followings: for AKAP450 mRNA expression: AK1‐FW 5′ AGAAGACTTCACAATGCAAATTAGT, AK1‐RV 5′ TGATTGTCTCCTTTTCCTGTATTTC; AK2‐FW 5′ GAACACTATGTTGCCGTTCAGTT, AK2‐RV 5′ TGCTAGCTCAGGAATTGAGGA; and AK3‐FW 5′ GAAATTAACTGGCCAGCAAGG, AK3‐RV 5′ CCCTGTCAGCTCAGCATTTT. For PCNT mRNA expression: PC1‐FW 5′ CAGAACAGCGTGGGATCTTC, PC1‐RV 5′ TCTCCAGGTCAGTAATGGCAA; PC2‐FW 5′ TCCACGTGAAGGAAGACTG, PC2‐RV 5′ GAAGGCATCTTGTTCCGCAC; and PC3‐FW 5′ GGCTTCTCACCAGCTTCACC, PC3‐RV 5′ ACTTCAGCTCCTCCAACGTG. For CDK5Rap2 mRNA expression: C5R1‐FW 5′ CACGGAACATGAAGGACTTTG, C5R1‐RV 5′ TCCTGTTGCATTCTTTCCTCA; and C5R2‐FW 5′ TTCTTCTCACGAGACCAGAAGC, C5R2‐RV 5′ TTTCTCAAAGTTCGAATTTCCTGT. GAPDH: GAPDH‐FW 5′ GGAAGGTGAAGGTCGGAGTC, GAPDH‐RV 5′GTTGAGGTCAATGAAGGGGTC.
SDS–PAGE, Western blotting, immunoprecipitation, and MT regrowth assays
Proteins were separated by SDS–PAGE, and gels were either stained with Coomassie Blue or transferred to nitrocellulose filters and blocked for 1 h at 37°C in TBST [10 mM Tris/HCl (pH = 7.4)/150 mM NaCl/0.1% (v/v) Tween 20] containing 5% (w/v) non‐fat‐dried milk. Filters were then incubated for 1–2 h at 37°C with the primary antibody in the same buffer, washed, and incubated for 45 min at 37°C with the secondary anti‐rabbit or anti‐mouse IgG antibodies conjugated with peroxidase (Amersham). Densitometry analysis for quantification of the bands of Western blots was done by ImageJ software. For co‐IPs, cells were lysed in NP40 buffer [10 mM Tris/HCl (pH 7.4)/150 mM NaCl/10% (v/v) glycerol/1% (v/v) Nonidet P40/1 mM PMSF and 1 μg/ml of each pepstatin, leupeptin, and aprotinin] for 20 min at 4°C and then for 3 min at 37°C. The extract was centrifuged at 20,000 g for 20 min and soluble fraction pre‐adsorbed with an irrelevant antibody on Protein A‐Sepharose or Protein G‐Agarose for 2 h. Then, the extract was incubated with beads alone or immunoprecipitated with 0.5–1 μl of the antibody of interest on Protein A‐Sepharose or Protein G‐Agarose for another 2 h. After washing, bead pellets were analyzed by WB.
For re‐polymerization experiments, MTs were depolymerized with NZ (10 μM) for 3 h. Cells were rinsed five times with ice‐cold medium, and regrowth was induced by incubation in pre‐warmed medium (37°C). All the MT regrowth experiments were carried out at room temperature. In Fig 6G, after NZ treatment, cells were incubated in culture medium containing DMSO/30 μM gatastatin for 10 min on ice. Cells were then placed in culture medium at 37°C in the presence of gatastatin or the DMSO solvent control and fixed at the indicated time points.
Immunofluorescence and image analysis
Cells were grown on glass coverslips and fixed with cold methanol (6 min at −20°C). Then, cells were incubated with primary antibodies for 1 h at RT, washed with PBS‐Tween 0.1%, and incubated with the appropriate fluorescent secondary antibody for 40 min. Nuclei were counterstained with DAPI (1 μg/ml) after secondary antibody labeling.
Confocal images were captured by a confocal Leica TCS SP5 using a HCX PL APO Lambda blue 63 × 1.4 OIL objective at 22°C, and they correspond to maximal projections. Image processing was carried out using the Leica (LAS) and Adobe Photoshop softwares. For presentation, whole images were adjusted for intensity level, contrast, and/or brightness.
Quantification of EB1 comets around the centrosome (Fig 2A and E) was done in ImageJ as previously described 55. Briefly, the background signal was subtracted using a rolling‐ball radius of 50, a ROI of 3 μm radius was drawn around the CAP350 signal at the centrosome, and EB1 comets were detected with the “Find Maxima” tool. As an alternative approach to measure centrosomal microtubule nucleation (Fig 2C and G), EB1 fluorescence intensity was measured with MetaMorph Offline software in re‐polymerization experiments 3 min after NZ washout. In order to exclude variability in the density of the aster due to time or temperature conditions, all the quantifications of the MT regrowth experiments were done in mixed populations of either WT and KO cells or siRNA scramble and CEP192‐transfected cells. For quantification of the fluorescence intensity of AKAP450, CDK5Rap2, PCNT, and γ‐tubulin at the centrosome (Fig 3), a similar procedure was used, but a ROI of 1.5 μm radius was drawn around the CAP350 signal.
For quantifying MT nucleation from the GA (Fig 4), control and centrinone‐treated cells were subjected to a 3‐min MT regrowth assay, fixed, and labeled for EB1 (green) and giantin (red). Double channel confocal images were analyzed by a customized software developed by Wimasis (Wimasis GmbH, Munich, Germany). For each image, the total number of growing microtubules, the number of MT‐nucleating Golgi fragments, and the number of MTs nucleated per Golgi fragment were determined. Finally, single cells were delineated and centrosomes of control cells were also identified and excluded from the analysis. Analysis of MT nucleation from the GA in washout experiments was performed by selecting cells with either 6 or ≥ 8 visible centrioles and dividing them into two categories: cells with or without MT nucleation activity from the GA. Control and centrinone‐treated cells were also analyzed for comparison.
Analysis of co‐localization between the different markers and the Golgi membranes (Fig 3I) was done by using MetaMorph software. All images from the same experiment were acquired using identical microscope settings and avoiding saturation of the brightest pixels. A threshold was set individually for each channel and applied to all the images. The software calculates the intensity of co‐localization between the two channels where both labelings are positive over the threshold. Regions of interest were drawn in the merged image around cells excluding the centrosome and overlaid on the others channels. All the co‐localization experiments were done in NZ‐treated cells. Quantification of EB1 intensity at the Golgi membranes in Figs 2J and 5F was done following the same procedure, but MTs were allowed to polymerize for 3 min. This standard co‐localization analysis cannot be used to determine the association between PCM proteins and Golgi fragments in control and centrinone‐treated cells (Fig 5) since PCM proteins accumulate as dots juxtaposed but not overlapping with Golgi elements. Alternatively, quantification was performed by manually selecting those Golgi fragments with visible‐associated PCM‐protein foci and measuring the integrated fluorescence intensity of these spots, after background signal subtraction.
For quantification of MT mass polymer, cell area, and MT density (MT mass polymer/cell area; Fig 7), images were processed with MetaMorph Offline software. Regions of interest were drawn around cells, and after background subtraction, resulting fluorescence intensities and areas were estimated with the “region measurements” tool. Quantification of EB1 comets/cell in z‐projected images was done in ImageJ as described for Fig 2A.
FACS analysis
Cells were collected by centrifugation, washed with PBS, and fixed in 70% ethanol at −20°C for at least 1 h. The analysis was done on a BD FACSCalibur flow cytometer (Becton Dickinson, USA). Forward scatter (FSC‐H) was used as a measure of the cell size.
Statistical analysis
Quantitative data are expressed as mean ± SD. Alternatively, data values between 10th and 90th percentiles are displayed either in scatter or box‐and‐whisker plots. Significant differences among groups were evaluated by unpaired two‐tailed Student's t‐test or one‐way ANOVA followed by Tukey or Dunnett′s multiple comparison tests, as appropriate (GraphPad Prism software) and indicated when relevant.
Author contributions
MPG and PG designed and conducted the main parts of the experiments. FA generated some reagents. FRB performed some of the experiments and provided helpful suggestions for research direction. MB contributed to the design of the project and analysis of data. RMR designed and directed the study. MPG, PG, FRB, MB, and RMR all contributed to writing and reviewing the manuscript.
Conflict of interest
The authors declare that they have no conflict of interest.
Supporting information
Appendix
Expanded View Figures PDF
Source Data for Expanded View
Review Process File
Source Data for Figure 1
Source Data for Figure 3
Acknowledgements
We thank K. Oegema and A. Siau (Ludwig Institute for Cancer Research, La Jolla, CA) for generously providing centrinone. We are grateful to L. Pelletier (Lunenfeld‐Tanenbaum Research Institute, Toronto, Canada) and Y. Misumi (Fukuoka University, Japan) for antibodies and to T. Usui (University of Tsukuba, Japan) and I. Hayakawa (Okayama University, Japan) for gatastatin. RPE‐1 FRT/TO cells were a kind gift from J. Pines (Gurdon Institute, Cambridge, UK). We also thank for the help provided by members of Microscopy Core Facility of CABIMER. This work was made possible by funding from the Ministerio de Economia y Competitividad and Junta de Andalucia (grants BFU2015‐65747‐P and CTS‐2071 to RM Rios). P. Gandolfo was supported by the Ministerio de Educacion, Cultura y Deporte through a FPU pre‐doctoral fellowship. FR. Balestra is a recipient of a Marie Curie IEF Postdoctoral Fellowship and the postdoctoral contract of MP. Gavilan is funded by the Spanish Association Against Cancer (AECC).
EMBO Reports (2018) 19: e45942
References
- 1. Bornens M (2012) The centrosome in cells and organisms. Science 335: 422–426 [DOI] [PubMed] [Google Scholar]
- 2. Rios RM (2014) The centrosome‐Golgi apparatus nexus. Philos Trans R Soc Lond B Biol Sci 369: 20130462 [DOI] [PMC free article] [PubMed] [Google Scholar]
- 3. Teixido‐Travesa N, Roig J, Luders J (2012) The where, when and how of microtubule nucleation ‐ one ring to rule them all. J Cell Sci 125: 4445–4456 [DOI] [PubMed] [Google Scholar]
- 4. Chabin‐Brion K, Marceiller J, Perez F, Settegrana C, Drechou A, Durand G, Pous C (2001) The Golgi complex is a microtubule‐organizing organelle. Mol Biol Cell 12: 2047–2060 [DOI] [PMC free article] [PubMed] [Google Scholar]
- 5. Efimov A, Kharitonov A, Efimova N, Loncarek J, Miller PM, Andreyeva N, Gleeson P, Galjart N, Maia AR, McLeod IX et al (2007) Asymmetric CLASP‐dependent nucleation of noncentrosomal microtubules at the trans‐Golgi network. Dev Cell 12: 917–930 [DOI] [PMC free article] [PubMed] [Google Scholar]
- 6. Prosser SL, Pelletier L (2017) Mitotic spindle assembly in animal cells: a fine balancing act. Nat Rev Mol Cell Biol 18: 187–201 [DOI] [PubMed] [Google Scholar]
- 7. Fry AM, Sampson J, Shak C, Shackleton S (2017) Recent advances in pericentriolar material organization: ordered layers and scaffolding gels. F1000Res 6: 1622 [DOI] [PMC free article] [PubMed] [Google Scholar]
- 8. Maia AR, Zhu X, Miller P, Gu G, Maiato H, Kaverina I (2013) Modulation of Golgi‐associated microtubule nucleation throughout the cell cycle. Cytoskeleton (Hoboken) 70: 32–43 [DOI] [PMC free article] [PubMed] [Google Scholar]
- 9. Muroyama A, Lechler T (2017) Microtubule organization, dynamics and functions in differentiated cells. Development 144: 3012–3021 [DOI] [PMC free article] [PubMed] [Google Scholar]
- 10. Ori‐McKenney KM, Jan LY, Jan YN (2012) Golgi outposts shape dendrite morphology by functioning as sites of acentrosomal microtubule nucleation in neurons. Neuron 76: 921–930 [DOI] [PMC free article] [PubMed] [Google Scholar]
- 11. Oddoux S, Zaal KJ, Tate V, Kenea A, Nandkeolyar SA, Reid E, Liu W, Ralston E (2013) Microtubules that form the stationary lattice of muscle fibers are dynamic and nucleated at Golgi elements. J Cell Biol 203: 205–213 [DOI] [PMC free article] [PubMed] [Google Scholar]
- 12. Zhu X, Hu R, Brissova M, Stein RW, Powers AC, Gu G, Kaverina I (2015) Microtubules negatively regulate insulin secretion in pancreatic beta cells. Dev Cell 34: 656–668 [DOI] [PMC free article] [PubMed] [Google Scholar]
- 13. Muroyama A, Seldin L, Lechler T (2016) Divergent regulation of functionally distinct gamma‐tubulin complexes during differentiation. J Cell Biol 213: 679–692 [DOI] [PMC free article] [PubMed] [Google Scholar]
- 14. Kollman JM, Merdes A, Mourey L, Agard DA (2011) Microtubule nucleation by gamma‐tubulin complexes. Nat Rev Mol Cell Biol 12: 709–721 [DOI] [PMC free article] [PubMed] [Google Scholar]
- 15. Lin TC, Neuner A, Schiebel E (2015) Targeting of gamma‐tubulin complexes to microtubule organizing centers: conservation and divergence. Trends Cell Biol 25: 296–307 [DOI] [PubMed] [Google Scholar]
- 16. Dictenberg JB, Zimmerman W, Sparks CA, Young A, Vidair C, Zheng Y, Carrington W, Fay FS, Doxsey SJ (1998) Pericentrin and gamma‐tubulin form a protein complex and are organized into a novel lattice at the centrosome. J Cell Biol 141: 163–174 [DOI] [PMC free article] [PubMed] [Google Scholar]
- 17. Takahashi M, Yamagiwa A, Nishimura T, Mukai H, Ono Y (2002) Centrosomal proteins CG‐NAP and kendrin provide microtubule nucleation sites by anchoring gamma‐tubulin ring complex. Mol Biol Cell 13: 3235–3245 [DOI] [PMC free article] [PubMed] [Google Scholar]
- 18. Choi YK, Liu P, Sze SK, Dai C, Qi RZ (2010) CDK5RAP2 stimulates microtubule nucleation by the gamma‐tubulin ring complex. J Cell Biol 191: 1089–1095 [DOI] [PMC free article] [PubMed] [Google Scholar]
- 19. Roubin R, Acquaviva C, Chevrier V, Sedjai F, Zyss D, Birnbaum D, Rosnet O (2013) Myomegalin is necessary for the formation of centrosomal and Golgi‐derived microtubules. Biol Open 2: 238–250 [DOI] [PMC free article] [PubMed] [Google Scholar]
- 20. O'Rourke BP, Gomez‐Ferreria MA, Berk RH, Hackl AM, Nicholas MP, O'Rourke SC, Pelletier L, Sharp DJ (2014) Cep192 controls the balance of centrosome and non‐centrosomal microtubules during interphase. PLoS One 9: e101001 [DOI] [PMC free article] [PubMed] [Google Scholar]
- 21. Cota RR, Teixido‐Travesa N, Ezquerra A, Eibes S, Lacasa C, Roig J, Luders J (2017) MZT1 regulates microtubule nucleation by linking gammaTuRC assembly to adapter‐mediated targeting and activation. J Cell Sci 130: 406–419 [DOI] [PubMed] [Google Scholar]
- 22. Luders J, Patel UK, Stearns T (2006) GCP‐WD is a gamma‐tubulin targeting factor required for centrosomal and chromatin‐mediated microtubule nucleation. Nat Cell Biol 8: 137–147 [DOI] [PubMed] [Google Scholar]
- 23. Manning JA, Shalini S, Risk JM, Day CL, Kumar S (2010) A direct interaction with NEDD1 regulates gamma‐tubulin recruitment to the centrosome. PLoS One 5: e9618 [DOI] [PMC free article] [PubMed] [Google Scholar]
- 24. Rivero S, Cardenas J, Bornens M, Rios RM (2009) Microtubule nucleation at the cis‐side of the Golgi apparatus requires AKAP450 and GM130. EMBO J 28: 1016–1028 [DOI] [PMC free article] [PubMed] [Google Scholar]
- 25. Wang Z, Wu T, Shi L, Zhang L, Zheng W, Qu JY, Niu R, Qi RZ (2010) Conserved motif of CDK5RAP2 mediates its localization to centrosomes and the Golgi complex. J Biol Chem 285: 22658–22665 [DOI] [PMC free article] [PubMed] [Google Scholar]
- 26. Wang Z, Zhang C, Qi RZ (2014) A newly identified myomegalin isoform functions in Golgi microtubule organization and ER‐Golgi transport. J Cell Sci 127: 4904–4917 [DOI] [PMC free article] [PubMed] [Google Scholar]
- 27. Hurtado L, Caballero C, Gavilan MP, Cardenas J, Bornens M, Rios RM (2011) Disconnecting the Golgi ribbon from the centrosome prevents directional cell migration and ciliogenesis. J Cell Biol 193: 917–933 [DOI] [PMC free article] [PubMed] [Google Scholar]
- 28. Wu J, de Heus C, Liu Q, Bouchet BP, Noordstra I, Jiang K, Hua S, Martin M, Yang C, Grigoriev I et al (2016) Molecular pathway of microtubule organization at the Golgi apparatus. Dev Cell 39: 44–60 [DOI] [PubMed] [Google Scholar]
- 29. Sato Y, Hayashi K, Amano Y, Takahashi M, Yonemura S, Hayashi I, Hirose H, Ohno S, Suzuki A (2014) MTCL1 crosslinks and stabilizes non‐centrosomal microtubules on the Golgi membrane. Nat Commun 5: 5266 [DOI] [PubMed] [Google Scholar]
- 30. Yang C, Wu J, de Heus C, Grigoriev I, Liv N, Yao Y, Smal I, Meijering E, Klumperman J, Qi RZ et al (2017) EB1 and EB3 regulate microtubule minus end organization and Golgi morphology. J Cell Biol 216: 3179–3198 [DOI] [PMC free article] [PubMed] [Google Scholar]
- 31. Shen Y, Liu P, Jiang T, Hu Y, Au FKC, Qi RZ (2017) The catalytic subunit of DNA polymerase delta inhibits gammaTuRC activity and regulates Golgi‐derived microtubules. Nat Commun 8: 554 [DOI] [PMC free article] [PubMed] [Google Scholar]
- 32. Wong YL, Anzola JV, Davis RL, Yoon M, Motamedi A, Kroll A, Seo CP, Hsia JE, Kim SK, Mitchell JW et al (2015) Cell biology. Reversible centriole depletion with an inhibitor of Polo‐like kinase 4. Science 348: 1155–1160 [DOI] [PMC free article] [PubMed] [Google Scholar]
- 33. Popp MW, Maquat LE (2016) Leveraging rules of nonsense‐mediated mRNA decay for genome engineering and personalized medicine. Cell 165: 1319–1322 [DOI] [PMC free article] [PubMed] [Google Scholar]
- 34. Chinen T, Liu P, Shioda S, Pagel J, Cerikan B, Lin TC, Gruss O, Hayashi Y, Takeno H, Shima T et al (2015) The gamma‐tubulin‐specific inhibitor gatastatin reveals temporal requirements of microtubule nucleation during the cell cycle. Nat Commun 6: 8722 [DOI] [PMC free article] [PubMed] [Google Scholar]
- 35. Bouguenina H, Salaun D, Mangon A, Muller L, Baudelet E, Camoin L, Tachibana T, Cianferani S, Audebert S, Verdier‐Pinard P et al (2017) EB1‐binding‐myomegalin protein complex promotes centrosomal microtubules functions. Proc Natl Acad Sci USA 114: E10687–E10696 [DOI] [PMC free article] [PubMed] [Google Scholar]
- 36. Woodruff JB, Ferreira Gomes B, Widlund PO, Mahamid J, Honigmann A, Hyman AA (2017) The centrosome is a selective condensate that nucleates microtubules by concentrating tubulin. Cell 169: 1066–1077 e1010 [DOI] [PubMed] [Google Scholar]
- 37. Dammermann A, Merdes A (2002) Assembly of centrosomal proteins and microtubule organization depends on PCM‐1. J Cell Biol 159: 255–266 [DOI] [PMC free article] [PubMed] [Google Scholar]
- 38. Zimmerman WC, Sillibourne J, Rosa J, Doxsey SJ (2004) Mitosis‐specific anchoring of gamma tubulin complexes by pericentrin controls spindle organization and mitotic entry. Mol Biol Cell 15: 3642–3657 [DOI] [PMC free article] [PubMed] [Google Scholar]
- 39. Lerit DA, Rusan NM (2013) PLP inhibits the activity of interphase centrosomes to ensure their proper segregation in stem cells. J Cell Biol 202: 1013–1022 [DOI] [PMC free article] [PubMed] [Google Scholar]
- 40. Arquint C, Gabryjonczyk AM, Nigg EA (2014) Centrosomes as signalling centres. Philos Trans R Soc Lond B Biol Sci 369: 20130464 [DOI] [PMC free article] [PubMed] [Google Scholar]
- 41. Delgehyr N, Sillibourne J, Bornens M (2005) Microtubule nucleation and anchoring at the centrosome are independent processes linked by ninein function. J Cell Sci 118: 1565–1575 [DOI] [PubMed] [Google Scholar]
- 42. Chen CT, Hehnly H, Yu Q, Farkas D, Zheng G, Redick SD, Hung HF, Samtani R, Jurczyk A, Akbarian S et al (2014) A unique set of centrosome proteins requires pericentrin for spindle‐pole localization and spindle orientation. Curr Biol 24: 2327–2334 [DOI] [PMC free article] [PubMed] [Google Scholar]
- 43. Maro B, Johnson MH, Webb M, Flach G (1986) Mechanism of polar body formation in the mouse oocyte: an interaction between the chromosomes, the cytoskeleton and the plasma membrane. J Embryol Exp Morphol 92: 11–32 [PubMed] [Google Scholar]
- 44. Hayward D, Metz J, Pellacani C, Wakefield JG (2014) Synergy between multiple microtubule‐generating pathways confers robustness to centrosome‐driven mitotic spindle formation. Dev Cell 28: 81–93 [DOI] [PMC free article] [PubMed] [Google Scholar]
- 45. Meitinger F, Anzola JV, Kaulich M, Richardson A, Stender JD, Benner C, Glass CK, Dowdy SF, Desai A, Shiau AK et al (2016) 53BP1 and USP28 mediate p53 activation and G1 arrest after centrosome loss or extended mitotic duration. J Cell Biol 214: 155–166 [DOI] [PMC free article] [PubMed] [Google Scholar]
- 46. Baumbach J, Novak ZA, Raff JW, Wainman A (2015) Dissecting the function and assembly of acentriolar microtubule organizing centers in Drosophila cells in vivo . PLoS Genet 11: e1005261 [DOI] [PMC free article] [PubMed] [Google Scholar]
- 47. Sir JH, Putz M, Daly O, Morrison CG, Dunning M, Kilmartin JV, Gergely F (2013) Loss of centrioles causes chromosomal instability in vertebrate somatic cells. J Cell Biol 203: 747–756 [DOI] [PMC free article] [PubMed] [Google Scholar]
- 48. Zwicker D, Decker M, Jaensch S, Hyman AA, Julicher F (2014) Centrosomes are autocatalytic droplets of pericentriolar material organized by centrioles. Proc Natl Acad Sci USA 111: E2636–E2645 [DOI] [PMC free article] [PubMed] [Google Scholar]
- 49. Yang R, Feldman JL (2015) SPD‐2/CEP192 and CDK are limiting for microtubule‐organizing center function at the centrosome. Curr Biol 25: 1924–1931 [DOI] [PubMed] [Google Scholar]
- 50. Nakaoka Y, Kimura A, Tani T, Goshima G (2015) Cytoplasmic nucleation and atypical branching nucleation generate endoplasmic microtubules in Physcomitrella patens . Plant Cell 27: 228–242 [DOI] [PMC free article] [PubMed] [Google Scholar]
- 51. Tassin AM, Maro B, Bornens M (1985) Fate of microtubule‐organizing centers during myogenesis in vitro . J Cell Biol 100: 35–46 [DOI] [PMC free article] [PubMed] [Google Scholar]
- 52. Gimpel P, Lee YL, Sobota RM, Calvi A, Koullourou V, Patel R, Mamchaoui K, Nedelec F, Shackleton S, Schmoranzer J et al (2017) Nesprin‐1alpha‐dependent microtubule nucleation from the nuclear envelope via Akap450 is necessary for nuclear positioning in muscle cells. Curr Biol 27: 2999–3009 e2999 [DOI] [PMC free article] [PubMed] [Google Scholar]
- 53. Gavilan MP, Arjona M, Zurbano A, Formstecher E, Martinez‐Morales JR, Bornens M, Rios RM (2015) Alpha‐catenin‐dependent recruitment of the centrosomal protein CAP350 to adherens junctions allows epithelial cells to acquire a columnar shape. PLoS Biol 13: e1002087 [DOI] [PMC free article] [PubMed] [Google Scholar]
- 54. Mansfeld J, Collin P, Collins MO, Choudhary JS, Pines J (2011) APC15 drives the turnover of MCC‐CDC20 to make the spindle assembly checkpoint responsive to kinetochore attachment. Nat Cell Biol 13: 1234–1243 [DOI] [PMC free article] [PubMed] [Google Scholar]
- 55. Burute M, Prioux M, Blin G, Truchet S, Letort G, Tseng Q, Bessy T, Lowell S, Young J, Filhol O et al (2017) Polarity reversal by centrosome repositioning primes cell scattering during epithelial‐to‐mesenchymal transition. Dev Cell 40: 168–184 [DOI] [PMC free article] [PubMed] [Google Scholar]
Associated Data
This section collects any data citations, data availability statements, or supplementary materials included in this article.
Supplementary Materials
Appendix
Expanded View Figures PDF
Source Data for Expanded View
Review Process File
Source Data for Figure 1
Source Data for Figure 3