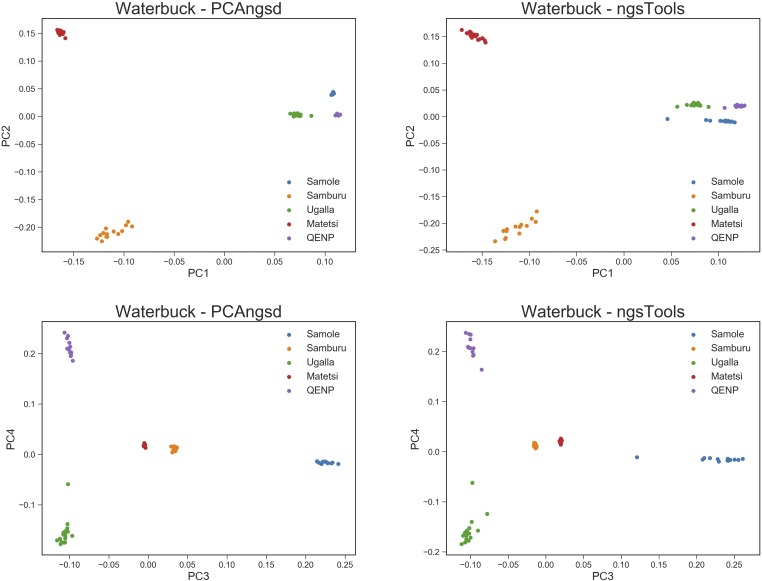
Figure 5.
PCA plots of the top four principal components for the waterbuck dataset with 73 individuals and 9.4 million variable sites. The first row displays the plots of the first and second principal components for PCAngsd and the ngsTools model, respectively, while the second row displays the plots of the third and fourth principal components.

