Abstract
With the spread of positron emission tomography/magnetic resonance (PET/MR), the question of comparability of studies becomes important. We aim to determine whether PET/MR and PET/computed tomography (PET/CT) are comparable for the case of cervical cancer. Fifteen cervical cancer patients identified by either a radiation oncologist or an oncologic surgeon had both PET/MR and PET/CT performed for initial staging within 3 weeks. We then compared the results both quantitatively (measuring standardized uptake values [SUVs] on visible lesions) as well as qualitatively (having radiologists and nuclear medicine physicians interprets the results). While interpretations between PET/MR and PET/CT varied in many cases, SUVs of primary lesions were similar to within 25% in all but one case, and correlation coefficient was 0.92. Maximum SUV ranged between 4.9 and 25.2 for PET-MR and between 5.8 and 30.4 for PET-CT for primary tumors and between 1.5 and 18.8 for PET-MR and between 1.8 and 20.8 for PET-CT for nodes. However, clinical reads often varied significantly between PET/MR and PET/CT. This suggests that SUV is similar on PET/MR and PET/CT although the differing anatomic modalities available for correlation may make the difference in terms of qualitative interpretation.
Keywords: Cervical cancer, positron emission tomography/computed tomography, positron emission tomography/magnetic resonance, standardized uptake value
INTRODUCTION
Both positron emission tomography/computed tomography (PET/CT) and magnetic resonance imaging (MRI) have important roles in staging of gynecologic cancers, with MRI being more useful in assessing primary tumor and local extension and PET/CT in assessing for nodal and distant metastatic disease.[1] PET/CT has also been used to assess response to therapy for chemotherapy, radiation, and surgery (detecting residual disease) in cervical cancer, although less commonly than in other tumors such as lymphoma (National Comprehensive Cancer Network). PET findings have been shown to correlate with survival when assessed before,[2] after,[3,4] as well as during[5,6,7] radiotherapy for cervical cancer for up to 5 years.[8]
PET/magnetic resonance (PET/MR) imaging is an emerging modality that combines PET with MR, hoping to marry the functional assessment of PET to the superior soft tissue contrast of MR. At present, it is still being validated. An important question is whether attenuation correction between MR and CT is similar.[9] PET/MR has been shown to have identical lesion visibility in cancers such as lymphoma,[10] with maximum standardized uptake value (SUVmax) on PET/MR about 15%–25% less than PET/CT.[11] PET/MR has been shown to have similar sensitivity to PET/CT and better local staging ability in small pilot studies of assorted gynecological cancers,[12,13] and it has even been suggested that biomarkers from PET/CT and MR could be combined to aid in prognostication.[14] Recently, a large study of over 2000 patients has shown that PET/MR and PET/CT have similar utility in a wide variety of cancers.[15] This study cited three previous studies[12,13,16] on a variety of gynecologic cancers, each with about seven to eight cervical cancer patients, which showed good correlation between PET/MR and PET/CT. We aim to assess the strength of correlation of PET/CT and PET/MR in cervical cancer in particular. The primary aim of this study was to look at the correlation of the two studies performed within a short time frame (<3 weeks).
SUBJECTS AND METHODS
Ethics
Informed consent was obtained from patients for this study, which was approved by the Institutional Review Board (IRB 12-1946) and was HIPAA compliant and in accordance with the Declaration of Helsinki, 1975.
Selection and description of participants
Eighteen women with at least stage IB cervical cancer and no prior treatment were consented for this trial. One patient refused (index number 1), and another could not complete the PET/MR examination due to claustrophobia (index number 7). Another (index number 17) did not have a PET/CT within a few weeks of the PET/MR. Patients ranged in age from 26 to 65 years, with a mean age of 45 years.
Technical information
Using a Siemens Biograph mMR, simultaneous acquisition of PET/MR images of the pelvis before initial treatment was obtained. MR and PET sequence data and protocol are given in Tables 1 and 2. Image acquisition was completed in about 35 min. PET images of the primary tumor were interpreted by a board-certified nuclear medicine physician.
Table 1.
Positron emission tomography sequence parameters
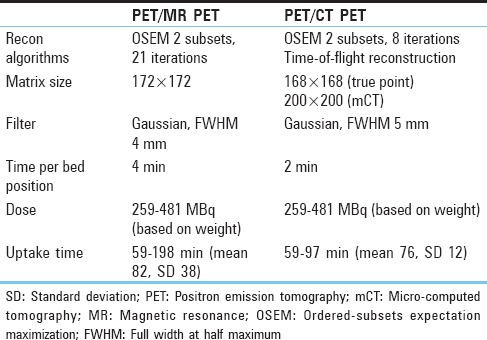
Table 2.
Magnetic resonance sequences

In the majority of patients,[15] a PET/CT was obtained within 3 weeks of the PET/MR. A flowchart showing available data for each patient is given in Figure 1 (two patients, indices 8 and 9, were imaged using the same injection; patient 15 had same-day imaging with two different injections). Most PET/CTs were done using our standard PET/CT protocol on a Siemens Biograph micro-CT (patient with index 2 was compared to an outside PET/CT). Nondiabetic patients fasted for 6 h. Diabetic patients fasted and did not administer insulin. As per the standard PET routine, patients were asked to remain still in a relaxed setting and refrain from speaking. Further technical details are given in Table 1. Dose and uptake time were similar for the PET/CT and PET/MR protocol. No intravenous or oral contrast was given. The PET images were then reviewed to assess differences in attenuation correction and in some cases clinical planning. PET images were reinterpreted by the same nuclear medicine physician after a duration of 2 months for this study. SUVmax was calculated using MIMvista (MIM Software, Cleveland, Ohio, USA).
Figure 1.
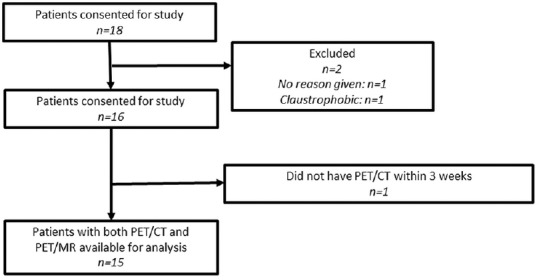
STARD diagram for our study
Statistics
The sample was too small for a reliable regression, but agreement could still be assessed through a correlation coefficient between PET/MR and PET/CT. Relative differences in SUVmax between PET/MR and PET/CT were also calculated to give a sense of whether the difference between PET/MR and PET/CT fell within the usual range of PET variability. Cohen's kappa was used to assess agreement between qualitative PET/MR and PET/CT reads.
RESULTS
Overall quantitative values of MR and PET findings are presented in Table 3. On two of the studies (indices 17 and 18), a primary tumor could not be visualized. Pretreatment examinations demonstrated maximum tumor size ranging from 1.7 to 8.7 cm, with SUVmax for the tumors ranging from 5.6 to 25.2. SUVmax ranged between 4.9 and 25.2 for PET-MR (mean 14.5, standard deviation [SD] 6.6) and between 5.8 and 30.4 for PET-CT (mean 15.5, SD 7.7) for primary tumors and between 1.5 and 18.8 for PET-MR (mean 4.8, SD 4.3) and between 1.8 and 20.8 for PET-CT (mean 5.6, SD 5.0) for nodes.
Table 3.
Positron emission tomography and magnetic resonance findings, primary tumor and nodes
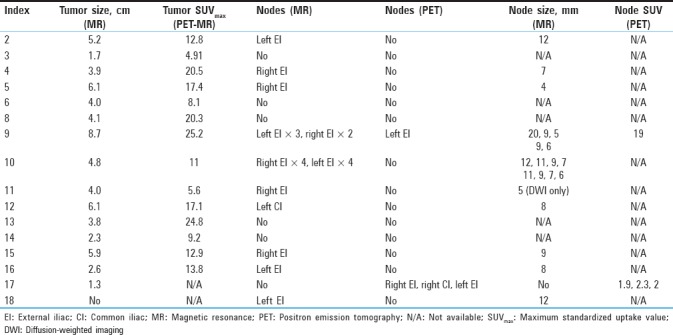
SUVmax was similar between PET/CT and PET/MR in the majority of cases for primary tumors [Table 4], in all but one being within 33%, and strongly correlated with r = 0.92 [Figure 2]. Interestingly, the two patients with wide discrepancies between PET-MR and PET-CT uptake times (patients 8 and 9) nonetheless had relatively close SUVmax. While this is unacceptable for quantitative applications in a scientific setting, in the clinical setting, most results were within the 20% study-to-study variation typical of PET.[17,18,19] SUVmax on nodes called by either PET-CT or PET-MR was also remeasured on both images [Table 5], and while more variable in relative terms (likely due to lower uptake) SUVmax on one modality was usually within 1.5 absolute SUV unit of the other. The most prominent example of increased variation is shown in Figure 3, where susceptibility effects corrupted the MR attenuation correction.
Table 4.
Maximum standardized uptake value, positron emission tomography-magnetic resonance versus positron emission tomography-computed tomography
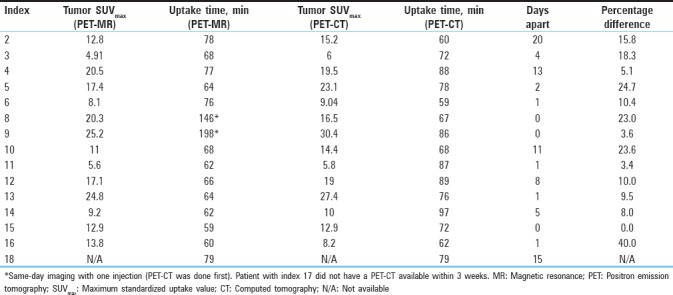
Figure 2.
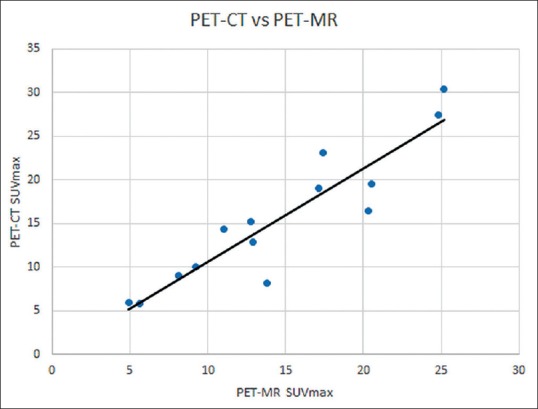
Positron emission tomography-magnetic resonance versus positron emission tomography-computed tomography. The values are strongly correlated, with maximum standardized uptake value for positron emission tomography-computed tomography being slightly higher
Table 5.
Positron emission tomography-computed tomography and positron emission tomography-magnetic resonance of nodes (where detected)
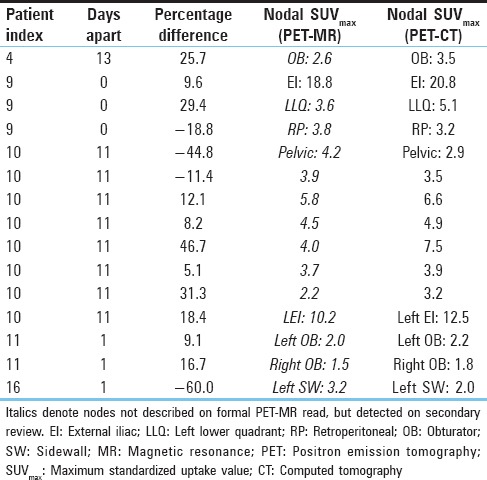
Figure 3.
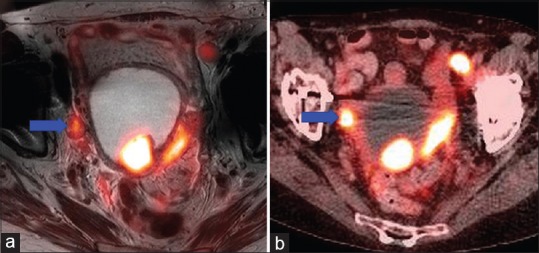
Positron emission tomography/magnetic resonance (a) showing less intense uptake of nodal metastasis (blue arrow) compared to positron emission tomography/computed tomography (b) likely due to errors in attenuation correction resulting from susceptibility artifacts around a hip arthroplasty
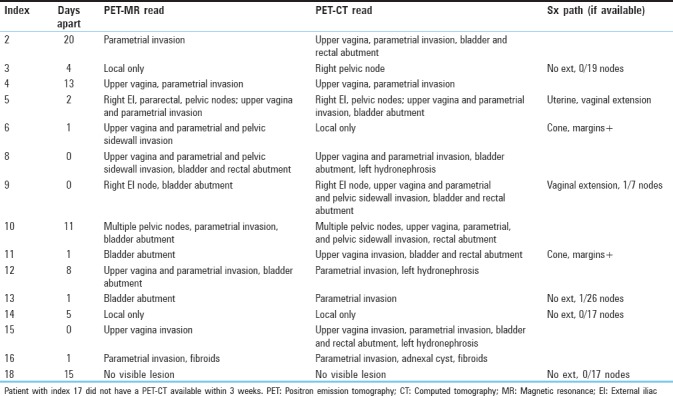
Approximately half of the patients had surgical confirmation (four who were treated surgically and three who had subsequent surgery). On several occasions, PET/MR interpretations were at variance with the PET/CT interpretations performed by the standard clinical team [Table 6]. In general, while the modalities agreed perfectly on the presence or absence of a primary tumor, and there was substantial agreement on the presence of nodal spread (k = 0.667) and moderate agreement on pelvic sidewall invasion (k = 0.513) and parametrial invasion (k = 0.455), there was slight to no agreement on bladder (k = 0.167) and rectal (k = −0.129) abutment and invasion of the upper two-thirds of the vagina (k = 0.242) (invasion of the lower third of the vagina was not detected in any patient). As the PET/CT was a whole-body image, there were additional incidental findings such as ovarian cysts (located superiorly enough not to be visualized on purely pelvic imaging) and a small lung nodule (unchanged 5 months later at last cross-sectional imaging) that were not visualized on a pelvic MR. Hydronephrosis was similarly seen on three PET/CTs, but not on PET/MR, simply due to the larger coverage.
Table 6.
Positron emission tomography-computed tomography and positron emission tomography-magnetic resonance interpretations
DISCUSSION
In terms of key findings, in general, the relative similarity of quantitative interpretation did not carry through to interpretive agreement with PET/CT. However, surgical and pathologic confirmation was available in only in four cases. In two cases, the PET/CT interpretation identified multiple nodes that were not called on PET/MR; these may have been metabolically active ovaries (harder to identify on PET/CT) or actual new nodes. If identifiable on both, the nodes were usually similar [Table 6] in SUVmax, with two exceptions. In one patient (index 10), the nodes all had SUVmax on PET-CT similar to their PET-MR values, except one node which had a much lower PET-MR value near a susceptibility artifact from a hip replacement [Figure 4]. In the other patient (index 16), the node was off by the same factor of about 40% as the primary tumor, suggesting a systematic error (the time may have been recorded incorrectly). The general pattern is thus that measurements are quantitatively preserved but may vary significantly based on interpretation of the accompanying anatomic (CT or MR) modality. We were able to acquire a complete PET-MR of the pelvis in 30 min, and further refinements may be possible (we made little use of the diffusion-weighted sequences, for instance).
Figure 4.
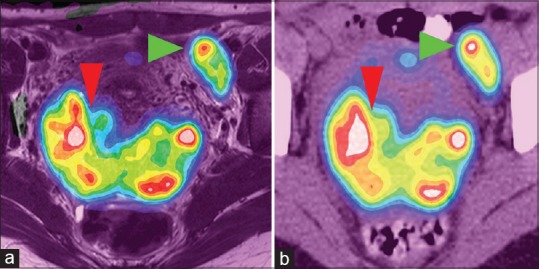
Positron emission tomography/magnetic resonance (a) and positron emission tomography/computed tomography (b) showing similar uptake patterns in primary tumor (red arrowhead, maximum standardized uptake value 25.2 vs. 30.4) and nodal metastasis (green arrowhead, 18.8 vs. 20.8). Each color represents an standardized uptake value range of 2, pink representing a standardized uptake value over 20
In terms of strengths and limitations, we do have a relatively sample focused specifically on cervical cancer on PET/MR. As far as limitations go, the small sample size naturally limits the power and sensitivity of the results as does the lack of pathologic confirmation in most cases. The reconstruction algorithms for PET/MR and PET/CT differed considerably, and this may have introduced additional error into a parameter such as SUVmax which is prone to being affected by differences in processing. However, this also further suggests that quantitation between PET/MR and PET/CT remains robust even with these differences taken into account.
With time elapsing between the PET/MR and PET/CT, it is possible some clinically important event may have occurred between one and the other (no treatment was done between one and the other in our study, however). PET varied widely in assessing bladder and rectal abutment as well as local invasion of the upper vagina, although PET is generally not used for local staging in most tumors. Since our protocol only allowed for pelvic MR, the rest of the body could not be staged, and hence, congruence with PET/CT in the chest and abdomen could not be assessed, although more extensive protocols are available for cancer staging.
Future research directions might include larger sample sizes, acquiring PET/CT and PET/MR after the same injection, and focusing on other gynecologic cancers.
CONCLUSION
PET/MR gives reasonably similar results to PET/CT for quantitative purposes. For qualitative interpretation, the correlation with the anatomic imaging modality may become more important.
Financial support and sponsorship
Nil.
Conflicts of interest
There are no conflicts of interest.
REFERENCES
- 1.Kusmirek J, Robbins J, Allen H, Barroilhet L, Anderson B, Sadowski EA, et al. PET/CT and MRI in the imaging assessment of cervical cancer. Abdom Imaging. 2015;40:2486–511. doi: 10.1007/s00261-015-0363-6. [DOI] [PubMed] [Google Scholar]
- 2.Kim HJ, Rhee WJ, Choi SH, Nam EJ, Kim SW, Kim S, et al. Clinical outcomes of adjuvant radiation therapy and prognostic factors in early stage uterine cervical cancer. Radiat Oncol J. 2015;33:126–33. doi: 10.3857/roj.2015.33.2.126. [DOI] [PMC free article] [PubMed] [Google Scholar]
- 3.Yoon JW, Kim S, Kim SW, Kim YT, Kang WJ, Nam EJ, et al. PET/CT response criteria (European organization for research and treatment of cancer) predict survival better than response evaluation criteria in solid tumors in locally advanced cervical cancer treated with chemoradiation. Clin Nucl Med. 2016;41:677–82. doi: 10.1097/RLU.0000000000001269. [DOI] [PubMed] [Google Scholar]
- 4.Herrera FG, Breuneval T, Prior JO, Bourhis J, Ozsahin M. [(18) F] FDG-PET/CT metabolic parameters as useful prognostic factors in cervical cancer patients treated with chemo-radiotherapy. Radiat Oncol. 2016;11:43. doi: 10.1186/s13014-016-0614-x. [DOI] [PMC free article] [PubMed] [Google Scholar]
- 5.Liu FY, Lai CH, Yang LY, Wang CC, Lin G, Chang CJ, et al. Utility of (18) F-FDG PET/CT in patients with advanced squamous cell carcinoma of the uterine cervix receiving concurrent chemoradiotherapy: a parallel study of a prospective randomized trial. Eur J Nucl Med Mol Imaging. 2016;43:1812–23. doi: 10.1007/s00259-016-3384-7. [DOI] [PubMed] [Google Scholar]
- 6.Krhili S, Muratet JP, Roche S, Pointreau Y, Yossi S, Septans AL, et al. Use of metabolic parameters as prognostic factors during concomitant chemoradiotherapy for locally advanced cervical cancer. Am J Clin Oncol. 2017;40:250–55. doi: 10.1097/COC.0000000000000159. [DOI] [PubMed] [Google Scholar]
- 7.Oh D, Lee JE, Huh SJ, Park W, Nam H, Choi JY, et al. Prognostic significance of tumor response as assessed by sequential 18F-fluorodeoxyglucose-positron emission tomography/computed tomography during concurrent chemoradiation therapy for cervical cancer. Int J Radiat Oncol Biol Phys. 2013;87:549–54. doi: 10.1016/j.ijrobp.2013.07.009. [DOI] [PubMed] [Google Scholar]
- 8.Siva S, Deb S, Young RJ, Hicks RJ, Callahan J, Bressel M, et al. 18F-FDG PET/CT following chemoradiation of uterine cervix cancer provides powerful prognostic stratification independent of HPV status: a prospective cohort of 105 women with mature survival data. Eur J Nucl Med Mol Imaging. 2015;42:1825–32. doi: 10.1007/s00259-015-3112-8. [DOI] [PubMed] [Google Scholar]
- 9.Schramm G, Maus J, Hofheinz F, Petr J, Lougovski A, Beuthien-Baumann B, et al. Evaluation and automatic correction of metal-implant-induced artifacts in MR-based attenuation correction in whole-body PET/MR imaging. Phys Med Biol. 2014;59:2713–26. doi: 10.1088/0031-9155/59/11/2713. [DOI] [PubMed] [Google Scholar]
- 10.Atkinson W, Catana C, Abramson JS, Arabasz G, McDermott S, Catalano O, et al. Hybrid FDG-PET/MR compared to FDG-PET/CT in adult lymphoma patients. Abdom Radiol (NY) 2016;41:1338–48. doi: 10.1007/s00261-016-0638-6. [DOI] [PubMed] [Google Scholar]
- 11.Wiesmüller M, Quick HH, Navalpakkam B, Lell MM, Uder M, Ritt P, et al. Comparison of lesion detection and quantitation of tracer uptake between PET from a simultaneously acquiring whole-body PET/MR hybrid scanner and PET from PET/CT. Eur J Nucl Med Mol Imaging. 2013;40:12–21. doi: 10.1007/s00259-012-2249-y. [DOI] [PubMed] [Google Scholar]
- 12.Beiderwellen K, Grueneisen J, Ruhlmann V, Buderath P, Aktas B, Heusch P, et al. [18)F]FDG PET/MRI vs. PET/CT for whole-body staging in patients with recurrent malignancies of the female pelvis: Initial results. Eur J Nucl Med Mol Imaging. 2015;42:56–65. doi: 10.1007/s00259-014-2902-8. [DOI] [PubMed] [Google Scholar]
- 13.Queiroz MA, Kubik-Huch RA, Hauser N, Freiwald-Chilla B, von Schulthess G, Froehlich JM, et al. PET/MRI and PET/CT in advanced gynaecological tumours: initial experience and comparison. Eur Radiol. 2015;25:2222–30. doi: 10.1007/s00330-015-3657-8. [DOI] [PubMed] [Google Scholar]
- 14.Miccò M, Vargas HA, Burger IA, Kollmeier MA, Goldman DA, Park KJ, et al. Combined pre-treatment MRI and 18F-FDG PET/CT parameters as prognostic biomarkers in patients with cervical cancer. Eur J Radiol. 2014;83:1169–176. doi: 10.1016/j.ejrad.2014.03.024. [DOI] [PubMed] [Google Scholar]
- 15.Spick C, Herrmann K, Czernin J. 18F-FDG PET/CT and PET/MRI perform equally well in cancer: evidence from studies on more than 2,300 patients. J Nucl Med. 2016;57:420–30. doi: 10.2967/jnumed.115.158808. [DOI] [PMC free article] [PubMed] [Google Scholar]
- 16.Grueneisen J, Schaarschmidt BM, Heubner M, Suntharalingam S, Milk I, Kinner S, et al. Implementation of FAST-PET/MRI for whole-body staging of female patients with recurrent pelvic malignancies: A comparison to PET/CT. Eur J Radiol. 2015;84:2097–102. doi: 10.1016/j.ejrad.2015.08.010. [DOI] [PubMed] [Google Scholar]
- 17.Minn H, Zasadny KR, Quint LE, Wahl RL. Lung cancer: reproducibility of quantitative measurements for evaluating 2-[F-18]-fluoro-2-deoxy-D-glucose uptake at PET. Radiology. 1995;196:167–73. doi: 10.1148/radiology.196.1.7784562. [DOI] [PubMed] [Google Scholar]
- 18.Nakamoto Y, Zasadny KR, Minn H, Wahl RL. Reproducibility of common semi-quantitative parameters for evaluating lung cancer glucose metabolism with positron emission tomography using 2-deoxy-2-[18F] fluoro-D-glucose. Mol Imaging Biol. 2002;4:171–8. doi: 10.1016/s1536-1632(01)00004-x. [DOI] [PubMed] [Google Scholar]
- 19.Weber WA, Ziegler SI, Thödtmann R, Hanauske AR, Schwaiger M. Reproducibility of metabolic measurements in malignant tumors using FDG PET. J Nucl Med. 1999;40:1771–7. [PubMed] [Google Scholar]


