Abstract
Background
Timely treatment of acute ischemic stroke is crucial to optimize outcomes. Mobile stroke units (MSU) have demonstrated ultrafast treatment compared to standard emergency care. Geospatial analysis of the distribution of MSU cases to optimize service delivery has not been reported.
Methods
We aggregated all first-year MSU dispatch occurrences and all cases classified by clinical teams as true stroke by zip code and calculated dispatch and true stroke incidence rates. We mapped dispatch and stroke cases and symbolized incidence rates by standard deviation. We confirmed visual impressions of clusters from map inspection by local Moran's I, boxplot inspection, and t test. We calculated service areas using drive times to meet dispatch and true stroke need.
Results
A significant cluster of high dispatch incident rate was confirmed around our MSU base in urban Memphis within a 5-min driving area supporting the initial placement of the MSU based on 911 activation. A significant cluster of high true stroke rate was confirmed to the east of our MSU base in suburban Memphis within a 10-min driving area. Mean incident longitude of cases of true stroke versus disregarded status was significantly eastward (p = 0.001785).
Conclusion
Our findings will facilitate determination of socio-spatial antecedents of neighborhood overutilization of 911 and MSU services in our urban neighborhoods and service delivery optimization to reach neighborhoods with true stroke burden.
Keywords: Acute ischemic stroke, Emergency medical services, Mobile stroke unit, Service area analysis, Spatial analysis
Recently updated guidelines for early treatment of acute ischemic stroke recommend that a primary goal of door-to-needle (D2N) time less than or equal to 60 min be maintained and a secondary goal of D2N less than or equal to 45 min be established for administration of tissue plasminogen activator (tPA) to eligible patients [1]. Mobile stroke units (MSU) compared to standard emergency care have achieved ultra-early treatment of acute ischemic stroke [2, 3, 4]. However, the geospatial distribution of actual stroke cases around an MSU hub has yet to be explored, and this factor holds potential to direct location of future units, thereby shortening tPA treatment times.
The University of Tennessee Health Science Center at Memphis (UTHSC) MSU was established to serve our city with a population of 652,717 [5]. Because geographic information systems (GIS) methodology and spatial analysis are fruitful techniques for description of place-bound characteristics associated with 911 dispatch, we aimed to describe the spatial distribution of verified stroke patients, in comparison to non-stroke dispatches. We specifically sought to test the hypothesis: A spatial distribution pattern exists for “true” stroke and non-stroke patients in the city of Memphis.
Methods and Data Sources
The UTHSC Mobile Stroke Unit
We implemented a first-of-its-kind MSU equipped with an ultrafast, high-resolution computed tomography (CT) scanner complete with head/neck CT angiography autojection (Siemens Somatom Scope), staffed with onboard stroke experts (vascular neurology board certified nurse practitioners or vascular neurologists) in lieu of telemedicine, CT technologists, paramedics, and advanced emergency medical technician drivers. The unit is fully integrated within the Memphis Fire Department and 911 system and located at a city fire station [6].
Study Population and Data
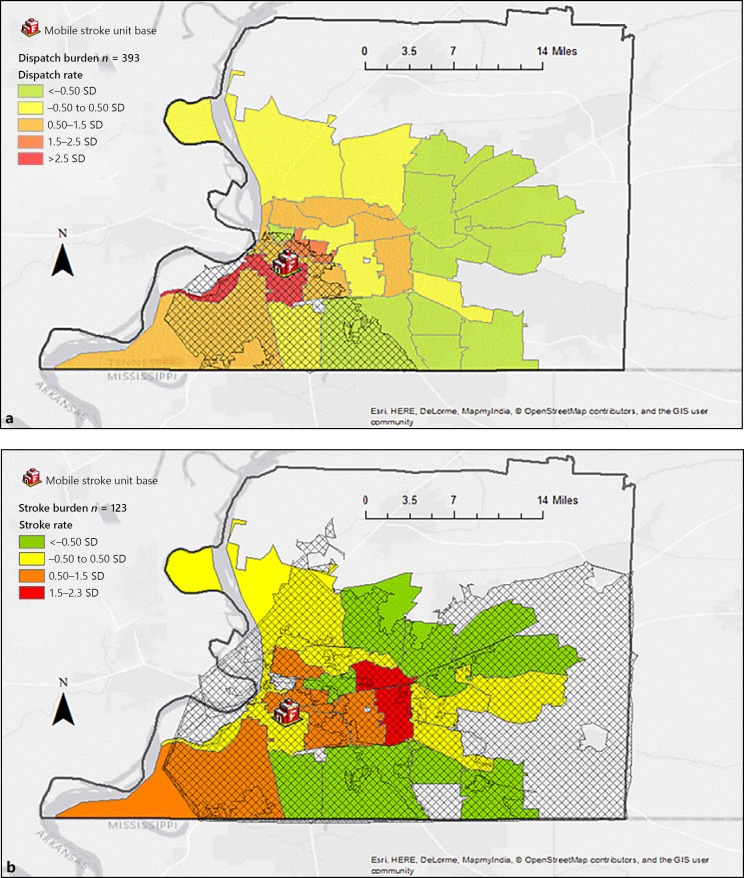
Institutional review board approval was obtained for establishment of an MSU registry to log all relevant dispatch, patient characteristic, scene diagnostic, treatment, and safety data on MSU cases. All MSU cases are automatically reviewed as part of our quality improvement processes to determine agreement between MSU staff and vascular neurology on final formal imaging interpretation, treatment decision making, and final medical diagnoses. This process enables accurate database classification of cases as either stroke mimics versus “true strokes” and promotes continuous improvement of MSU services. Data for the first year of MSU program performance between July 2016 and June 2017 were assembled for analysis. Cases were categorized as “disregarded” for non-stroke diagnoses versus “true strokes” after on-scene assessment by first-responder Memphis Fire Department units and MSU clinical teams, with post hoc scene triage validation by the MSU Quality Improvement Committee. Dispatch incidents were geocoded by zip code centroid as a point feature class using ArcMap 10.5 (Esri, Redlands, CA) and the Esri US zip code address locator [7]. The full street address of our MSU fire department base was geocoded using the same procedures. Five- and ten-minute drive time service areas were defined around the MSU base as a guide to map inspection using the Network Analyst extension and Shelby County, Tennessee 911 road network data [8]. The set of all dispatch incidents and the subset of true stroke incidents were spatially joined with the zip code shapefile, raw counts were normalized to population, and the resulting incidence rate was symbolized by standard deviation and mapped for inspection. High burden of dispatch and true stroke was defined as greater than or equal to 1.5 standard deviations.
Analysis Plan
Visual impressions after map inspection were confirmed by hypothesis tests using local Moran's I in ArcMap and by boxplot and t test in R [9] using the ArcMap-R bridge (source: https://github.com/ R-ArcGIS/r-bridge). Drive time service areas were recalculated as a guide to map inspection to cover the bulk of confirmed clusters.
Results
A total of 420 MSU dispatch cases occurred within the study period, and of these, 393 were successfully geocoded and included in the analysis. Figure 1a and b illustrates the spatial characteristics of “dispatch” versus “true stroke” cases. A territory of high dispatch burden (n = 393) was apparent within the 5-min inner city MSU service area, with the bulk of true stroke burden (n = 123) lying to the east of our MSU base in suburban Memphis requiring a 10-min drive time for service.
Fig. 1.
a MSU dispatch burden. Crosshatch indicates 5-min service area. b MSU stroke burden. Crosshatch indicates 10-min service area. Projection: NAD 1983 UTM zone 16N. Data sources: MSU Registry, Shelby County 911 Open Data.
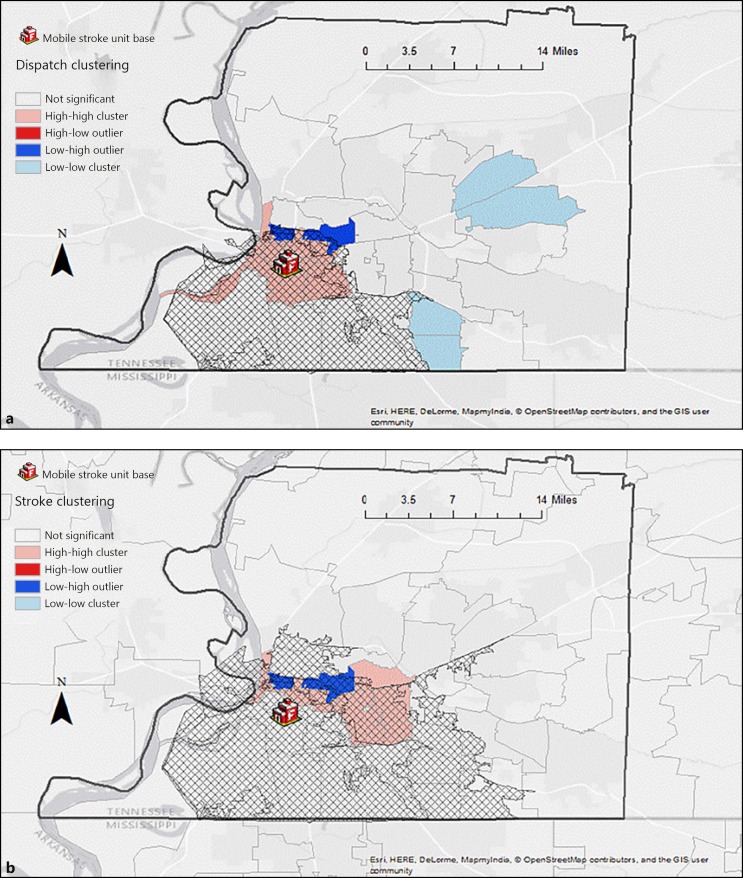
This visual impression was confirmed by testing the null hypothesis of spatial randomness by cluster and outlier analysis with local Moran's I (Fig. 2a, b). Statistically significant clusters of high dispatch and high stroke burden were confirmed; 6- and 8-min service areas were needed, respectively, to cover the bulk of these clusters.
Fig. 2.
a MSU dispatch cluster. Crosshatch indicates 6-min service area. b MSU stroke cluster. Crosshatch indicates 8-min service area. Projection: NAD 1983 UTM zone 16N. Data sources: MSU Registry, Shelby County 911 Open Data.
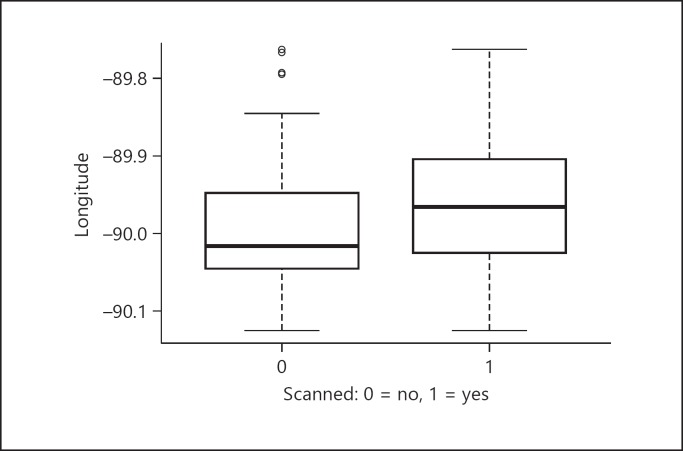
The visual impression that the cluster of true stroke burden lies to the east of the cluster of dispatch burden was confirmed by inspection of a boxplot of longitude by clinical team status assignment (accepted for CT scanning and transport, versus disregarded) (Fig. 3). Increased longitude (becoming less negative as one proceeds from west to east) was associated with true stroke versus disregarded status. Because the interquartile range was overlapping, the visual result was confirmed by Welch two-sample t test, demonstrating that as incident longitude from base increased, likelihood of true stroke increased (p = 0.001785; see Appendix for detailed output).
Fig. 3.
Confirmation of eastward shift of stroke burden (longitude by scanned status).
Discussion
Our study showed that a spatial distribution pattern exists for “true” stroke and non-stroke patients in the city of Memphis. Furthermore, we have shown that geospatial mapping can support positioning of resources for the ultra-early prehospital MSU diagnosis and management of acute stroke patients.
The initial selection of our MSU base was determined by three factors: dispatch call volume for “suspected stroke,” infrastructure availability (fire station with capability of housing an additional ambulance), and ready access to the north and south loops of our metropolitan highway system. High suspected stroke burden lies within a 5-min service area. However, use of geospatial dispatch mapping has allowed us to refine our understanding of areas where actual stroke cases are most likely to occur. A 10-min service area is required to reach high actual stroke burden from our current station. However, the “time is brain” paradigm suggests that use of similar mapping techniques should be considered by MSU programs for optimal positioning, especially since our MSU has shown an ability to administer intravenous rt-PA within a median 13 min of scene arrival during its first year of operation [6].
Our procedures resulted in successful geocoding of 393 cases from a total of 420 dispatch incidents. In our experience, reasons for failure to geocode include a post office box address that does not correspond to a bounded polygon on a map, as well as patient or bystander provision of an inaccurate or fictitious address. There is an irregular shape to the various drive time polygons on our maps because as the drive time parameter is liberalized along a linear road network, the polygon expands deeper into the countryside along paved roadways than it does over unpaved ground. This accounts for the irregular protrusions from the polygon as drive time is increased.
Seim and colleagues [10] investigated 911 utilization by census tract as a function of poverty in a single California county, concluding that neighborhood impoverished status is associated with high rates of 911 service utilization regardless of chief complaint and confounders such as race or age. Interestingly, our findings are similar, with dispatch incidents clustering in 911 “superuser” neighborhoods. In fact, in the short duration of our program, the MSU staff have already identified 3 patients in superuser neighborhoods for whom dispatches have been received two or more times for non-stroke presentations. Ongoing collaboration with our engagement team comprising stroke survivors, caregivers, and influential, articulate neighborhood leaders should enable determination of locally relevant place-bound characteristics which confer risk for “superuser mimic” status. Our team is concurrently working on a template to collect, clean, aggregate, and spatially join data in the public domain regarding place-bound socio-spatial risk determinants with the aim of better understanding this phenomenon.
Prior to MSU program expansion in the USA, a survey of hospitals participating in the Get With The Guidelines-Stroke Target: Stroke Phase II initiative revealed that alteplase was given to only 59.3% of eligible stroke presenters within 60 min and to only 30.4% within 45 min [11]. Mobile stroke units have shown an ability to treat patients rapidly, with median alarm-to-treatment times more than 20 to 30 min faster than standard hospital treatment [2, 3, 4]. While our MSU could be more optimally stationed to meet the needs of high-burden patients, we have established a number of strategies to ensure rapid scene arrival to IVtPA treatment times. First, prior to our MSU scene arrival, paramedic first responders are able to establish two intravenous lines, measure glucose, and obtain important patient history and physical exam information that allows us to complete our procedures in a streamlined manner. Second, when drive time is expected to exceed 10 min because of excessive distance or traffic, we have adopted use of an innovative MSU rendezvous strategy, whereby first responders load and transport the patient to a place of mutual agreement in our direction. Given that our Memphis Fire Department EMS have an 86% stroke diagnostic accuracy, we have found rendezvous to be an acceptable practice to ensure early diagnosis, treatment, and accurate triage to a stroke center with or without endovascular capabilities. Our findings have allowed us to begin evaluation of the need for a second unit that may be placed strategically to the east side of the city.
Our study has several limitations that should be acknowledged. First, interpretation of our findings is locally relevant, and although our program's individual findings may not be generalizable to other programs, our methods may assist them in understanding and improving their MSU and 911 workflow. Second, our methods do not account for an “urban time penalty” associated with such things as high-rise housing, including those without service elevators, scenes needing to be secured by police, and other phenomena that are inadequately studied and poorly understood. Our methods also fail to incorporate elements of “rural time penalty,” such as access limited by rugged terrain. Despite these limitations, to our knowledge this is the first report of application of geospatial visualization techniques to analyze MSU data. Our procedures and results should inform collaboration with our citywide 911 partners to evaluate dispatch protocols and the future location of additional pre-hospital and post-acute stroke resources.
Conclusion
Geospatial analyses of emergency system data may help optimally position prehospital stroke assets. Spatial analyses and GIS methodology are fruitful in evaluation of the MSU experience, as well as understanding place-bound factors associated with neighborhood 911 overuse.
Disclosure Statement
Andrei V. Alexandrov discloses a PCORI subaward for Benefits of Stroke Treatment Delivered Using a Mobile Stroke Unit Compared to Standard Management by Emergency Medical Services (BEST-MSU) and Asissi Foundation grant for Respond, Evaluate, Cure, Heal: Mobile Stroke Unit (REACH-MOST).
Appendix
Welch Two-Sample t Test
Data: X by scanned
t = −3.1487, df = 339.31, p value = 0.001785
Alternative hypothesis: true difference in means is not equal to 0
95% confidence interval:
−0.04609568 to −0.01064820
Sample estimates:
Mean in group 0: −89.99070
Mean in group 1: −89.96232
References
- 1.Powers WJ, Rabinstein AA, Ackerson T, Adeoye OM, Bambakidis NC, Becker K, Biller J, Brown M, Demaerschalk BM, Hoh B, Jauch EC, Kidwell CS, Leslie-Mazwi TM, Ovbiagele B, Scott PA, Sheth KN, Southerland AM, Summers DV, Tirschwell DL, on behalf of the American Heart Association Stroke Council 2018 Guidelines for the early management of patients with acute ischemic stroke: a guideline for healthcare professionals from the American Heart Association/American Stroke Association. Stroke. 2018;49:e1–e344. doi: 10.1161/STR.0000000000000158. [DOI] [PubMed] [Google Scholar]
- 2.Kunz A, Ebinger M, Geisler F, Rozanski M, Waldschmidt C, Weber JE, Wendt M, Winter B, Zieschang K, Fiebach JB, Villringer K, Erdur H, Scheitz JF, Tütüncü S, Bollweg K, Grittner U, Kaczmarek S, Endres M, Nolte C, Audebert HJ. Functional outcomes of pre-hospital thrombolysis in a mobile stroke treatment unit compared with conventional care: an observational registry study. Lancet Neurol. 2016;15:1035–1043. doi: 10.1016/S1474-4422(16)30129-6. [DOI] [PubMed] [Google Scholar]
- 3.Taqui A, Cerejo R, Itrat A, Briggs FBS, Reimer AP, Winners S, Organek N, Buletko AB, Sheikhi L, Cho S-M, Buttrick M, Donohue MM, Khawaja Z, Wisco D, Frontera JA, Russman AN, Hustey FM, Kralovic DM, Rasmussen P, Uchino K, Hussain MS, on behalf of the Cleveland Pre-Hospital Acute Stroke Treatment (PHAST) Group Reduction in time to treatment in prehospital telemedicine evaluation and thrombolysis. Neurology. 2017;88:1305–1312. doi: 10.1212/WNL.0000000000003786. [DOI] [PubMed] [Google Scholar]
- 4.Ebinger M, Winter B, Wendt M, Weber JE, Waldschmidt C, Rozanski M, Kunz A, Koch P, Kellner PA, Gierhake D, Villringer K, Fiebach JB, Grittner U, Hartmann A, Mackert B-M, Endres M, Audebert HJ, for the STEMO Consortium Effect of the use of ambulance-based thrombolysis on time to thrombolysis in acute ischemic stroke: a randomized clinical trial. JAMA. 2014;311:1622–1631. doi: 10.1001/jama.2014.2850. [DOI] [PubMed] [Google Scholar]
- 5. http://worldpopulationreview.com [internet]. Walnut, CA: World Population Review. Memphis Population. [cited February 19, 2018]; Available from: http://worldpopulationreview.com/us-cities/memphis-population/
- 6.Alexandrov AW, Bryndziar T, Rike J, Swatzell V, Dusenbury W, Koury D, Rogers K, McCormick S, Carlow J, Rhudy JP, Hossein Zadeh Maleki A, Krishnaia B, Nearing K, Malkoff MD, Metter EJ, Arthur AS, Alexandrov AV, for the REACH-MOST Investigators Ultra-fast performance and yield of a high-resolution CT with head/neck CT angiography on a mobile stroke unit (MSU) Neurology. Under review [Google Scholar]
- 7.Kurland KS, Gorr WL. 5th ed. Redlands: California: ESRI Press; 2014. GIS Tutorial for Health. [Google Scholar]
- 8. http://shelbycounty911.org [internet]. Shelby County, Tennessee: Shelby County 911 Open Data. Road Centerlines. 2017 [cited July 31, 2017]. Available from: http://gis.shelbycounty911.org/datasets/15544c721c9340c994200e6f52b0837e_0.
- 9.R Core Team, R A Language and Environment for Statistical Computing. R Foundation for Statistical Computing: Vienna, Austria. 2017 [Google Scholar]
- 10.Seim J, English J, Sporer K. Neighborhood poverty and 9-1-1 ambulance contacts. Prehospital Emergency Care. 2017;21:722–728. doi: 10.1080/10903127.2017.1325951. [DOI] [PubMed] [Google Scholar]
- 11.Xian Y, Xu H, Lytle B, Blevins J, Peterson ED, Hernandez AF, Smith EE, Saver JL, Jauch EC, Messé SR, Fonarow GC, Paulsen M, Suter RE, Reeves MJ, Schwamm LH. Use of strategies to improve door-to-needle times with tissue-type plasminogen activator in acute ischemic stroke in clinical practice: findings from Target: Stroke. Circ Cardiovasc Qual Outcomes. 2017;10:e003207. doi: 10.1161/CIRCOUTCOMES.116.003227. [DOI] [PubMed] [Google Scholar]


