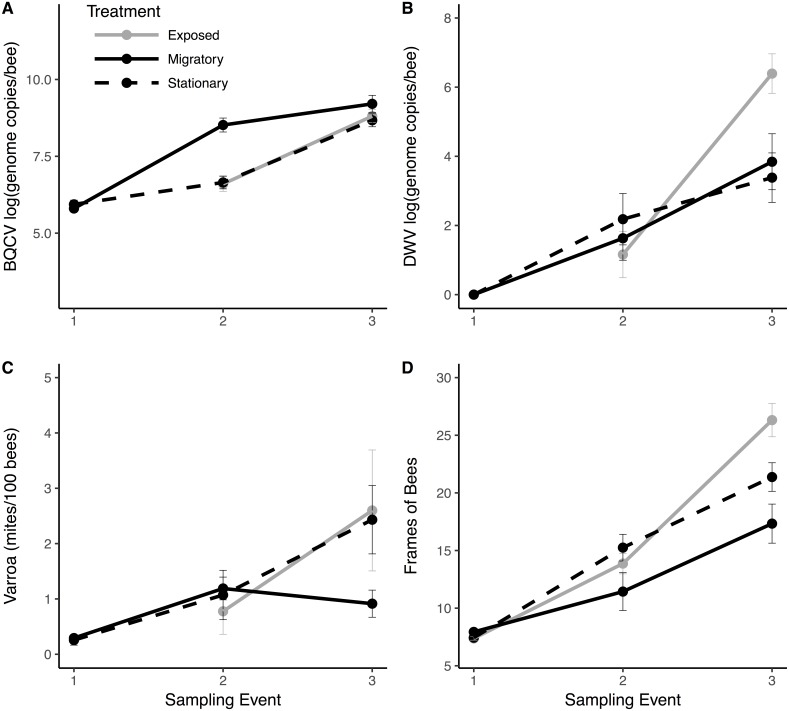
Figure 3. Pathogen and colony population metrics for treatment groups through time.
Migratory (solid line) and stationary/isolated (dotted line) colonies were sampled at three time points and exposed (gray) colonies were sampled at two time points. Sampling event (1) occurred before migratory colonies were transported, (2) upon their return, and (3) one month after return. Panels show results for three pathogens and one health metric: (A) black queen cell virus (BQCV) in log genome copies per bee (B) deformed wing virus (DWV) in log genome copies per bee (C) Varroa load in mites per 100 bees and (D) Frames of bees (FOB), as a proxy for colony population. In Experiment 1: migratory verses stationary/isolated colonies, there was a significant effect of time for all measures. For BQCV, there was a significant effect of treatment. There was a significant time × treatment interaction for FOB and Varroa. In Experiment 2: exposed colonies verses stationary/isolated, there was a significant effect of time for each measure. For DWV, there was a significant time × treatment interaction. Bars represent standard errors.

