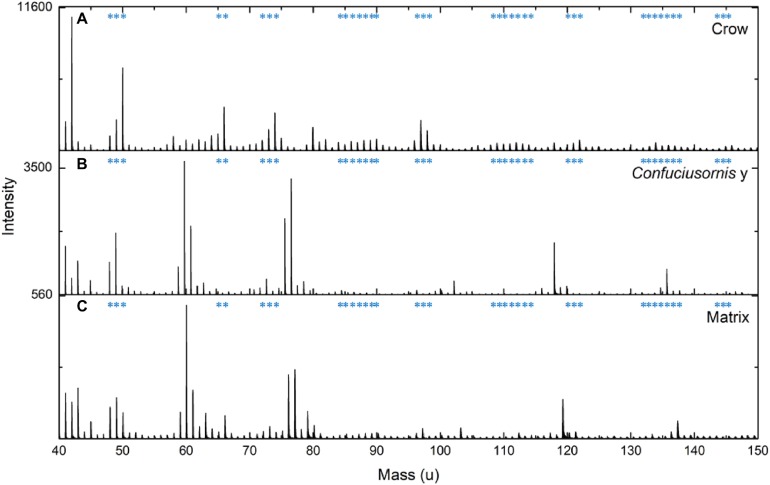
Figure 4. Comparison of ToF-SIMS spectra from extant and fossil melanin and a matrix control.
ToF-SIMS results for fossil sample CUGB P1401 sample Y (A) compared to spectra from extracted crow melanin (B) and a CUGB P1401 matrix (C) sample. Asterisks indicate theoretical peaks for eumelanin from Lindgren et al. (2015b).

