

Abstract

Fatty acid molecules 9,12,15-octadecatrienoic acid (C18:3), 9,12-octadecadienoic acid (C18:2), and hexadecanoic acid (C16:0) possessing active functional groups with the capability of fast electron transfer have been established for effective corrosion inhibition of mild steel. In this regard, a microalga Scenedesmus sp. is isolated and its fatty acids have been studied to corroborate the adsorption behavior, attributing the anticorrosion efficacy on mild steel in 1 M HCl solution by forming metal–inhibitor framework. Electrochemical analysis has been used to ascertain the surpassing corrosion inhibition efficiency at an optimal concentration of 36 ppm with maximum 95.1% inhibitive performance. The results of metallography with or without the inhibitor molecules have indicated significant changes in surface morphology of mild steel specimen for gradual enhancement in immersion time (72 h). Hydrogen evolution reaction has been emphasized to observe the tendency of significant decrease in the bubble formation in the presence of inhibitor compared to 1 M HCl solution only. Surface morphometric studies (scanning electron microscopy and atomic force microscopy) have also revealed the excellent adsorption capacity of Scenedesmus fatty acids on metal surface. Quantum chemical calculations, performed by density functional theory, determined significant adsorption effectiveness, based on the donor–acceptor capability between metallic surface and inhibitor molecules.
1. Introduction
The sustainable resistance of mild steel (MS) toward corrosion by employing green biomass extracts has spurred the scientific communities and technocrats to investigate a renewable, biodegradable, and economically feasible way.1−3 The organic moieties have potential to produce an adhesive layer on metallic surface owing to their increased rate of physisorption as well as chemisorption characteristics.4,5 The green inhibitors obtained from plant extracts were utilized to inhibit the metallic corrosion under acid environment.6−10 Therefore, the plant-based inhibitors were treated as possible replacements of synthetic products. Moreover, the work of M’hiri et al. (2016) emphasized the protective ability of carbon steel against corrosion in acidic medium by integrating orange peel extracts to form a thin film over the surface.11 At present, extracts of Brassica campestris were employed as an anodic inhibitor in chloridic solution, contributing 80–84% inhibition efficiency (IE) to COR-TEN steel.12
Recently, plant-based oil components, such as linseed oil, sunflower oil, and castor oil, have successfully contributed to optimize the inhibitive power on metallic surface by tuning the electrochemical behavior.13−15 It has been reported earlier that the lubricating property of oil may aid to create an adsorption to the metal surface, depending on the boundary regime phenomenon.16 Therefore, it could be envisaged that the long aliphatic chain polar organic molecules are being adsorbed on positively charged metallic surface by creating self-assembled films or barriers with augmented corrosion resistance. Moreover, the surface properties of oil such as surface tension, viscosity, and intermolecular interaction are found for favorable metal–inhibitor interaction.17,18
Nevertheless, despite the nonrenewable and nontoxic nature of plant-derived oils, a dilemma still persist in food with oils, which not only perturbs partially the ecological balance, but also faces a serious problem of commercialization. Moreover, another major problem associated with its origin is the season-dependent nature of the plants and their longer cultivation time. Therefore, it is conceivable to look for a sustainable and economical source of oil toward mild steel corrosion inhibition. As microalgae are abundant and a sustainable source of oil accumulation, microalgal oil has been introduced for the first time in our present study to elucidate the anticorrosion proficiency of mild steel in acidic medium.
Microalgae are eukaryotic, oleaginous, photosynthetic, and oxygenic microorganisms widespread in the environment and are capable of undegoing facile cultivation even in nonarable as well as fragile land.19 Harvesting solar radiation using photosynthetic pigments, rapid growth rate, and atmospheric CO2 fixation have demonstrated an incredible aspect for economic production of microalgal feedstock.20 Microalgae biomass has drawn an immense attraction for synthesizing numerous value-added co-products, namely, carbohydrates, proteins, and lipids, in a diverse manner.12 The algal extracts are usually rich in heteroatoms, carrying active molecules, which have proven their excellence in a wide range of acidic environment toward corrosion inhibition.21−23 The available lone pair (nonbonded) and p-electrons present in such organic inhibitor molecules promote the electron transfer toward metal surface, addressing the failure of corrosion.24 However, it is hardly explored, and detailed study is lacking to use algal extracts as possible corrosion inhibitor.
Generally, microalgal oil is composed of oleochemicals in the form of tryglycerides, free fatty acids with saturated or unsaturated double bonds, fatty acid methyl esters, fatty alcohols, and fatty amines.25 The chain-length distribution of algal oil plays a key role to ascribe particular oleochemical applications. Long aliphatic chains of fatty acids containing 8–12 carbons are essential for surfactant synthesis, 12–18 carbons are ideally contributed for biodiesel production, and 18–22 carbons are utilized as lubricants.26 Plausibly, the unsaturated bonds and the presence of active functional group in fatty acids (carboxylate anion) increase the surface chemistry toward interaction with metal-vacant orbitals and cations and play a pivotal role to enhance the adsorption characteristics.27 Hence, microalgal oil, referred to as green inhibitor, is expected to maximize the corrosion inhibition efficiency by creating self-aggregated adsorptive barrier on mild steel surface under acidic medium.
Keeping the motivation of green approach, we have come up first to observe the anticorrosion behavior of mild steel with the isolation of novel and bountiful fatty acid-rich chlorophycean microalgae strain Scenedesmus sp. The entire characterization of Scenedesmus fatty acid (SFA) extract was revealed by gas chromatography–mass spectrometry (GC–MS) analysis. The adsorptive barrier formation behavior was investigated by scanning electron microscopy (SEM) and electrochemical impedance spectroscopy (EIS) measurements. The in-depth understanding of microalgal fatty acid-based adsorption characteristics toward enhanced inhibitive effectiveness of mild steel in acidic environment is anticipated to build up a new window of inhibition study by considering the ample possibility for large-scale utilization.
2. Experimental Section
2.1. Microalgae Isolation and Preparation of Fatty Acid Extract
2.1.1. Microalgae Cultivation
A green microalga Scenedesmus sp. belonging to chlorophyta was screened from a natural fresh water body, New Delhi. The axenic property of the culture was established through repetitive microscopic evaluation under confocal microscope (Nikon A1). On the basis of its fast growth in the photoautotrophic culture condition, this strain was selected as a model microalga for further study. The strain was identified on molecular basis by 18S ribosomal DNA sequencing.28 The alga was grown photoautotrophically in autoclaved Fogg’s medium,29 and the cultures were provided with a light intensity of 100 μmol m–2 s–1 and 18:6 h light/dark period. The culture was maintained at 28 ± 1 °C with intermittent shaking at 100 rpm using an orbital incubator shaker (REMI, CIS-24BL), and the pH was adjusted to 7–7.2 using 0.1 N HCl or NaOH.
2.1.2. Neutral Lipid Estimation
The neutral lipid globules (fatty acids) present in microalgae were visualized by Nile red (9-diethylamino-5-benzo[α]phenoxazinone) staining.30 After staining, the cells were observed under fluorescence microscope (Nikon A1) via UV light with emission and excitation wavelengths of 485 and 525 nm, respectively.
2.1.3. Extraction of Fatty Acids from Scenedesmus sp.
The fatty acid components present in Scenedesmus sp. were extracted with the mixture of chloroform and methanol (2:1 v/v), as reported in Rai et al. (2013) with little modification.31 The microalgal culture was centrifuged (EPPENDORF 1810R) at 8000 rpm for 15 min to concentrate the cell pellets and then dried in a hot air oven (International Scientific Instruments Co.) at 60 °C. The completely dried algal biomass (2 g) was then mixed with 20 mL of chloroform and 10 mL of methanol. The mixture was ultrasonicated for 10 min and kept overnight at room temperature (RT) in an orbital shaker at 130 rpm. The mixture was centrifuged at 5000 rpm for 15 min to collect the supernatant, and the same volumetric fraction of chloroform–methanol combination was again added to the pellet, followed by recentrifugation. The supernatants were pooled together and 20 mL of chloroform was added to the mixture and then shaken properly. Distilled water (20 mL) was added for phase separation, and the lower organic phase was recovered and dried in a rotary evaporator (BUCHI R210). This lower organic phase carrying fatty acids was utilized as inhibitor (SFA) for consecutive experimental studies.
2.1.4. SFA Characterization
The characterization of SFA was analyzed by gas chromatography–mass spectrometry (Shimadzu QP-2010 Plus with Thermal Desorption System TD 20) by implementing Supelco as standard.
2.2. Metal Specimen Preparation and Its Composition
Metal strips having a 5 × 1 cm2 area were cut from mild steel (MS) sheet first and then grazed by an emery paper of grade 1/0 to 6/0 consecutively to obtain a smooth surface. Then, the MS specimens were dipped in AR-grade acetone and distilled water. The composition of the MS specimen used was C: 0.15%; Mn: 0.030%; Si: 0.18%; S: 0.024%; P: 0.03%, and the rest Fe.5
2.3. Weight Loss Method
The MS specimens were immersed in a 1 M HCl solution for 3 h at room temperature for weight loss measurement in the presence and absence of different SFA concentrations. The MS strips were weighed in a systematic manner using a Mettler Toledo electronic balance (least count ±0.01 mg). To determine the weight loss of the test specimens, these were eradicated from weight loss chamber, followed by appropriate washing and drying, and then, the MS strips were measured. The process was executed repeatedly in a successive way at various temperatures (303–333 K).
The inhibition efficiency (μwl %) and surface coverage (θ) values were measured using the following formulae5
| 1 |
| 2 |
where W0 and Wi are the weight loss value in the absence and presence of inhibitor, respectively.
The corrosion rate of the MS specimens was evaluated by using the weight loss data in the following relationship4
| 3 |
In the above expression, W is the weight loss of samples in milligrams, A represents the effective area in cm2, t signifies the exposure time in hours, and d indicates density of MS. In our recent report, the MS density was kept at ∼7.85 g cm–3.
2.4. Electrochemical Impedance Studies (EISs)
A three-electrode setup was chosen for the electrochemical analysis using an electrochemical workstation (CH7041C). A reference electrode of Ag/AgCl with a counter electrode using platinum foil and a working electrode as MS specimens (1 cm2) were employed for EIS measurement. The specimens were dipped in an electrochemical cell containing 1 M HCl at various SFA concentrations. Tafel polarization tests were conducted at a 5 mV s–1 scan rate by altering the overpotential voltage in the region of ±250 mV with respect to open-circuit potential (OCP). The Tafel polarization curves were allowed to fit using CHI7041C software. Further, the corrosion inhibition efficiencies (μP and μPR) were calculated from Icorr and RP, respectively, using eqs 4 and 5. On the other hand, Rct (charge-transfer resistance) and other impedance parameters from Nyquist plot were obtained using Zsim 3.22 software with fitting of suitable electrochemical circuit, and accordingly, μRct was calculated from eq 6, as below3,32
| 4 |
| 5 |
| 6 |
In the above equations, Icorr0 and Icorr signify corrosion current densities in the absence and presence of SFA in 1 M HCl solution, respectively. Similarly, the polarization resistance (PR0) and charge-transfer resistance (Rt0) were used for without SFA in acid solution, while PRi and Rt were indicated for the resistances with SFA.
2.5. Surface Analyses
Surface images of freshly smoothened MS specimen, treated with acid solution (3 h) and inhibited with SFA, were taken by a scanning electron microscope (Carl Zeiss microscope, SUPRA 40 model, Germany). Atomic force microscopy (AFM) analysis of the MS specimens was conducted using an NT-MDT multimode microscope (made in Russia) under semicontact mode. Acid-immersed MS specimens were properly washed and dried in a vacuum oven at 30 °C for 5 min prior to surface examination.
The effect of metallographic characterization with or without SFA was examined at different time intervals using a Dewinter Fluorescence Microscope, model no. DIGI 1000.
2.6. Quantum Chemical Calculation Analysis by Density Functional Theory (DFT)
Theoretical analysis of the inhibitor molecules was carried out by density functional theory and optimized with B3LYP functional using Basis Set 6-31G. The electron affinity (A) and ionization potential (I) were denoted as −ELUMO and −EHOMO, respectively. The other electronic parameters like absolute hardness (η), softness (σ), fraction of electron transfer (ΔN), and absolute electronegativity (χ) were estimated by the following expressions5
| 7 |
| 8 |
| 9 |
| 10 |
3. Results and Discussion
3.1. Morphological Characterization of Scenedesmus sp.
The selected monoclonal microalgal strain was successfully isolated and genetically identified by 18S ribosomal marker. The microalga was identified as Scenedesmus sp., belonging to class chloropheceae, order sphaeropleales, and family scenedesmacea. The morphometric examination by confocal microscopy demonstrated the consistent morphology of genera Scenedesmus (Figure 1a). According to the light/confocal microscopic determination, each Scenedesmus cell was observed as green with ellipsoidal shape having diameter in the range of 2–3 μm. The cells were heavily granulated and mostly present in single- and double-celled forms.
Figure 1.

(a) Light microscopic bright-field image of Scenedesmus sp. (scale bar, 10 μm). (b) Fluorescence microscopy image using Nile red staining (scale bar, 50 μm). (c) Auto fluorescence image showing chlorophyll (scale bar, 50 μm). (d) Merged image showing chlorophyll as well as neutral lipid globules (scale bar, 50 μm).
The structural topography illustrated the coenobia formation with the presence of tetrads and occasionally octet forms of organization. The beaded forms of this particular strain possess some spiny projections, contributing their fast movement. The Nile red fluorescence microscopy revealed the lipid profile of Scenedesmus sp., as shown in Figure 1b. It was clearly depicted that the isolate had a significant amount of intracellular neutral lipid droplets. The cells of Scenedesmus sp. emitted intense red fluorescent illumination, elucidating the existence of neutral lipids carrying fatty acids.
3.2. SFA Analysis by GC–MS
To explore the application of microalgal fatty acid components, as corrosion inhibitors, the SFA was analyzed by GC–MS. According to the GC–MS profile, the presence of fatty acids along with alcohols was represented by a chromatogram (Figure 2), and the results were summarized in Table S1. It was clearly revealed from the characterization that the major fatty acids, viz., hexadecanoic acid, 9,12-octadecadieonic acid, and 9,12,15-octadecatrionic acid, existed at 32.05, 10.36, and 27.02% respectively, followed by 8.21% alcohols. Among the fatty acid constituents, total saturated fatty acid and unsaturated fatty acid were found to be nearly 35.06 and 48.35%, respectively. Therefore, we strongly believe that a higher amount of fatty acids could be utilized promisingly for the anticorrosion efficacy of mild steel under aggressive acid medium.
Figure 2.

Chromatogram of fatty acids and other components present in Scenedesmus sp.
3.3. Corrosion Testing
3.3.1. Gravimetric Analysis
Figure 3 exemplified the inhibition efficacy (IE) as well as corrosion rate of mild steel surface with different concentrations of SFA as 9, 18, 27, 36, and 45 ppm in acidic medium for 3 h. The result revealed that the inhibition efficiency enhanced gradually with increase in inhibitor’s concentration up to 36 ppm, while there was no significant escalation after adding more SFA. On the other hand, corrosion rate decreased with increase in inhibitor’s concentrations in a reverse manner of inhibition efficiency. This phenomenon could be attributed to the adsorption capacity of organic moieties present in SFA, based on surface coverage values. Therefore, the active sites of mild steel were blocked considerably by adsorbed inhibitor molecules, and hence, the inhibition efficacy enhanced gradually up to a saturation level of SFA concentrations (36 ppm).
Figure 3.

Corrosion rate and inhibition efficiencies of various concentrations of SFA in 1 M HCl at RT.
3.3.2. Impact of Temperature and Activation Parameters on Corrosion Inhibition
A comparative analysis of inhibition efficiency (IE) on MS under acidic medium was investigated in the presence of various SFA concentrations at different temperatures (303–343 K) (Figure S1); however, concentration up to 36 ppm and temperature of 303–333 K were selected only for further studies. The influence of such temperature ranges on corrosive molecules present in MS was generally studied using Arrhenius equation, adapting the values of weight loss studies.33,34
| 11 |
In eq 11, Cr denotes the corrosion rate of MS in 1 M HCl, Ea designates the activation energy at absolute temperature T (kelvin), R epitomizes the universal gas constant (8.31 J K–1 mol–1), and A is the pre-exponential Arrhenius factor for the corrosion process. On the basis of gravimetric measurements, the apparent activation energy (Ea) with pre-exponential factors with or without inhibitor concentrations was computed by a linear regression between ln Cr and 1/T (Figure 4), and the obtained results are presented in Table 1. According to Figure 4, an evident improvement of IE was observed with an increase of inhibitor concentrations, whereas the IE declined with a gradual increase in temperature from 303 to 333 K. In the same fashion, it is apparent from Table 1 that the computed Ea values were boosted up with the enhancement of SFA concentration in the presence of acid solution. These changes of Ea could be possible due to the circumstance that the energy barrier of corrosive MS could be upstretched on addition of SFA to the acid media, promoting the IE. Hence, the higher value of Ea in inhibited system in contrast to uninhibited system (blank) specified that SFA were initially adsorbed on MS electrode, governed by physisorption, a surface phenomenon. Thus, the observed results clearly depicted the protective efficiency of MS in the presence of SFA.
Figure 4.

Arrhenius curve for MS in the presence and absence of SFA in acid solutions.
Table 1. Activation and Thermodynamic Parameters in the Presence and Absence of SFA at Varying Concentrations.
| SFA concentrations (ppm) | Ea (kJ mol–1) | A (mmpy) | ΔH* (kJ mol–1) | ΔS* (J mol–1 K–1) | Ea – ΔH* (kJ mol–1) |
|---|---|---|---|---|---|
| blank | 22.04 | 42.9 × 10⁴ | 19.238 | –146.247 | 2.80 |
| 18 | 36.48 | 75.48 × 10⁶ | 33.671 | –103.55 | 2.80 |
| 27 | 48.26 | 48.58 × 10⁸ | 45.32 | –69.34 | 2.94 |
| 36 | 80.75 | 6.87 × 10¹⁴ | 77.86 | 27.92 | 2.89 |
Thermodynamic characteristics, ΔH* and ΔS*, were attained by the plot between Cr/T and T according to the transition-state equation expressed below33
| 12 |
where N and h signify Avogadro’s number and Planck’s
constant, respectively, and Cr, R, and T as explained in eq 11. Figure 5 illustrates a plot of  , where
straight lines were found and the slopes along with intercepts were
calculated. All of the calculated values are presented in Table 2. From this table,
it was evinced that the values of thermodynamic parameters like ΔS* and ΔH* flourished considerably
in inhibited system with a significant enhancement of SFA concentrations,
compared to uninhibited system. This phenomenon focused an upsurge
in the ordering of electrochemical system with the deployment of inhibitor,
which depicted that the reactants of the corrosion reactions were
altered into the metal–inhibitor association to create an adsorption
over the MS electrode.32 Therefore, we
emphasized that the inhibitor molecules, present in SFA, fostered
the minimum energy prerequisite for the corrosion reaction, attributing
to the resistive property of MS in acid media.
, where
straight lines were found and the slopes along with intercepts were
calculated. All of the calculated values are presented in Table 2. From this table,
it was evinced that the values of thermodynamic parameters like ΔS* and ΔH* flourished considerably
in inhibited system with a significant enhancement of SFA concentrations,
compared to uninhibited system. This phenomenon focused an upsurge
in the ordering of electrochemical system with the deployment of inhibitor,
which depicted that the reactants of the corrosion reactions were
altered into the metal–inhibitor association to create an adsorption
over the MS electrode.32 Therefore, we
emphasized that the inhibitor molecules, present in SFA, fostered
the minimum energy prerequisite for the corrosion reaction, attributing
to the resistive property of MS in acid media.
Figure 5.

Transition plot for mild steel in 1 M HCl with or without SFA concentrations.
Table 2. Calculation of Free Activation Energy (ΔG*) and Free Energy of Adsorption (ΔG0).
| ΔG* (kJ mol–1) |
ΔG0 (kJ mol–1) |
||||||
|---|---|---|---|---|---|---|---|
| acid | concentration of inhibitor (ppm) | 303 K | 313 K | 323 K | 333 K | T (K) | value |
| 1 M HCl | 0 | 62.86 | 64.30 | 65.74 | 67.18 | 303 | –8.2 |
| 18 | 65.04 | 65.91 | 66.94 | 67.97 | 313 | –7.79 | |
| 27 | 66.33 | 66.22 | 67.61 | 68.29 | 323 | –6.43 | |
| 36 | 69.41 | 69.68 | 69.14 | 68.86 | 333 | –6.08 | |
Free activation energy, entailed as ΔG*, was estimated by the following equation33
| 13 |
Positive values of free activation energy (ΔG*) at transition state were obtained, and the values were augmented with increase in temperature for blank and inhibited systems (Table 2). This fact clearly indicated that the tendency of active complex formation was repressed partially owing to losing their efficient stability with upsurge in temperature. In the same table, it was observed that the values of ΔG* escalated with the increase in SFA concentration at a certain temperature. Additionally, the standard free energy of adsorption, designated as ΔG° for SFA in 1 M HCl, was demonstrated from Kads values at different experimental temperatures, followed by the equation5
| 14 |
where Csolvent expresses the concentration of water in solution (1 × 10⁶ mg L–1). The Kads values were assimilated by the weight loss data curve given at various temperatures (303–333 K) and are given in Figure S2. The Kads values mainly decreased with increasing temperature, which specified either lowering the adsorption rate or increasing the desorption rate of SFA from the metallic surface. According to the table, all of the ΔG0 values followed the trend of <−20 kJ mol–1 at different temperatures with or without SFA concentrations. A previous report suggested that the values of ΔG0 remained up to −20 kJ mol–1, which acknowledged the electrostatic interaction between charged molecules and a charged metal surface attributing to the physical adsorption.5,34,35
Therefore, our experimental analysis proved that all values of ΔG° were consistent with <−20 kJ mol–1, and hence, we strongly recommended that a physical adsorption was facilitated in our study.
3.4. Electrochemical Studies
3.4.1. Open-Circuit Potential (OCP) Curves
Variation of OCP of mild steel in HCl in the absence and presence of inhibitor at room temperature was recorded before conducting any electrochemical studies. It could be observed from the OCP curves (Figure S3) that the allowed time of 30 min was sufficient for further studies. However, OCP values shifted toward the negative side with addition of optimum concentration of inhibitor. This fact suggested that inhibitor was more active for cathodic reactions.
3.4.2. Potentiodynamic Polarization Study by Tafel Plot
Potentiodynamic polarization measurement studies provide an avenue to monitor the mechanistic phenomenon of electrochemical behavior utilizing different inhibitor concentrations on MS. According to Figure 6, the incorporation of inhibitors manifested the corrosion reaction by observing the change in both cathodic and anodic polarization curves. A thorough analysis of Ecorr values advocated that the employment of SFA induced a shifting of corrosion potential in MS toward more negative potential compared to Ecorr of uninhibited system, indicating the inhibition on MS surface.
Figure 6.

Tafel polarization curve for MS with various concentrations of SFA.
The present study illustrates a maximum shift of around 63 mV for Ecorr in the presence of inhibitor with respect to blank acid solution, which is less than the value of 85 mV, demonstrating the inhibitor as a mixed-type inhibitor.36,37 Further, Figure 6 also depicts that SFA reduced the dissolution reaction of MS surface at anodic site as well as retarded the hydrogen evolution reaction (HER) at cathode. Moreover, the change in ba and bc values with the inhibitor concentrations directed the inhibitive action of SFA by simply obstructing the reactive sites of MS surface. The various parameters related to the kinetics of MS corrosion, viz., Ecorr, Icorr, RP, ba, and bc (slopes of anodic and cathodic polarization curves), were obtained by the fitting of Tafel polarization curves with CHI 7041 C software, as listed in Table 3. Further, corrosion inhibition efficiencies μP and μPR were calculated from the values of Icorr and RP. A close analysis of Table 3 revealed that the cathodic polarization slope was higher than the anodic polarization slope at all inhibitor concentrations, suggesting that inhibitor was more effective for retarding cathodic reactions (HER) than anodic reactions on MS. An investigation of corrosion current values shown in Table 3 accounted for decrease in the corrosion rate on the electrode surface as the value of Icorr continuously decreases with increasing inhibitor concentration. The same behavior was also manifested in the RP values (Table 3) because SFA molecules were adsorbed on the active sites of MS surface and produced an inhibitive layer, which results in its improved polarization resistance against the corrosion process in the presence of inhibitor. Consequently, it opposed the increment in Icorr value. Such decrease in Icorr with increase in the extract concentration acknowledged higher corrosion inhibition. In addition, inhibition efficiencies, μP and μPR, were calculated from the values of Icorr and RP using eqs 4 and 5, which were found adjacent to each other and followed the same pattern. Therefore, this fact could be acknowledged that the elucidation of MS corrosion behavior based on Icorr and PR values accounted valid and reliable. Reproducibility of the experimental data was also checked and is shown in Figure 7a,b. The average values obtained for various parameters shown in Figure 7 are displayed in Table 3.
Table 3. Tafel Polarization Parameters Obtained at Different SFA Concentrations.
| conc. (ppm) | –Ecorr (mV, Ag/AgCl) | Icorr (μA cm–2) | ba (mV dec–1) | –bc (mV dec–1) | μP (%) | RP (Ω cm2) | μPR (%) |
|---|---|---|---|---|---|---|---|
| blank | 440 | 1546 | 119 | 172 | 19.81 | ||
| 9 | 468 | 242.6 | 100 | 167 | 84.3 | 112.7 | 82.4 |
| 18 | 479 | 87.8 | 84 | 140 | 94.3 | 260.4 | 92.3 |
| 27 | 480 | 71.5 | 87 | 139 | 95.3 | 326.3 | 93.9 |
| 36 | 503 | 64.5 | 106 | 141 | 95.9 | 408.9 | 95.1 |
Figure 7.

Variation of Icorr (a) and RP (b) with various concentrations of SFA as per Tafel polarization data.
Further, to determine the fact for increased RP values with inhibitor concentrations in 1 M HCl solution, Langmuir, Temkin, and Frumkin models were tested among various other isotherm models (Figures 8 and S3 and Table S2), where the Langmuir isotherm model was validated strongly to give the best fit among the above-mentioned isotherms. According to this model, our result demonstrated the value of R2, i.e., regression coefficient, nearly 1 and the slope of the fitting line based on Tafel polarization data, 1, as depicted in the figure.
Figure 8.

Langmuir adsorption isotherm fitting line for MS with various concentrations of SFA as per Tafel polarization data.
3.4.3. Electrochemical Impedance Spectroscopy
Electrochemical impedance spectra are represented as Nyquist plot (Figure 9) and Bode plot (Figure 10), based on the presence or absence of the involvement of different SFA concentrations. Reproducibility of experimental data was also checked and is exhibited in Figure 11a,b. Average values for all parameters related to Nyquist plot are presented in Table 4. From the Nyquist plot, it was apparent that the polarization resistance increased gradually with the increment of SFA concentrations, representing the strong establishment of adsorptive layer formation, which was also supported by other results.34,36
Figure 9.

Nyquist plot for MS at different concentrations of SFA in 1 M HCl at RT.
Figure 10.

Bode plot for MS at different SFA concentrations in 1 M HCl at RT.
Figure 11.

Variation of Rct (a) and Ceff (b) with different concentrations of SFA as per impedance data.
Table 4. Comparison of Impedance Parameters for MS in 1 M HCl in the Presence and Absence of Different SFA Concentrations at RT.
| CPE parameters |
|||||||
|---|---|---|---|---|---|---|---|
| conc. of SFA (ppm) | Rs (Ω cm2) | Rct (Ω cm2) | n | Y0 (μS sn cm–2) | Ceff (μF cm–2) | μRct (%) | χ2 × 10⁻⁴ |
| blank | 2.58 (0.89%) | 54.8 (0.37%) | 0.827 (0.033%) | 128.7 (2.09%) | 67.11 | 3.20 | |
| 9 | 4.18 (0.78%) | 345.5 (0.45%) | 0.816 (0.23%) | 107.4 (1.31%) | 51.03 | 84.1 | 3.29 |
| 18 | 2.13 (1.55%) | 372.9 (0.62%) | 0.821 (0.29%) | 96.04 (1.76%) | 46.63 | 85.3 | 6.98 |
| 27 | 2.15 (1.67%) | 406.0 (0.69%) | 0.817 (0.31%) | 91.6 (1.86%) | 43.48 | 86.5 | 8.32 |
| 36 | 2.30 (1.90%) | 461.2 (0.78%) | 0.831 (0.35%) | 82.72 (2.14%) | 42.18 | 88.2 | 1.09 |
To explore the technical characterization of the Nyquist plot, an equivalent open electrochemical circuit was utilized, as indicated in the inset of Figure 9, where Rs is the solution resistance, CPE is the constant phase element, and Rct is the charge-transfer resistance across the MS–HCl interface. CPE is used for modifying the capacitive behavior of the electrode and can be defined with Y0 and n, which are, respectively, the modulus of CPE and a parameter that characterizes the deviation of the electrode’s capacitive behavior from perfect capacitive behavior. All of the impedance parameters like Rs, Rct, Y0, and n were determined from the fitting of Nyquist plots with proposed electrochemical circuit using Zsim 3.22d software with relative model error and are listed in Table 4 (one of the fittings for 9 ppm concentration of SFA is presented in Figure S5). From CPE parameters,36,38 the effective capacitance was calculated by the formula Ceff = (Y0Rct1–n)1/n.
A careful examination of Table 4 also promoted that Rct values were continuously augmenting with enhancing the SFA concentration in acid medium. This is because of the formation of an adhesive protective layer at the metal–acid interface in the presence of inhibitor. This protective layer over the metal surface blocked the corroding substances from reaching the metal surface. Furthermore, it was observed that Ceff of the system decreased with increasing concentration of SFA.
This could be attributed to either decrease in effective
exposure area or increase in the thickness of the protective layer,
which was also in good agreement with the Helmholtz equation, i.e., 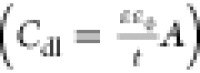 ,(17) where A is the available exposed area for corrosion and t is the thickness of the protective layer formed over the mild steel
surface. Bode plot (Figure 10) shows the variation of impedance modulus and phase angle
with frequency for metal–acid interface with SFA concentrations.
It was revealed from the figure that impedance modulus and the value
of phase angle augmented with each successive addition of SFA, which
supported strongly the retardation of corrosion rate.32
,(17) where A is the available exposed area for corrosion and t is the thickness of the protective layer formed over the mild steel
surface. Bode plot (Figure 10) shows the variation of impedance modulus and phase angle
with frequency for metal–acid interface with SFA concentrations.
It was revealed from the figure that impedance modulus and the value
of phase angle augmented with each successive addition of SFA, which
supported strongly the retardation of corrosion rate.32
In addition, to study the adsorption characteristics as well as the degree of adsorption, Figure 12 displays the fitting of the Langmuir adsorption isotherm model for the experimental data obtained by Nyquist plot for different inhibitor concentrations in 1 M HCl solution and supported strongly the mechanism of adsorption behavior. However, the Frumkin and Temkin isotherms were also plotted for the same results, and are shown in Figure S4 and Table S2.
Figure 12.

Langmuir adsorption isotherm fitting line for MS with various concentrations of SFA as per impedance data.
3.5. Surface Topographical Analysis
3.5.1. SEM
The formation of surface-resistive layer by green inhibitors on the MS surface was confirmed by SEM topography. Figure 13 displays an array of SEM images obtained for MS that was immersed in 1 M HCl without and with the optimum concentration of SFA (36 ppm).
Figure 13.

SEM image of MS surface (a) polished, (b) in the presence of 1 M HCl, and (c) exposed to 36 ppm SFA in 1 M HCl. (d) The rectangular highlighted portion of (c) demonstrates the SFA adsorbed on MS surface; these were seen as the circled regions having a scale bar of 2 μm.
According to the figure, the MS surface was visualized as nonuniform, flat, and scratched owing to its excessive roughness along with asymmetrical polishing. On the other hand, the MS exterior was dented rigorously with visible pits, which are accredited due to acid attack of metal. However, the presence of green inhibitors successfully suppressed the rate of corrosion due to the creation of adsorbed layer on metal surface, attributing a smooth and uniform surface. Thus, the SEM orientation of MS surface supported the electrochemical methods, which could bring about the inhibition efficacy by adsorption mechanism.
3.5.2. Effect of Immersion Time on Corrosion and Anticorrosion of Metal Surface by Microstructural Analysis
The influence of immersion time on the corrosive as well as inhibitive performances of MS is demonstrated in Figures S6 and S7. According to Figure S6, the metallic surface was demonstrated as an irregular pattern, representing severe deterioration in the presence of acidic environment by enhancing the time span sequentially (0–72 h). However, Figure S7 indicates a completely diverged pictographic representation, where the irregularity of metallic surface declined according to the optimal concentration of the inhibitor (36 ppm). Hence, we strongly assume that SFA could be utilized as an impending inhibitor to retard the corrosion of MS.
3.5.3. Visual Photography Study
Our current investigation implemented a video [Video S1 (A) video blank (A0008) and (B) video inhibitor (A0017)] about the similar observation of such metallographic analysis (Figures S5f and S6f) in the presence or absence of inhibitor (36 ppm) at 24 h. It was clearly evinced from the video that the amount of hydrogen gas evolution (HER) in the form of bubble formation (cathodic reaction) was significantly higher in 1 M HCl solution only in the presence of optimal inhibitor concentration.
3.5.4. AFM
The AFM images described the surface morphology of MS after immersion in 1 M HCl solution, without and with SFA. A thorough examination of polished MS surface was determined as an almost even surface (Figure 14a), while, in the case of uninhibited system (Figure 14b), the metallic surface displayed an extremely uneven topology due to an unhindered corrosion attack, and the average roughness (Sa) increased from 39.09 to 138.51 nm. The presence of SFA (Figure 14c) in the acidic medium determines a pronounced reduction of surface roughness, and hence, the Sa value decreased at 45.09 nm, leading to a homogeneous surface morphology. Therefore, it was elucidated from the overall pictorial and quantitative observation that this noteworthy enhancement of the inhibited mild steel specimens in the presence of SFA could be able to isolate the metal from electrolyte and prevent from corrosion.
Figure 14.

AFM image of MS surface (a) polished, (b) in 1 M HCl, and (c) in 1 M HCl + 36 ppm SFA.
Other parameters related to surface roughness were obtained from software and are shown in Table S3.
3.6. Mechanistic Perception and Quantum Chemical Calculation Studies
It is a well-recognized fact that fatty acids are represented extensively as friction modifiers having inherent lubricating properties.39 Microalgae-derived oil comprised fatty acids, and its derivatives are primarily considered as triacylglycerol. In our present report, the GC–MS analysis of SFA (Figure 2 and Table S1) demonstrated the characteristic features of saturated and unsaturated fatty acids, having terminal CH3, hydroxyls, carboxyls, and esters with allylic carbon atoms in their backbone. Moreover, it was clearly visualized in Figure 2 that a cumulative amount of unsaturated fatty acids existed in a greater extent compared to saturated fatty acids. Generally, the double-bonded and more than double-bonded compounds have one and more than one sigma and pi bonds, respectively. Hence, it is quite efficient for double-bonded or more than double-bonded compounds to break their pi bond with less energy requirement. Thereby, plausibly, they could be able to form another complex causing an enhanced inhibition potential. Furthermore, the unsaturated compounds have more electron clouds owing to ease of bond-breaking capability, in contrast to saturated compounds. Hence, from this aspect, it was coherently considered that C18:2 and C18:3 (unsaturated fatty acids) have increased inhibition properties rather C16:0 (saturated fatty acids).
Quantum chemical calculations using DFT were carried out to elucidate the electronic structure along with the reactivity of inhibitors, expressed at the molecular level.40 The optimized structures of investigated inhibitor molecules (9,12-octadecadienoic acid, 9,12,15-octadecatrienoic acid, and hexadecanoic acid) are depicted in Figure 15. In view of acid corrosion, the neutral (protonated) state of the fatty acid molecule is taken for studies as the fatty acids will exist in protonated form in majority at low pH in comparison to its deprotonated form.41,42 According to the geometric optimization, hexadecanoic acid (Figure 15a) is relatively linear, whereas 9,12-octadecadienoic acid and 9,12,15-octadecatrienoic acid demonstrated one or more bends in its optimized structure, as shown in Figure 15d,g respectively. In addition, the highest occupied molecular orbital (HOMO)–lowest unoccupied molecular orbital (LUMO) plots for all investigated inhibitors were studied for calculating different electronic parameters.
Figure 15.

Structures of (a, d, g) optimized, (b, e, h) HOMO, and (c, f, i) LUMO orbitals calculated for 9,12-octadecadienoic acid, 9,12,15-octadecatrienoic acid, and hexadecanoic acid molecules, respectively, using DFT methodology, where the gray, white, and red balls show C, H, and O atoms respectively.
The values of EHOMO and ELUMO, dipole moment (μ), electronegativity (χ), global hardness (η), softness (σ), and ΔN are summarized in Table 5. However, the DFT-derived ϕ values for Fe(100), Fe(110), and Fe(111) surfaces were taken from the literature as 3.91, 4.82, and 3.88 eV, respectively,43 and in the present investigation, Fe(110) surface was only considered due to its packed arrangement and higher stabilization energy. Further, all of the molecular orbital (MO) pictures were created by population analysis with 0.02 isovalue via Gauss View, by Gaussian 09 program5,34 with B3LYP functional using Basis Set 6-31G.
Table 5. Quantum Chemical Parameters Evaluated for SFA.
| electronic parameters | hexadecanoic acid | 9,12-octadecadienoic acid | 9,12,15-octadecatrienoic acid |
|---|---|---|---|
| EHOMO | –7.5836 eV | –6.3826 eV | –6.3793 eV |
| ELUMO | –0.3633 eV | –0.3722 eV | –0.3727 eV |
| ΔELUMO–HOMO | 7.2203 eV | 6.0104 eV | 6.0066 eV |
| μ | 2.3508 | 5.7104 | 6.0384 |
| H | 3.610 | 3.005 | 3.003 |
| X | 3.973 | 3.377 | 3.376 |
| ΔN | 0.1173 | 0.2400 | 0.2404 |
According to the quantum chemical theory, the higher EHOMO values of −6.3826 and −6.3793 eV, achieved by 9,12-octadecadienoic acid and 9,12,15-octadecatrienoic acid, respectively, designated the disposition of these organic molecules to donate electrons to an appropriate acceptor having vacant molecular orbitals. Hence, we could promisingly envisage that the SFA molecules have a pronounced tendency to donate electrons.
Similarly, lower values of band gap, ΔE (ΔE = ELUMO – EHOMO), will be able to determine good inhibition efficiencies as the energy to remove electron from the last occupied orbital has been reduced. Therefore, ΔE, obtained as 6.0104 and 6.0066 eV, for 9,12-octadecadienoic acid and 9,12,15-octadecatrienoic acid, respectively, reflected lower than the value observed by hexadecanoic acid (7.2203 eV), as shown in Figures 16 and S8, addressing more adsorption ability. Moreover, our current report followed the order hexadecanoic acid > 9,12-octadecadienoic acid > 9,12,15-octadecatrienoic acid, from the aspect of χ, which converse with the possibility of higher inhibition efficiency.
Figure 16.

Schematic illustration of metal–inhibitor complex formation.
Literature reported that lower electronegativity (χ) and higher dipole moment (μ) of the inhibitor molecules lead to surge the inhibition performance due to stronger metal–inhibitor binding.43−47 Therefore, it could be concluded that 9,12,15-octadecatrienoic acid entailed with higher polarization power, higher effective surface area, and higher electron contributing efficacy, which would be attributed for enriched corrosion inhibition. Table 5 also illustrates that the values of ΔN found suitable for both 9,12-octadecadienoic acid and 9,12,15-octadecatrienoic acid, indicating similar potential of electron transfer.
Moreover, the differences between the EHOMO values of 9,12-octadecadienoic acid/9,12,15-octadecatrienoic acid and the ELUMO values of iron (E1) and vice versa (E2) are exhibited in Figure 16, which represented that E19,12-octadecadienoic acid–iron was slightly higher than E19,12,15-octadecatrienoic acid–iron, while E2iron–9,12,15-octadecatrienoic acid was greater than E2iron–9,12-octadecadienoic acid. Hence, it could be envisaged that the inhibition efficiency of SFA is primarily controlled by 9,12,15-octadecatrienoic acid. Therefore, the entire examination of SFA by DFT has recommended that the studied inhibitor containing 9,12,15-octadecatrienoic acid and 9,12-octadecadienoic acid as its major constituents functions as effective anticorrosion substrates for mild steel in acid solution.
3.7. Adsorption Mechanism: Mild Steel–Fatty Acids Association
The present report demonstrated the presence of saturated (C16:0) and unsaturated fatty acids (C18:2 and C18:3), which acted as potential inhibitors of MS corrosion under acidic solution. The organic moieties present in fatty acid molecules existed with terminal carboxylate anion (COO–), which could also show the electrostatic binding with positively charged MS surface. Moreover, the presence of conjugated and nonconjugated double bonds in fatty acids could be able to share the localized pi electron with vacant d orbital of iron. Additionally, binding of high-molecular-weight fatty acids over MS decreases the available surface due to steric hindrance, addressing the declination of corrosion. Generally, the Fe dissolution in aqueous HCl environment encompasses the transfer of two electrons, and it is controlled by OH– ions. The plausible inhibition mechanism was explained by physical adsorption phenomenon, which occurred due to the unsaturated bonds and the presence of active functional group in fatty acids (carboxylate anion). The carboxylate anion of fatty acid molecules may interact with Fe2+ for the formation of metal–inhibitor complex and therefore decrease the dissolution of metallic surface in the acidic medium. These R–COO– showed the bond formation with the surface Fe atom and evolved H2 molecules owing to retarded HER (Figure 17). However, deprotonated state may be in minority due to low pH, but the interaction of the neutral state with metal-vacant orbitals plays a pivotal role to enhance the adsorption characteristics. Hence, the rate of Fe dissolution retarded gradually with the involvement of inhibitors by forming a uniform coating on metallic surface. It may help to enhance the rate of adsorption of inhibitor molecule on metal surface. Hence, the contribution of unsaturated molecules like 9,12,15-octadecatrienoic acid and 9,12-octadecadienoic acid toward the anticorrosion behavior over MS is higher compared to that of saturated molecule, i.e., hexadecanoic acid, also supported by DFT analysis. Therefore, a good insight depending on both experimental and theoretical observations advocated that the corrosion inhibition potential of the tested fatty acids followed the trend C18:3 > C18:2 > C16:0.
Figure 17.

Schematic illustration of mild steel corrosion in 1 M HCl solution and inhibition with SFA.
Conclusions
Our current work portrayed a novel and holistic approach to decrease the rate of mild steel corrosion by deploying SFA in 1 M HCl solution with the impact on the mixed inhibition strategy. The maximum inhibition efficiency with the incorporation of an optimal SFA concentration 36 ppm was achieved at 95.1%. This appreciable performance is exhibited due to the development of a protective barrier composed of microalgal fatty acid molecules, wherein 9,12,15-octadecatrionic acid and 9,12-octadecanoic acid have been emphasized to form a strong metal–inhibitor framework, followed by DFT. Microstructural analysis played a decisive role to confirm a strong resistive potential of MS at different time intervals up to 72 h consecutively. The protection of metallic surface from corrosion in the presence of SFA has been developed by a strong physical adsorption phenomenon, obtained from Kads values at different experimental temperatures. AFM analysis showed a remarkable reduction of surface roughness from 138.51 to 45.09 nm, contributed by SFA. Visual recording shows that the amount of hydrogen evolution reaction (HER) is significantly reduced in the presence of SFA inhibitor, compared to blank solution.
Acknowledgments
A.K. conveys her gratitude to CSIR, SRF (file no. 09/915(0012)/2018-EMR-1). M.P.R. gratefully acknowledges the financial support from the CSIR, Human Resource Development Group, New Delhi, India, for support through the project grant [38 (1412) 16/EMR-II]. They also express their gratitude to Amity Institute of Biotechnology for providing facilities to make biological work possible. One of the authors (M.S.) acknowledges DST, New Delhi, for immense support and help in performing corrosion experiments. The authors are also grateful to Dr. Gopal Ji for his valuable suggestions and Prof. Sanjay K. Srivastava, Department of Physics, Banaras Hindu University, for quantum chemical calculations (DFT); AIRF, JNU, New Delhi, for providing GC–MS facility; and CIFC, IIT (BHU), Varanasi, India, for sample characterization.
Supporting Information Available
The Supporting Information is available free of charge on the ACS Publications website at DOI: 10.1021/acsomega.8b01089.
GC–MS characterization analysis of SFA (Table S1); effect of various temperatures on MS corrosion rate and inhibition efficacy by following different SFA concentrations (Figure S1); Kads values obtained by Langmuir adsorption isotherm fitting of weight loss data at different temperatures (303–333 K) (Figure S2); OCP curves for MS in acid solution without or with inhibitor (Figure S3); adsorption isotherm fitting curves of Temkin and Frumkin isotherms based on impedance and Tafel data (Figure S4); slope, regression coefficient, and intercept for Langmuir, Temkin, and Frumkin isotherms (Table S2); fitting of experimental data for 36 ppm of SFA concentration in 1 M HCl solution (Figure S5); surface texture at different immersion time without and with SFA (Figures S6 and S7); parameters related to surface roughness of MS specimen with and without inhibitor (Table S3); and pictorial illustration of metal–inhibitor (iron–hexadecanoic acid) interaction by DFT (Figure S8) (PDF)
Videos A004 and A0017 showing HER in 1 M HCl only and in 1 M HCl + SFA, respectively (AVI) (AVI)
The authors declare no competing financial interest.
Supplementary Material
References
- Azzaoui K.; Mejdoubi E.; Jodeh S.; Lamhamdi A.; Rodriguez-Castellón E.; Algarra M.; Zarrouk A.; Errich A.; Salghi R.; Lgaz H. Eco Friendly Green Inhibitor Gum Arabic (GA) for the Corrosion Control of Mild Steel in Hydrochloric Acid Medium. Corros. Sci. 2017, 129, 70–81. 10.1016/j.corsci.2017.09.027. [DOI] [Google Scholar]
- Raja P. B.; Fadaeinasab M.; Quereshi A. K.; Rahim A. A.; Osman H.; Litaudon M.; Awang K. Evaluation of green corrosion inhibition by alkaloid extracts of Ochrosia oppositifolia and isoreserpiline against mild steel in 1 M HCl medium. Ind. Eng. Chem. Res. 2013, 52, 10582–10593. 10.1021/ie401387s. [DOI] [Google Scholar]
- Krishnegowda P. M.; Venkatesha V. T.; Krishnegowda P. K. M.; Shivayogiraju S. B. Acalyphatorta Leaf Extract as Green Corrosion Inhibitor for Mild Steel in Hydrochloric Acid Solution. Ind. Eng. Chem. Res. 2013, 52, 722–728. 10.1021/ie3018862. [DOI] [Google Scholar]
- Ji G.; Anjum S.; Sundaram S.; Prakash R. Musa paradisica peel extract as green corrosion inhibitor for mild steel in HCl solution. Corros. Sci. 2015, 90, 107–117. 10.1016/j.corsci.2014.10.002. [DOI] [Google Scholar]
- Srivastava M.; Tiwari P.; Srivastava S. K.; Prakash R.; Ji G. Electrochemical investigation of Irbesartan drug molecules as an inhibitor of mild steel corrosion in 1 M HCl and 0.5 M H2SO4 solutions. J. Mol. Liq. 2017, 236, 184–197. 10.1016/j.molliq.2017.04.017. [DOI] [Google Scholar]
- Mobin M.; Rizvi M.; Olasunkanmi L. O.; Ebenso E. E. Biopolymer as Tragacanth gum as a green corrosion inhibitor for carbon steel in 1 M HCl solution. ACS Omega 2017, 2, 3997–4008. 10.1021/acsomega.7b00436. [DOI] [PMC free article] [PubMed] [Google Scholar]
- Singh A.; Ahamad I.; Singh V. K.; Quraishi M. A. Inhibition effect of environmentally benign Karanj (Pongamia pinnata) seed extract on corrosion of mild steel in hydrochloric acid solution. J. Solid State Electrochem. 2011, 15, 1087–1097. 10.1007/s10008-010-1172-z. [DOI] [Google Scholar]
- Abiola O. K.; James A. O. The effects of Aloe vera extract on corrosion and kinetics of corrosion process of zinc in HCl solution. Corros. Sci. 2010, 52, 661–664. 10.1016/j.corsci.2009.10.026. [DOI] [Google Scholar]
- Loto C. A.; Joseph O. O.; Loto R. T.; Popoola A. P. I. Corrosion Inhibitive Behaviour of Camellia Sinensis on Aluminium Alloy in H2SO4. Int. J. Electrochem. Sci. 2014, 9, 1221–1231. [Google Scholar]
- Chaubey N.; Singh V. K.; Savita; Quraishi M. A.; Ebenso E. E. Corrosion Inhibition of Aluminium Alloy in Alkaline Media by Neolamarkia Cadamba Bark Extract as a Green Inhibitor. Int. J. Electrochem. Sci. 2015, 10, 504–518. [Google Scholar]
- M’hiri N.; Veys-Renaux D.; Rocca E.; Ioannou I.; Mihoubi Boudhrioua N.; Ghoul M. Corrosion inhibition of carbon steel in acidic medium by orange peel extract and its main antioxidant compounds. Corros. Sci. 2016, 102, 55–62. 10.1016/j.corsci.2015.09.017. [DOI] [Google Scholar]
- Casaletto M. P.; Figa V.; Privitera A.; Bruno M.; Napolitano A.; Piacente S. Inhibition of COR-TEN steel corrosion by green extracts of Brassica campestris. Corros. Sci. 2018, 136, 91–105. 10.1016/j.corsci.2018.02.059. [DOI] [Google Scholar]
- Godavarthi S.; Porcayo-Calderon J.; Casales-Diaz M.; Vazkuez-Velez E.; Neri A.; Martinez-Gomez L. Electrochemical analysis and quantum chemical behaviour of castor oil based inhibitors. Curr. Anal. Chem. 2016, 12, 476–488. 10.2174/1573411011666150929233320. [DOI] [Google Scholar]
- Yang Z. N.; Liu Y. W.; Chen Y. Linseed Oil Based Amide as Corrosion Inhibitor for Mild Steel in Hydrochloric Acid. Int. J. Electrochem. Sci. 2018, 13, 514–529. 10.20964/2018.01.94. [DOI] [Google Scholar]
- Balakrishnan T.; Sathiyanarayanan S.; Mayavan S. Advanced anticorrosion coating materials derived from sunflower oil with bifunctional properties. ACS. Appl. Mater. Interfaces 2015, 7, 19781–19788. 10.1021/acsami.5b05789. [DOI] [PubMed] [Google Scholar]
- Campana M.; Teichert A.; Clarke S.; Steitz R.; Webster J. R. P.; Zarbakhsh A. Surfactant Adsorption at the Metal Oil Interface. Langmuir 2011, 27, 6085–6090. 10.1021/la200670w. [DOI] [PubMed] [Google Scholar]
- Tian H.; Liu W.; Liu A.; Gao X.; Han P.; Ding R.; Yang C.; Wang D. Controlled delivery of multi-substituted triazole by metal-organic framework for efficient inhibition of mild steel corrosion in neutral chloride solution. Corros. Sci. 2018, 131, 1–6. 10.1016/j.corsci.2017.11.010. [DOI] [Google Scholar]
- Han P.; He Y.; Chen C.; Yu H.; Liu F.; Yang H.; Ma Y.; Zheng Y. Study on Synergistic mechanism of Inhibitor Mixture Based on Electron Transfer Behavior. Sci. Rep. 2016, 27, 33252 10.1038/srep33252. [DOI] [PMC free article] [PubMed] [Google Scholar]
- Vidyashankar S.; Gopal V. S. K.; Swarnalatha G. V.; Kavitha M. D.; Chauhan V. S.; Ravi R.; Bansal A. K.; Singh R.; Pande A.; Ravishankar G. A.; Sarada R. Characterization of fatty acids and hydrocarbons of chlorophycean microalgae towards their use as biofuel source. Biomass Bioenergy 2015, 77, 75–91. 10.1016/j.biombioe.2015.03.001. [DOI] [Google Scholar]
- Khanra A.; Sangam S.; Shakeel A.; Suhag D.; Mistry S.; Rai M. P.; Chakrabarti S.; Mukherjee M. Sustainable Growth and Lipid Production from Chlorella pyrenoidosa using N-Doped Carbon Nanosheets: Unravelling the Role of Graphitic Nitrogen. ACS Sustainable Chem. Eng. 2018, 6, 774–780. 10.1021/acssuschemeng.7b03103. [DOI] [Google Scholar]
- Kamal C.; Sethuraman G. M. Spirulina platensis – A novel green inhibitor for acid corrosion of mild steel. Arabian J. Chem. 2012, 5, 155–161. 10.1016/j.arabjc.2010.08.006. [DOI] [Google Scholar]
- Kamal C.; Sethuraman G. M. Hydroclathrus clathratus marine alga as a green inhibitor of acid corrosion of mild steel. Res. Chem. Intermed. 2013, 39, 3813–3828. 10.1007/s11164-012-0883-4. [DOI] [Google Scholar]
- Rai M. P.; Khanra A.; Rai S.; Srivastava M.; Prakash R. Pivotal role of levoglucosenone and hexadecanoic acid from microalgae Chlorococcum sp. for corrosion resistance on mild steel: electrochemical, microstructural and theoretical analysis. J. Mol. Liq. 2018, 266, 279–290. 10.1016/j.molliq.2018.06.007. [DOI] [Google Scholar]
- Kamal C.; Sethuraman G. M. Caulerpin: A bis-Indole Alkaloid As a Green Inhibitor for the Corrosion of Mild Steel in 1 M HCl Solution from the Marine Alga Caulerpa racemosa. Ind. Eng. Chem. Res. 2012, 51, 10399–10407. 10.1021/ie3010379. [DOI] [Google Scholar]
- Alam M.; Akram D.; Sharmin E.; Zafar F.; Ahmad S. Vegetable oil based eco-friendly coating materials: A review article. Arabian J. Chem. 2014, 7, 469–479. 10.1016/j.arabjc.2013.12.023. [DOI] [Google Scholar]
- Laurens L. M. L.; Jennifer M.; David W. T.; Christensen E. D.; Wychen S. V.; Eric Vadelius W.; Chen-Glasser M.; Dong T.; Davis R.; Pienkos P. T. Development of Algae Biorefinery Concepts for Biofuels and Bioproducts; Perspective on Process-compatible Products and Their Impact on Cost-Reduction. Energy Environ. Sci. 2017, 10, 1716–1738. 10.1039/C7EE01306J. [DOI] [Google Scholar]
- Robertson E. J.; Beaman D. K.; Richmond G. L. Designated Drivers: The Differing Roles of Divalent Metal Ions in Surfactant Adsorption at the Oil-Water Interface. Langmuir 2013, 29, 15511–15520. 10.1021/la403665n. [DOI] [PubMed] [Google Scholar]
- Tale P.; Ghosh B. S.; Kapadnis P. B.; Kale S. Isolation and characterization of microalgae for biodiesel production from Nisargruna biogas plant effluent. Bioresour. Technol. 2014, 169, 328–335. 10.1016/j.biortech.2014.06.017. [DOI] [PubMed] [Google Scholar]
- Rai M. P.; Gupta S. Effect of media composition and light supply on biomass, lipid content and FAME profile for quality biofuel production from Scenedesmus abundans. Energy Convers. Manage. 2017, 141, 85–92. 10.1016/j.enconman.2016.05.018. [DOI] [Google Scholar]
- Guldhe A.; Singh B.; Rawat I.; Ramluckan K.; Bux F. Efficacy of drying and cell disruption techniques on lipid recovery from microalgae for biodiesel production. Fuel 2014, 128, 46–52. 10.1016/j.fuel.2014.02.059. [DOI] [Google Scholar]
- Rai M. P.; Nigam S.; Sharma R. Response of growth and fatty acid compositions of Chlorella pyrenoidosa under mixotrophic cultivation with acetate and glycerol for bioenergy application. Biomass Bioenergy 2013, 58, 251–257. 10.1016/j.biombioe.2013.08.038. [DOI] [Google Scholar]
- Ji G.; Dwivedi P.; Sundaram S.; Prakash R. Inhibitive Effect of Chlorophytum borivilianum Root Extract on Mild Steel Corrosion in HCl and H2SO4 Solutions. Ind. Eng. Chem. Res. 2013, 52, 10673–10681. 10.1021/ie4008387. [DOI] [Google Scholar]
- Ostovari A.; Hoseinieh S. M.; Peikari M.; Shadizadeh M.; Hashemi S. J. Corrosion inhibition of mild steel in 1 M HCl solution by henna extract: A comparative study of the inhibition by henna and its constituents (Lawsone, Gallic acid, alpha-D-Glucose and Tannic acid). Corros. Sci. 2009, 51, 1935–1949. 10.1016/j.corsci.2009.05.024. [DOI] [Google Scholar]
- Srivastava M.; Tiwari P.; Srivastava S. K.; Kumar A.; Ji G.; Prakash R. Low cost aqueous extract of Pisum sativum peels for inhibition of mild steel corrosion. J. Mol. Liq. 2018, 254, 357–368. 10.1016/j.molliq.2018.01.137. [DOI] [Google Scholar]
- Soltani N.; Tavakkoli N.; Khayatkashani M.; Jalali M. R.; Mosavizade A. Green approach to corrosion inhibitor of stainless steel in hydrochloric acid solution by the extract of Salvia officinalis leaves. Corros. Sci. 2012, 62, 122–135. 10.1016/j.corsci.2012.05.003. [DOI] [Google Scholar]
- Tiwari M.; Gupta V. K.; Singh R. A.; Ji G.; Prakash R. Donor−π–Acceptor-Type Configured, Dimethylamino-Based Organic Push–Pull Chromophores for Effective Reduction of Mild Steel Corrosion Loss in 1 M HCl. ACS Omega 2018, 3, 4081–4093. 10.1021/acsomega.8b00083. [DOI] [PMC free article] [PubMed] [Google Scholar]
- Ji G.; Dwivedi P.; Sundaram S.; Prakash R. Inhibitive Effect of Chlorophytum borivilianum Root Extract on Mild Steel Corrosion in HCl and H2SO4 Solutions. Ind. Eng. Chem. Res. 2013, 52, 10673–10681. 10.1021/ie4008387. [DOI] [Google Scholar]
- Macdonald J. R. Impedance spectroscopy and its use in analyzing the steady-state AC response of solid and liquid electrolytes. J. Electroanal. Chem. Interfacial Electrochem. 1987, 223, 25–50. 10.1016/0022-0728(87)85249-X. [DOI] [Google Scholar]
- Simič R.; Kalin M. Adsorption mechanisms for fatty acids on DLC and steel studied by AFM and tribological experiments. Appl. Surf. Sci. 2013, 283, 460–470. 10.1016/j.apsusc.2013.06.131. [DOI] [Google Scholar]
- Alhaffar M. T.; Umoren S. A.; Obot I. B.; Ali S. A. Isoxazolidine derivatives as corrosion inhibitors for low carbon steel in HCl solution: experimental, theoretical and effect of KI studies. RSC Adv. 2018, 8, 1764–1777. 10.1039/C7RA11549K. [DOI] [PMC free article] [PubMed] [Google Scholar]
- Wellen B. A.; Lach E. A.; Allen H. C. Surface pKa of octanoic, nonanoic, and decanoic fatty acids at the air–water interface: applications to atmospheric aerosol chemistry. Phys. Chem. Chem. Phys. 2017, 19, 26551–26558. 10.1039/C7CP04527A. [DOI] [PubMed] [Google Scholar]
- Saha S. K.; Murmu M.; Murmu N. C.; Banerjee P. Evaluating electronic structure of quinazolinone and pyrimidinone molecules for its corrosion inhibition effectiveness on target specific mild steel in the acidic medium: A combined DFT and MD simulation study. J. Mol. Liq. 2016, 224, 629–638. 10.1016/j.molliq.2016.09.110. [DOI] [Google Scholar]
- Verma C.; Quraishi M. A.; Kluza K.; Makowska-Janusik M.; Olasunkanmi L. O.; Ebenso Eno E. Corrosion inhibition of mild steel in 1 M HCl by D-glucose derivatives of dihydropyrido [2, 3-d: 6, 5-d′] dipyrimidine-2, 4, 6, 8 (1H, 3H, 5H, 7H)- tetraone. Sci. Rep. 2017, 7, 44432 10.1038/srep44432. [DOI] [PMC free article] [PubMed] [Google Scholar]
- Obi-Egbedi N. O.; Obot I. B.; El-Khaiary M. I.; Umoren S. A.; Ebenso E. E. Computational Simulation and Statistical Analysis on the Relationship between Corrosion Inhibition Efficiency and Molecular Structure of Some Phenanthroline Derivatives on Mild Steel Surface. Int. J. Electrochem. Sci. 2011, 6, 5649–5675. [Google Scholar]
- Aslam R.; Mobin M.; Zehra S.; Obot I. B.; Ebenso E. E. N,N′-Dialkylcystine Gemini and Monomeric N-Alkyl Cysteine Surfactants as Corrosion inhibitors on mild steel corrosion in 1 M HCl solution: A Comparative study. ACS Omega 2017, 2, 5691–5707. 10.1021/acsomega.7b00501. [DOI] [PMC free article] [PubMed] [Google Scholar]
- Saha S. K.; Hens A.; Murmu N.; Banerjee P. A comparative density functional theory and molecular dynamics simulation studies of the corrosion inhibitory action of two novel N-heterocyclic organic compounds along with a few others over steel surface. J. Mol. Liq. 2016, 215, 486–495. 10.1016/j.molliq.2016.01.024. [DOI] [Google Scholar]
- Saha S. K.; Dutta A.; Ghosh P.; Sukul D.; Banerjee P. Novel Schiff base molecules as efficient corrosion inhibitors for mild steel surface in 1 M HCl medium: experimental and theoretical approach. Phys. Chem. Chem. Phys. 2016, 18, 17898–17911. 10.1039/C6CP01993E. [DOI] [PubMed] [Google Scholar]
Associated Data
This section collects any data citations, data availability statements, or supplementary materials included in this article.