Abstract
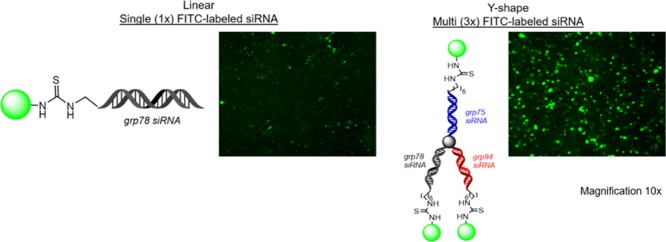
The integration of therapy and diagnostics, termed “theranostics”, has recently gained widespread utility in the development of new and improved therapeutics that effectively diagnose and treat diseases, such as cancer. In this study, the covalent attachment of multiple fluorescent labels (i.e., fluorescein isothiocyanate (FITC)) to a wide range of siRNAs, including those adopting linear, V- and Y-shape nanostructures, was successfully accomplished by solid-phase bioconjugation for monitoring cell uptake, co-localization, and biological activity in cell culture. The FITC-labeled higher-order V- and Y-shape siRNAs maintained the requisite hybrid stabilities and A-type helical structures for invoking RNAi activity. The FITC–siRNA hybrids with sense-strand modifiers enabled efficient mRNA knockdown (∼50–90%), which also translated to increased cell death (∼20–95%) in a bone metastatic prostate cancer cell line, over a 72 h incubation period. Significantly, the Y-shaped siRNA containing three FITC probes enhanced fluorescent signaling relative to the siRNA constructs containing single and double fluorophores while retaining potent knockdown and cell death effects post-transfection. Taken together, this data highlights the theranostic utility of the multilabeled FITC–siRNA constructs for potential cancer gene therapy applications.
Introduction
Gene therapy has re-emerged as a promising precision medicine strategy for the targeted treatment of cancer. At the forefront of this therapeutic application are short-interfering RNAs (siRNAs) that have silenced oncogenic mRNA expression leading to cancer cell death through the RNA interference (RNAi) mechanism.1,2 Therapeutic siRNAs have been extensively tested in preclinical studies, and some have already entered clinical trials for the treatment of cancer and several other diseases.3,4 Consummately, the first Food and Drug Administration-approved siRNA drug Onpattro (patisiran) is set to hit the open market for adult clinical treatment of hereditary transthyretin-mediated amyloidosis.5
The integration of therapy and diagnostics “theranostics” has gained significant traction in the development of new and improved gene therapeutics for the diagnosis and treatment of cancers.6 More specifically, siRNA bioconjugates containing reporter probes, such as fluorophores, near-infrared (near IR) dyes and photosensitizers as well as those containing contrast agents and radiolabels, have been extensively applied as theranostic agents in oncology to selectively detect and treat malignant tumors at their localized sites in a preventative precision medicine strategy.7,8 Synthetic approaches for theranostic siRNA development have been mostly focused on tagging the delivery vehicles and targeting ligands8−12 as well as direct siRNA labeling to track cell uptake, co-localization, and RNAi activity in cancer cells.13−16 Taken together, these selected examples serve to highlight the potential applications of theranostic siRNA formulations that have enabled detection and treatment in difficult to treat tumor cells, both in vitro and in vivo by selectively targeting and silencing oncogenic mRNA expression. Conventional linear siRNAs are typically limited by a single-site fluorophore incorporation at the 3′ or 5′ terminus by conventional solid-phase RNA synthesis. This incorporation hinders the efficiency and duration of fluorescence emission due to inevitable quenching, photobleaching, decomposition, and leaching of the bound fluorophore. Therefore, potentially incorporating multiple fluorescent (FL) probes within single, higher-order RNA molecular scaffolds provides the opportunity to enhance detection and visualization of RNA activity in cancer cells and tumor-bearing animal models. The latter is a primary goal in the development of an effective siRNA-based theranostic approach.
Toward this objective, we have previously reported the synthesis, characterization, and RNAi evaluation of higher-order branch and hyperbranch siRNAs.17 Significantly, these constructs targeted multiple mRNA sites belonging to the glucose-regulated protein of 78 kDa (GRP 78) and triggered more potent silencing (50–60%) and cell death (5–20%) in HepG2 hepatocellular carcinoma cells relative to their linear controls. Moreover, the V- and Y-shape RNAs served as templates for the self-assembly of siRNA nanostructures into genetically encoded shapes targeting, GRP 75, GRP 78, and GRP 94 in endometrial, cervical, and breast cancers.18 These unique siRNA nanostructures were found to elicit synergistic anticancer effects while enabling screening for the influence of the GRPs on cancer cell biology. The GRP-silencing siRNAs revealed a stronger addiction of tumor cells to GRP overexpression and proliferation when compared to a nontumorigenic control cell line, which displayed normal GRP expression levels. These results underscored the GRP dependence of cancer cells, which provided insights on tumor treatment specificity.
The GRPs are chaperone proteins that serve as main sensors for misfolded proteins in the endoplasmic reticulum (ER) and trigger the unfolded protein response (UPR) under physiological and pathological cellular stress conditions.19 As chaperones, GRPs own subcellular localization in the ER where they chaperone protein folding activity, in the mitochondria where they interact with pro-apoptotic and survival executors and at the cell surface where they direct cell signaling.19 In cancer, the GRPs are overexpressed and in certain tumors, cell surface localized where they function as signaling receptors for oncogenic activity.20 GRP knockdown or inhibition has been shown to sensitize cancer cells for treatment, trigger tumor cell cycle arrest, and apoptosis resulting in potent anticancer effects.21−24 Thus, the GRPs have been validated as clinically relevant molecular targets in cancer.19
In this study, the design, synthesis, characterization, and biological evaluation of a wide range of GRP-silencing siRNAs are reported. These include the siRNAs adopting linear, V-shape, and Y-branch structures that enabled the incorporation of multiple fluorescein isothiocyanate (FITC) reporter probes for enhanced monitoring of cell uptake, co-localization, and biological activity within PC-3 prostate cancer cells.
Results and Discussion
FITC Labeling of RNA Templates
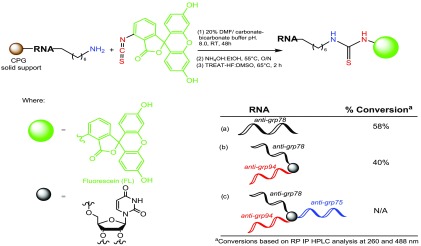
The siRNA sequences described in this study (see Supporting Information, Table S1) are based on the target nucleotides for downregulating GRP 75, 78, and 94 expression in human cancer cells.25 The linear, V-, and Y-shaped RNA templates targeting GRP 75, 78, and 94 mRNA were synthesized by automated solid-phase RNA synthesis following our previously reported procedure.17,18 Briefly, an orthogonally protected 5′-OLv 2′-OMMT ribouridine phosphoramidite was used as branchpoint synthon to selectively extend the linear RNA sequence on solid phase into the desired V- and Y-shape RNA templates. Following solid-phase RNA synthesis, a 5′-DMS(O)-MT-amino C6 modifier (Glen Research Inc.) was coupled to the 5′-terminal, which upon detritylation produced a free amino group for bioconjugation. The amine-functionalized RNA templates were then subjected to solid-phase conjugation for the covalent attachment of FITC following a previously reported procedure (Scheme 1).26
Scheme 1. Solid-Phase FITC Bioconjugation of Linear, V-, and Y-Shape RNA Templates.
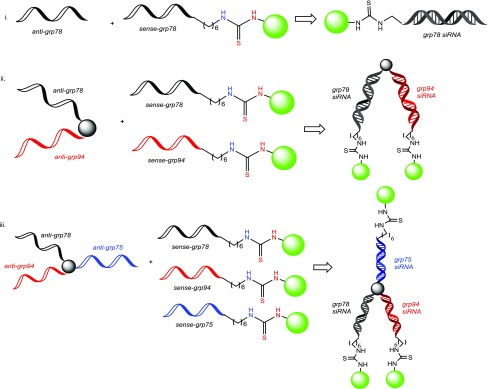
Reverse-phase ion pairing high-performance liquid chromatography (RP-IP HPLC) analysis of the crude reaction mixture following cleavage and deprotection from the solid support indicated good conversions in the case of both the linear (∼60%) and V-shaped FITC–RNA (∼40%). However, conversion to the Y-shaped FITC–RNA was not observed. To address this limitation, conjugation of FITC to the corresponding complementary linear sense strands was achieved as described above and isolated following HPLC purification in high yields and purities >95%, followed by hybridization with the Y-shape RNA template. The sense-strand FITC-labeled linear RNA strands were also hybridized with the corresponding linear and V-shape RNA templates allowing for a direct comparison of FITC modification on the sense vs antisense RNA strands. The latter has been found to trigger profound effects on siRNA silencing activity.27 Moreover, hybridization of the linear FITC-labeled sense RNA strands to the linear, V-shape, and Y-shape RNA templates allowed for the incorporation of single, double, and triple fluorescent probes, respectively, within the higher-order, self-assembled siRNA bioconjugates (Scheme 2). All FITC-labeled RNA templates were isolated in ≥95% purities, and their identities were confirmed by electrospray ionization mass spectrometry (ESI MS); see Table S1, Supporting Information.
Scheme 2. Self-Assembly of (i) Linear, (ii) V-, and (iii) Y-Shape Multi-FITC-Labeled siRNA Constructs,
The green label represents fluorescent (FL) FITC-labeled sequences for linear (L), V-shape (V), and Y-shape (Y) siRNAs containing a single (1F), double (2F), and triple (3F) fluorophores.
Antisense (A) and sense (S) strands were hybridized to target a first (1) or second (2) mRNA site belonging to GRP 75, 78, and 94.
Characterization of FITC-Labeled siRNAs
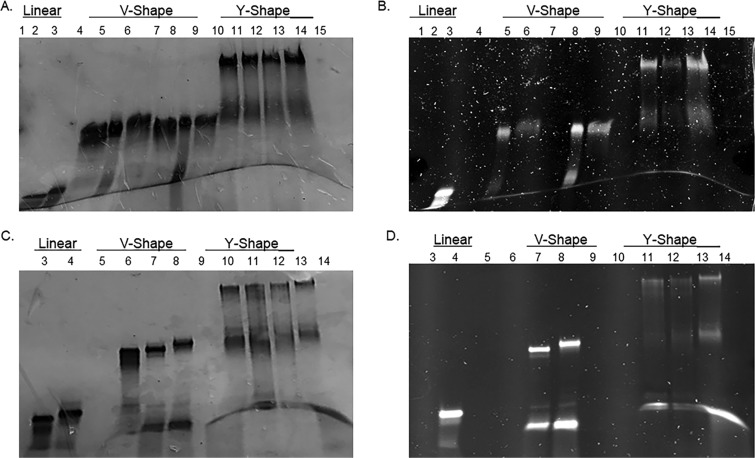
The purified RNA templates and their complementary RNA single strands were hybridized in annealing buffer (10 mM Tris, 50 mM NaCl, and 1 mM ethylenediaminetetraacetic acid (EDTA); pH 7.5–8.0, 35 μL) using equimole amounts (200 pmol) of the complementary strands. siRNA hybridization was confirmed by a native, nondenaturing 16% polyacrylamide gel electrophoresis (PAGE). In this assay (Figure 1A), the lower-molecular-weight linear siRNA hybrids migrated fastest on the gel (lanes 1 and 2), whereas the V- and Y-shaped RNA templates hybridized to their complementary RNA single strands (Figure 1A, lanes 4–9 and lanes 10–13, respectively) were more retained. Long-wave UV shadowing revealed the FITC-labeled siRNA hybrids (Figure 1B, lanes 2, 5–6, 8–9, and 11–13). Native PAGE analysis of multi-FITC–siRNA samples also confirmed successful hybridization, (Figure 1C). In this assay, the lower-molecular-weight linear siRNA hybrids (lanes 3 and 4) once more migrated fastest on the gel, whereas the V- and Y-shaped RNA templates hybridized to their complementary RNA single strands, which contained the FITC labels (Figure 1C, lanes 7–8 and lanes 11–13, respectively), were more retained on the gel. Long-wave UV shadowing revealed the bright multi-FITC-labeled V- and Y-shape siRNA hybrids containing double and triple fluorescent probes, respectively (Figure 1D, lanes, 8 and 13).
Figure 1.
Native PAGE analysis of FITC-labeled siRNAs under short (A, C) and long (B, D) UV radiations. Sequences in green represent fluorescent (FL) FITC-labeled sequences for linear (L), V-shape (V), and Y-shape (Y) siRNAs. Antisense (A) and sense (S) strands hybridized to target a first (1) or second (2) mRNA sites belonging to GRP 75, 78, and 94. siRNA sequences for A and B: lane 1: dye; lane 2 A1:S1; lane 3 FL-78A1:78S1; lane 4 V-78A194A1:78S194S1; lane 5 FL-V-78A194A1:78S194S1; lane 6 V-78A194A1:78S1FL-94S1; lane 7 V-78A178A2:78S178S2; lane 8 FL-V-78A178A2:78S178S2; lane 9 V-78A178A2:FL-78S178S2; lane 10: Y-78A194A175A1:78S194S175S1; lane 11 Y-78A194A175A1:FL-78S194S175S1; lane 12 Y-78A194A175A1:78S1FL-94S175S1; lane 13 Y-78A194A175A1:FL-78S1FL-94S175S1; lane 15 dye. siRNA sequences for (C) and (D). Lane 1 dye; lane 2 empty; lane 3 A1:S1; lane 4 78A1:FL-78S1; lane 5 empty; lane 6 V-78A194A1:78S194S1; lane 7 V-78A194A1:FL-78S194S1; lane 8 V-78A194A1:FL-78S1FL-94S1; lane 9 empty; lane 10 Y-78A194A175A1:78S194S175S1; lane 11 Y-78A194A175A1:78S194S1FL-75S1; lane 12 Y-78A194A175A1:78S1FL-94S1FL-75S1; lane 13 Y-78A194A175A1:FL-78S1FL-94S1FL-75S1; lane 14 empty; lane 15 dye.
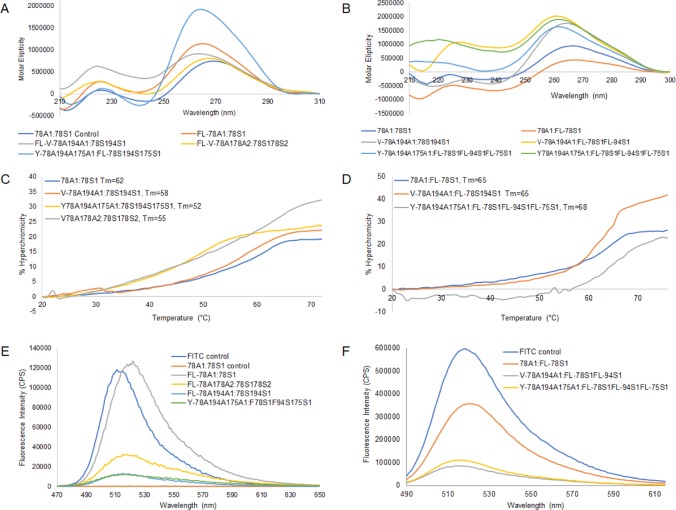
Circular dichroism (CD) spectroscopy was then used to determine whether the siRNA hybrid structures maintained the prerequisite A-type helix geometry for RNAi applications.28 The linear siRNAs displayed typical CD profiles for A-form helices, with a minimum peak at 240 nm and a broad maximum in between 250 and 290 nm.29 In all cases, the linear, V-, and Y-shaped FITC–siRNA hybrids (Figure 2A) retained the A-type broad maximum and minimum bands, which were observed between 250–290 and 240 nm, respectively, albeit with a decrease in the amplitudes of the molar ellipticities at these characteristic wavelengths. The multi-FITC-labeled siRNAs (Figure 2B) produced more pronounced deviations from the A-type RNA helix. In most cases, the maximum peak at 260 nm remained, however, with notable changes in molar ellipticities at the characteristic maxima and minima within the 210–250 nm range. Therefore, it can be suggested that the FITC labels produce distortions in the A-type helix geometry of the siRNA, with more pronounced effects observed with the multi-FITC-labeled V- and Y-shape siRNA hybrids. Their effect on hybrid stability, fluorescence emission, and biological activity was subsequently examined.
Figure 2.
Characterization data of FITC-labeled siRNA hybrids. Circular dichroism spectroscopy of (A) FITC-labeled siRNAs and (B) multi-FITC-labeled siRNAs. Thermal denaturation, Tm, of FITC-labeled siRNAs (C) and multi-FITC-labeled siRNAs (D). Fluorescence emission spectra of (E) FITC-labeled siRNAs and (F) multi-FITC-labeled siRNAs. All siRNA hybrids were prepared in annealing buffer (1.25 μM, 10 mM Tris, 50 mM NaCl, 1 mM EDTA, pH 7.5–8.0).
Stability of the FITC–siRNA hybrids was measured by thermal denaturation (Tm). The addition of the FITC probe at the 5′ terminus of the antisense strand had little to no effect on hybrid stability (Figure 2C). For example, the linear FITC-GRP78A1:S1 maintained similar hybrid stabilities (Tm: 63 °C) relative to the native A1:S1 (Tm: 62 °C) siRNAs. Likewise, the V-shaped FITC-V-78A194A1:78S194S1 (Tm: 58 → 60 °C) and FITC-V-78A178A2:78S178S2 (Tm: 55 → 62 °C) showed a slight increase in thermal hybrid stabilities. The Y-shaped hybrids elicited a weaker hybrid stability, (Tm: 52 °C), however, as seen previously, incorporation of the FITC label had little to no effect on siRNA hybrid thermal stability. In the case of the multi-FITC–siRNAs (Figure 2D), the V-shape RNA template hybridized with two FITC-linear RNAs showed an increase in hybrid stability (Tm: 58 → 65 °C), whereas the Y-shape hybridized with three FITC-linear RNAs exhibited a more significant increase in hybrid stability (Tm: 52 → 68 °C). Taken together, the FITC labels promote little changes with a single incorporation to more significant increases in siRNA hybrid stability with the incorporation of multiple FITCs, suggesting a stabilizing effect, potentially due to π-stacking and n → π* interactions with adjacent nucleobases on the oligonucleotide strands.30,31
Spectrofluorimetry was used to determine whether the siRNA hybrids had any effect on fluorescence emission intensities and quantum yields of the FITC probe. Previous studies on fluorescently labeled oligonucleotides have illustrated that covalent conjugation decreases fluorescence efficiency.30 Upon conjugation of FITC with the siRNA sequences, a blue shift (485–445 nm) was observed.31 UV absorption studies revealed an observed FITC absorption peak at around 460 nm (see Supporting Information, Figure S20). Upon excitation (λex: 460 nm), the emission spectrum was monitored (λem: 470–650 nm) for the fluorescent FL–siRNA hybrids (Figure 2E). Interestingly, the linear FITC-78A1:S1 sample produced comparable fluorescence quantum yields (ϕ = 1.0), as the FITC fluorescent probe alone (ϕ = 0.93). Furthermore, a notable red shift in the fluorescence emission maxima, λem: 515–520 nm, was observed for the FL–siRNAs vs FITC alone. The two V- (ϕ = 0.28, 0.14) and single Y-shaped (ϕ = 0.15) FITC-labeled siRNA samples displayed significant quenching (70–85%) when compared to the linear FL–siRNA and the FITC control, as also described in the literature.31 The latter may be presumably due to the nature of the extended sequence composition and higher-order structures of the V- and Y-shape siRNAs, which effect FITC fluorescence efficiency when compared to the linear FITC-labeled siRNA hybrid duplex. In an attempt to overcome this limitation, multiple FITC-labeled complementary sense-strand RNAs were hybridized to the antisense V- and Y-shape RNA templates (Scheme 2). The fluorescence emission spectra of the multi-FITC-labeled V- and Y-shape siRNAs, which incorporated two and three FITC fluorescent probes, respectively, were found to increase fluorescence emission intensity (Figure 2E,F) although with still observable quenching effects (V-2 FL-S1 ϕ = 0.17, Y-3 FL-S1 ϕ = 0.24) when compared with the siRNAs with the incorporation of a single FITC probe (FL-S1 ϕ = 0.66) (Figure 2E). In spite of the quenching effects, the higher-order V- and Y-shape siRNAs, which enabled the incorporation of multiple FITC reporter probes, produced greater intensities of fluorescence emissions when compared to the siRNAs containing a single FITC probe. The latter may be useful in potentiating cell signaling to track siRNA biological activity in live cells.
Cell Uptake and Intracellular Localization of FITC–siRNAs
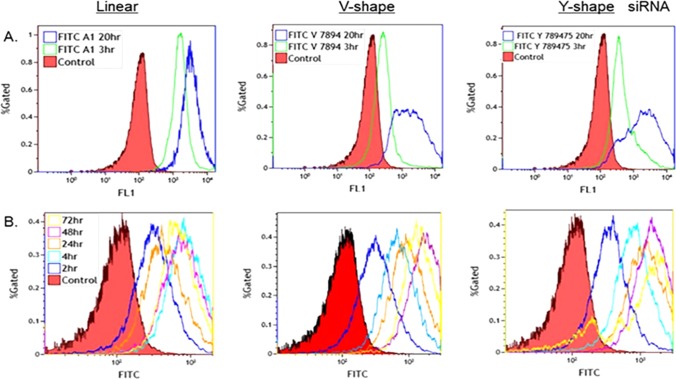
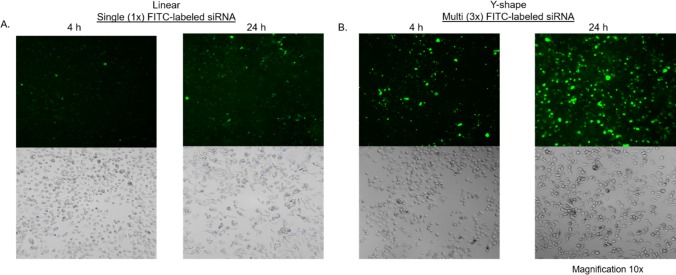
The PC-3 prostate cancer cell line (ATCC CRL-1435) was used to determine the knockdown efficiency of the FITC-labeled siRNA constructs.32 Uptake and internalization efficiency of the FITC–siRNA sequences were determined by flow cytometry. The fluorescence intensities of the linear, V-, and Y-shaped FITC-labeled siRNAs compared to control siRNA were initially investigated (Figure 3A). Of note, V and Y-shaped siRNA signals showed a decrease in the percentage of total gated cells suggesting that these configurations may experience quenching of the FITC fluorescence over time. Interestingly, the multi-FITC–siRNA signaling increased over time (Figure 3B, 4–72 h) when compared to the FITC-labeled siRNAs containing single fluorophores (Figure 3A,B). Thus, the multi-FITC–siRNAs were found to overcome the apparent quenching effects observed in the V- and Y-shape siRNAs containing a single fluorophore. These trends were also observed in the spectrofluorimetry studies (Figure 2E,F). High content screening was also used to visualize the internalization of the FITC–siRNAs within PC-3 cells up to 24 h post-transfection (Figure 4).
Figure 3.
siRNAs’ uptake efficiency in PC-3 cells monitored by flow cytometry. (A) Cell internalization of linear, V- and Y-shaped FITC-labeled siRNA. (B) Time-dependent cell internalization of linear, V- and Y-shaped siRNA containing single, double or triple FITCs, respectively.
Figure 4.
Time-dependent (4 and 24 h post-transfection) fluorescent and bright-field images of PC-3 cells transfected with (A) linear FITC-labeled siRNA and (B) Y-shape FL–siRNA containing multiple (3×) FITC probes.
GRP Knockdown and Cell Death Effects of FITC–siRNAs
siRNA transfections (10 μM) were conducted with the TransIT-X2 Dynamic Delivery System transfection reagent within the PC-3 cell culture and incubated for 72 h. Reverse transcription polymerase chain reaction (RT-PCR) indicated that upon GRP 78 mRNA knockdown, a marked upregulation of GRP 94 expression was observed, with a lower effect on the GRP 75 mRNA levels (Figure 5A). Presumably, this compensatory effect may be linked to the maintenance of the UPR under the stress-induced conditions, potentially linking the activity of these GRP chaperones.25 A similar trend was observed for the V-shaped siRNA targeting GRP 78 and 94 mRNA, with a noticeable upregulation of GRP 75, albeit to a smaller extent (Figure 5A). The Y-shaped siRNA targeting all three GRP chaperone proteins displayed the most synergistic mRNA knockdown (40–70%) of GRP 75, 78, and 94 (Figure 5A). Comparison with the FITC-labeled siRNA constructs demonstrated GRP knockdown (20–70%) in a sequence-dependent manner albeit to a lesser extent when compared to the native, unconjugated siRNAs (40–80%) (Figure 5A). The decrease in GRP-silencing activity of the FL-labeled siRNAs can be partially attributed to detrimental effects of functionalizing the 5′ terminus of the antisense siRNA strand, which may inhibit incorporation into RNA induced silencing complex and mRNA processing as part of the RNAi pathway.27 Interestingly, when the sense strands were FITC-labeled and hybridized to the complementary Y-shaped RNA template, the FITC-labeled Y-shape siRNA displayed comparable GRP knockdown (55–95%), as the non-FITC-labeled Y-shape siRNAs (40–80%) (Figure 5B). Thus, FITC functionalization of the sense-strand was found to restore siRNA activity.
Figure 5.
qRT-PCR and Western blot analyses of GRP 75, 78, and 94. (A) Total mRNA levels were analyzed 72 h post-transfection of the antisense-labeled FL–siRNA constructs. (B) Total mRNA levels were analyzed 48 h post-transfection of the sense-strand-labeled FL–siRNA constructs containing 1, 2, and 3 FITC probes. Protein and mRNA knockdown levels of GRP 75, 78, and 94 determined by Western blot (C) and RT-PCR (D) with the Y-shape FL–siRNA containing three FITC probes. *P < 0.05 and *P < 0.01 in PC-3 cells.
Following qRT-PCR screening, the lead Y-shaped siRNA containing three FITC probes was selected for further analysis. The Y-shaped siRNA sample (50 nM) was prepared and transfected into PC-3 cells as described earlier. Cells were collected 72 h post-transfection and subjected to qRT-PCR and Western blot. RT-PCR (Figure 5D) showed mRNA knockdown of GRP 78 (∼40%), increased knockdown of GRP 94 (∼60%) without noticeable effects on GRP 75. However, Western blot indicated protein level knockdown of GRP 75 and 78 (∼30–35%) in both instances, but no visible knockdown of GRP 94, which is known to vary from the mRNA transcript levels during UPR stress (Figure 5C).33
Cell viability of the FITC-labeled siRNAs treated PC-3 cells was measured using propidium iodide (PI) staining. PI is a fluorescent intercalating agent that stains dead cells and is commonly used in flow cytometry to evaluate cell viability. PI cannot cross the membrane of live cells, making it useful to differentiate necrotic, apoptotic, and healthy cells.34 PC-3 cell viability was determined at 24, 48, and 72 h post-transfection to determine which construct exhibited the most potent cell death activity (see Supporting Information, Figure S25). Following 24 h incubation, it was noted that the supernatant contained PC-3 cells as an initial indicator of cell death due to loss in adhesion. Both the supernatant cells as well as the cells still adhered to the bottom of the well were tested for viability. PI staining showed an increase in cell death over a 72 h period for all samples. The Y-shape siRNA targeting all three GRPs elicited the most potent cell death in both cases.
Conclusions
In this study, the covalent attachment of FITC to a wide range of GRP-silencing siRNAs, including those adopting linear, V-, and Y-shape structures, allowed the incorporation of multiple FITC reporter probes for monitoring cellular uptake. Although FITC labeling had some effect on the requisite A-type helix structure required for RNAi activity, the fluorescent probe did not inhibit hybrid duplex stability according to thermal denaturation studies. The higher-order V- and Y-shape siRNAs, which enabled the incorporation of multiple FITC reporter probes, displayed fluorescence quenching, albeit with greater intensities of fluorescence emissions when compared to the siRNAs containing a single FITC. Upon transfection in the PC-3 prostate cancer cells, the FITC-labeled siRNAs triggered GRP mRNA and protein knockdown, which resulted in loss of PC-3 cell adhesion and induced cell death. Flow cytometry and high content screening also revealed the presence of the FITC-labeled siRNA within PC-3 cells up to 72 h. Therefore, the V- and Y-shape multi-FITC-labeled siRNAs encompass a new class of theranostic agents with enhanced cell-based detection and RNAi activity in cancer cells.
Experimental Methods
Materials and Methods
Chemical synthesis reagents and solvents were obtained from ChemGenes, Aldrich, and VWR and used as received. Solid-phase RNA synthesis reagents were obtained from ChemGenes or Glen Research Inc. and also used without further purification. Analytical thin-layer chromatography (TLC) was performed on aluminum-backed silica gel plates (Merck 60 F254). TLCs were visualized under UV shadowing (260 nm) or staining (10% H2SO4/MeOH). Compound purification using silica gel chromatography was performed on 230–400 mesh silica (Sorbent Technologies). Molecular weights for the branchpoint uridine phosphoramidite were measured by direct injections on a Hewlett Packard series 1100 MSD equipped with ESI as ion source in positive mode using 50:50 v/v MeOH/H2O at a flow rate of 0.5 mL/min. NMR spectra (1H, 13C, 31P correlation spectroscopy NMR) were recorded on an OXFORD NMR AS500 spectrophotometer. NMR spectra were obtained at ambient temperature using an indirect pulse-field gradient probe. The obtained data were processed using VNMRJ software (version 2.2). Materials for cell biology were obtained from Thermo Fisher Scientific, Cell Signaling, Biolegend, Mirus and Invitrogen Life Technologies and used as received according to the manufacture’s protocol.
FITC Bioconjugation of Linear, V-, and Y-Shape RNA Templates
Linear, V-, and Y-shaped siRNAs were selected to target the GRP chaperones (GRP 75, 78, and 94), and the requisite RNA templates were synthesized as previously reported.17,18 Following synthesis, a 5′-DMS(O)-MT-Amino C6 modifier (Glen Research Inc.) was coupled to the 5′ terminal hydroxyl group using an extended 15 min coupling time on an ABI 3400 DNA/RNA synthesizer. The amino-functionalized RNA templates were then subjected to a solid-phase bioconjugation reaction for the attachment of the fluorescent probe, fluorescein isothiocyanate (FITC). Following a previously reported method,26 attachment of FITC was achieved by reacting FITC (75 equiv, 30 mg) dissolved in 20% aqueous N,N-dimethylformamide (DMF) in 0.1 M carbonate–bicarbonate buffer (pH 8.5) to the amino-modified RNA templates. The reaction was agitated at room temperature (RT) for 48 h on a benchtop shaker. Following the reaction, the CPG-bound RNA was washed with DMF and acetonitrile (MeCN) until no visible orange color remained in the supernatant. The sample was then cleaved and deprotected using 3:1 v/v NH4OH/EtOH at 55 °C for 12–14 h. The 2′-TBDMS protecting groups were desilylated using 1:1.5 v/v trimethylamine–trihydrofluoride TEA-3HF/DMSO at 65 °C for 2 h. The crude FL–RNA templates were precipitated in 3 M NaOAc (25 μL) and n-BuOH (1 mL) and dissolved in diethyl pyrocarbonate-treated Millipore water, RNase-free, for analysis and purification.
Reverse-Phase Ion Paring High-Performance Liquid Chromatography (RP-IP HPLC)
The crude RNA templates were analyzed by reverse-phase ion pairing high-performance liquid chromatography (RP-IP-HPLC) to determine crude purities. Briefly, HPLC analyses (0.1 OD) and purifications (1 OD) were performed on a Waters 2695 Alliance Separations Module. Crude RNA templates were dissolved in autoclaved water (1 mL) and injected into a Waters SymmetryShield RP-8 column (4.6 × 250 mm2, 5 μm particle size, 100 Å) heated at 60 °C. HPLC analyses and purifications were conducted using a gradient of 4–90% eluent B (50% acetonitrile in 0.1 M triethylammnonium acetate, TEAA) in eluent A (0.1 M TEAA). The HPLC flow rate was set at 1 mL/min, with run times of 25 min and with dual absorbance detection at 260 and 488 nm using a Waters 2489 UV/visible detector. Retention times (min) and peak areas (% area) were integrated with Empower II software (Waters) and used to confirm RNA purities ≥95% following sample purifications.
Mass Spectrometry
RNA templates (300–1300 pmol) were dissolved in RNase-free Millipore water (50–200 μL) and analyzed by Dr. Mark Hail and Kevin McCarl at Novatia LLC, Newtown, PA. Samples were analyzed on an Oligo HTCS equipped ESI/MS in negative mode. The data were obtained and deconvoluted using ProMass software. Theoretical molecular weights were calculated by entering each sequence identity using Oligo II mass calculator version 1.0 http://mods.rna.albany.edu/masspec/Oligo-II.
siRNA Hybridization
Purified complementary antisense and sense RNA strands were combined in equimole quantities (200 pmol) and mixed in annealing buffer (35 μL, 10 mM Tris, 50 mM NaCl, 1 mM EDTA, pH 7.5–8.0) to afford the hybrid mixtures. The resulting mixtures were heated to 95 °C for 7 min on a heating block, slowly cooled to room temperature over 1 h, and stored in the fridge overnight at 4 °C prior to analysis.
Nondenaturing, Native Polyacrylamide Gel Electrophoresis (PAGE)
The hybrid siRNA samples (10 μM) in annealing buffer (10 mM Tris, 50 mM NaCl, 1 mM EDTA, pH 7.5–8.0) were concentrated to minimal volume (∼10 μL) and suspended in 30% sucrose loading buffer (15 μL in 1× TBE). Samples were loaded on a 16% native, nondenaturing PAGE and run at 300 V, 100 mA, and 12 W for 2.5 h. Following electrophoresis, the siRNA bands were visualized under UV shadowing and stained with Stains-All (Sigma-Aldrich) solution.
Circular Dichroism (CD) Spectroscopy
siRNA samples were hybridized in annealing buffer (1.25 μM, 10 mM Tris, 50 mM NaCl, 1 mM EDTA, pH 7.5–8.0), as previously described. Samples were then transferred to fused quartz cells (1 cm path length) and incubated at room temperature (RT) under N2 for 2 min prior to spectral acquisition. CD spectra were collected on an Olis DSM 1000 Spectrophotometer as an average of three scans with a 1.0 nm bandwidth interval and a 0.5 nm step interval. CD spectra were analyzed in between 210 and 310 nm, blank corrected with annealing buffer, and smoothed prior to analyses. The raw data were exported into Microsoft Excel and plotted as changes in molar ellipticities (θ) with increasing wavelengths (210–310 nm).
Thermal Denaturation (Tm)
All siRNA hybrids were prepared, as previously described in annealing buffer (1.25 μM, 10 mM Tris, 50 mM NaCl, 1 mM EDTA, pH 7.5–8.0). Thermal denaturation of the siRNA hybrids was performed using a CARY 3E, UV–vis spectrophotometer, from 20 to 80 °C, with temperature ramping of 0.5 °C/min. The changes in absorption at 260 nm as a function of temperature were collected, and the first derivative plot was used to determine the melting temperatures (Tm) of the siRNA samples. The data were transferred and plotted in Microsoft Excel as changes in the hyperchromicities (% H) observed at 260 nm as a function of temperature (20–80 °C).
Fluorescence Emission and Quantum Yield (ϕ) Determination
All siRNA hybrids were prepared as previously described in annealing buffer (1.25 μM, 10 mM Tris, 50 mM NaCl, 1 mM EDTA, pH 7.5–8.0). UV absorbance measurements on a HP 8452A PDA spectrophotometer were initially conducted to determine FL–siRNA absorbances at the wavelengths of excitation, λex: 460 nm and λem: 486 nm. Absorbance readings within the 0.1–0.01 au range were recovered from serial dilution measurements necessary for accurate fluorescence emission measurements. Fluorescence emission and quantum yields were determined on a Horiba Fluorolog spectrophotometer using FluorEssence V3.5 with an excitation of λex: 460 nm and emission window λem: of 470–650 nm.
Cell Culture
The PC-3 (ATCC CRL-1435) prostate cancer cell line was cultured in RPMI-1640 complete growth medium supplemented with 10% (v/v) fetal bovine serum (FBS) and 1% (v/v) penicillin/streptomycin (P/S) under 5% CO2 at 37 °C. For passaging, PC-3 cells were detached with 0.25% trypsin and resuspended with complete culture medium.
siRNA Transfections of PC-3 Cells
PC-3 cells were cultured in RPMI-1640 culture medium supplemented with 10% FBS in a humidified incubator set at 37 °C with 5% CO2. For transfection, 9.0 × 10⁴ cells were plated in 24-well culture plates until 70–80% confluent. The siRNA hybrids (7.5 μL, 10 μM, in Opti-MEM, 133.5 μL) were mixed with the transfection reagent (TransIT-X2 Dynamic Delivery System, 9 μL, in Opti-MEM, 250 μL) according to the manufacture’s recommendation. The mixtures were incubated (15 min, at room temperature), added to the PC-3 cultures, and incubated for 72 h. To determine internalization efficiency of the siRNAs, samples were tested by flow cytometry and fluorescence microscopy.
Flow Cytometry
At selected time points, PC-3 cells were trypsinized and resuspended in RPMI-1640 complete media. Samples were quantified using an FC 500 flow cytometer (Beckman Coulter). Cells were analyzed 2, 4, 8, 24, 48, and 72 h post-transfection. Data were analyzed using Kaluza software (Beckman Coulter).
High Content Screen for Microscopic Evaluation
Time-dependent cell uptake for linear, V-, and Y-shaped siRNAs containing one, two, and three FITC probes was determined using CellInsight CX5 High Content Screening (HCS) Platform (Thermo Fisher Scientific). Cells were visualized 2, 4, 8, 24, 48, and 72 h post-transfection. Images were analyzed using Thermo Scientific HCS Studio Cell Analysis software.
Quantitative Real-Time Polymerase Chain Reaction (qRT-PCR)
Total mRNA was isolated following transfections (48 h) from TriZol (Ambion)-preserved cells using a TriRNA Pure Kit (Geneaid), following the manufacturer’s instructions. The collected mRNA was then quantitated on a Qubit 3.0 fluorimeter using the Qubit Broad Range assay kit (Thermo Fisher Scientific). mRNA (200 ng) was reversed transcribed into cDNA using a high-capacity cDNA kit (Applied Biosystems). RT-PCR was performed using predeveloped TaqMan gene expression primer probes for GRP 78 (assay ID Hs99999174_m1), GRP 94 (assay ID Hs00437665_g1), GRP 75 (Hs00269818_m1), and GAPDH (Hs99999905_m1) and TaqMan fast advanced master mix. qPCR fast assay was carried out on a StepOnePlus (Applied Biosystems). Fold changes were calculated with the ΔΔCt method using GAPDH as endogenous control and the negative siRNA as the control sample.
Western Blot
Total protein was isolated from the cell lysates following transfection (72 h). Protein samples were prepared by lysing the cells in ice-cold radioimmunoprecipitation assay buffer (G-Biosciences) supplemented with protease and phosphatase inhibitors (Millipore Sigma), which were diluted 1:10 as per the manufacturer’s recommendations. Cell debris was removed by centrifugation at 16 000g at 4 °C, and protein concentrations were determined using a PierceTM BCA kit (Thermo Fisher Scientific). A sample (20–35 mg) of the supernatant protein was mixed with lithium dodecyl sulfate buffer and dithiothreitol, incubated at 70 °C for 10 min and resolved on a 4–12% Bis–Tris PAGE gradient gel before being transferred to a poly(vinylidene difluoride) membrane. Following transfer, the membrane was blocked in 5% skim milk for 1 h, washed and incubated at 4 °C overnight with a rabbit primary mAb against human GRP 78, GRP 94, GRP 75, or GAPDH (all purchased from Cell Signaling Technology) at a 1:1000 dilution. The membrane was subsequently washed and incubated with an anti-rabbit horseradish peroxidase-conjugated secondary Ab (Cell Signaling Technology) for 1 h at room temperature at 1:2000 dilution. The bands were visualized using a SignalFire ECL reagent (Cell signaling Technology) on a ProteinSimple FluorChem E imager.
Cell Viability
Cell viability was determined in 24-well plates with PC-3 cells cultured in RPMI-1640 complete growth media and then incubated in the presence or absence of FITC–siRNA (50 μM) for 72 h at 37 °C. After 24, 48, and 72 h, the supernatant was collected, and the remaining cells were removed using trypsin. Cell samples were pelleted and resuspended in 1% bovine serum albumin in phosphate buffered saline (1 mL) and stained using PI according the manufacturer’s recommendation. Samples were quantified using an FC 500 flow cytometer (Beckman Coulter). Data were analyzed with Kaluza (Beckman Coulter) flow analysis software.
Statistical Analysis
All data were plotted and analyzed using the GraphPad Prism software, V 7.0d (La Jolla, CA). Each experiment was performed in triplicates (N = 3). Data are represented as the mean ± standard deviation. Comparisons between two groups were analyzed using unpaired Student’s t-tests. A probability (P) value of less than 0.05 was considered statistically significant.
Acknowledgments
This research was gratefully supported by the University Research Council at Seton Hall University. The authors are also grateful to Dr. Mark Hail and Kevin McCarl at Novatia LLC. who conducted the MS analyses of the RNA samples synthesized in this study.
Supporting Information Available
The Supporting Information is available free of charge on the ACS Publications website at DOI: 10.1021/acsomega.8b01999.
Chemical characterization data of the siRNAs by HPLC, MS, UV–vis, CD, and Tm; fluorescent imaging and cytotoxicity studies for cell investigations (PDF)
Author Contributions
∥ J.Z. and D.S. contributed equally to this work.
The authors declare no competing financial interest.
Notes
⊥ M.R.P. assisted in part of this research work at Seton Hall University. He is currently employed at Nitto Denko Avecia Inc.
Supplementary Material
References
- Agrawal N.; Dasaradhi P. V.; Mohmmed A.; Malhotra P.; Bhatnagar R. K.; Mukherjee S. K. RNA interference: biology, mechanism, and applications. Microbiol. Mol. Biol. Rev. 2003, 67, 657–685. 10.1128/mmbr.67.4.657-685.2003. [DOI] [PMC free article] [PubMed] [Google Scholar]
- Ajith T. A. Strategies used in the clinical trials of gene therapy for cancer. J. Exp. Ther. Oncol. 2017, 11, 33–39. [PubMed] [Google Scholar]
- Bakhtiyari S.; Haghani K.; Basati G.; Karimfar M. H. siRNA therapeutics in the treatment of diseases. Ther. Delivery 2013, 4, 45–57. 10.4155/tde.12.136. [DOI] [PubMed] [Google Scholar]
- Chakraborty C.; Sharma A. R.; Sharma G.; Doss C. G. P.; Lee S. Therapeutic miRNA and siRNA: Moving from Bench to Clinic as Next Generation Medicine. Mol. Ther.--Nucleic Acids 2017, 8, 132–143. 10.1016/j.omtn.2017.06.005. [DOI] [PMC free article] [PubMed] [Google Scholar]
- Adams D.et al. Patisiran, an Investigational RNAi Therapeutic for Patients with Hereditary Transthyretin-Mediated (hATTR) Amyloidosis with Polyneuropathy: Results from the Phase 3 APOLLO study (CT.001). Neurology 2018, 90. [Google Scholar]
- Sumer B.; Gao J. Theranostic nanomedicine for cancer. Nanomedicine 2008, 3, 137–140. 10.2217/17435889.3.2.137. [DOI] [PubMed] [Google Scholar]
- Zhao J.; Mi Y.; Feng S. S. siRNA-based nanomedicine. Nanomedicine 2013, 8, 859–862. 10.2217/nnm.13.73. [DOI] [PubMed] [Google Scholar]
- Liu Y.; Gunda V.; Zhu X.; Xu X.; Wu J.; Askhatova D.; Farokhzad O. C.; Parangi S.; Shi J. Theranostic near-infrared fluorescent nanoplatform for imaging and systemic siRNA delivery to metastatic anaplastic thyroid cancer. Proc. Natl. Acad. Sci. U.S.A. 2016, 113, 7750–7755. 10.1073/pnas.1605841113. [DOI] [PMC free article] [PubMed] [Google Scholar]
- Medarova Z.; Pham W.; Farrar C.; Petkova V.; Moore A. In-vivo imaging of siRNA delivery and silencing in tumors. Nat. Med. 2007, 13, 372–377. 10.1038/nm1486. [DOI] [PubMed] [Google Scholar]
- Bae K. H.; Lee J. Y.; Lee S. H.; Park T. G.; Nam Y. S. Optically traceable solid lipid nanoparticles loaded with siRNA and paclitaxel for synergistic chemotherapy with in situ imaging. Adv. Healthcare Mater. 2013, 2, 576–584. 10.1002/adhm.201200338. [DOI] [PubMed] [Google Scholar]
- Wang Q.; Zhang C.; Shen G.; Liu H.; Fu H.; Cui D. Fluorescent carbon dots as an efficient siRNA nanocarrier for its interference therapy in gastric cancer cells. J. Nanobiotechnol. 2014, 12, 58 10.1186/s12951-014-0058-0. [DOI] [PMC free article] [PubMed] [Google Scholar]
- Mahajan U. M.; Teller S.; Sendler M.; et al. Tumour-specific delivery of siRNA-coupled superparamagnetic iron oxide nanoparticles, targeted against PLK1, stops progression of pancreatic cancer. Gut 2016, 65, 1838–1849. 10.1136/gutjnl-2016-311393. [DOI] [PMC free article] [PubMed] [Google Scholar]
- Ocker M.; Neureiter D.; Lueders M.; Zopf S.; Ganslmayer M.; Hahn E. G.; Herold C.; Schuppan D. Variants of bcl-2 specific siRNA for silencing antiapoptotic bcl-2 in pancreatic cancer. Gut 2005, 54, 1298–1308. 10.1136/gut.2004.056192. [DOI] [PMC free article] [PubMed] [Google Scholar]
- Chang E.; Zhu M. Q.; Drezek R. Novel siRNA-based molecular beacons for dual imaging and therapy. Biotechnol. J. 2007, 2, 422–425. 10.1002/biot.200600257. [DOI] [PubMed] [Google Scholar]
- Paganin-Gioanni A.; Bellard E.; Escoffre J. M.; Rols M. P.; Teissié J.; Golzio M. Direct visualization at the single-cell level of siRNA electrotransfer into cancer cells. Proc. Natl. Acad. Sci. U.S.A. 2011, 108, 10443–10447. 10.1073/pnas.1103519108. [DOI] [PMC free article] [PubMed] [Google Scholar]
- Chiu Y. L.; Ali A.; Chu C. Y.; Cao H.; Rana T. M. Visualizing a Correlation between siRNA Localization, Cellular Uptake, and RNAi in Living Cells. Chem. Biol. 2004, 11, 1165–1175. 10.1016/j.chembiol.2004.06.006. [DOI] [PubMed] [Google Scholar]
- Maina A.; Blackman B. A.; Parronchi C. J.; Morozko E.; Bender M. E.; Blake A. D.; Sabatino D. Solid-phase synthesis, characterization and RNAi activity of branch and hyperbranch siRNAs. Bioorg. Med. Chem. Lett. 2013, 23, 5270–5274. 10.1016/j.bmcl.2013.08.033. [DOI] [PubMed] [Google Scholar]
- Patel M. R.; Kozuch S. D.; Cultrara C. N.; Yadav R.; Huang S.; Samuni U.; Koren J.; Chiosis G.; Sabatino D. RNAi Screening of the glucose-regulated chaperones in cancer with self-assembled siRNA nanostructures. Nano Lett. 2016, 16, 6099–6108. 10.1021/acs.nanolett.6b02274. [DOI] [PMC free article] [PubMed] [Google Scholar]
- Lee A. S. Glucose-regulated proteins in cancer: molecular mechanisms and therapeutic potential. Nat. Rev. Cancer 2014, 14, 263–276. 10.1038/nrc3701. [DOI] [PMC free article] [PubMed] [Google Scholar]
- Shin B. K.; Wang H.; Yim A. M.; Le Naour F.; Brichory F.; Jang J. H.; Zhao R.; Puravs E.; Tra J.; Michael C. W.; et al. Global profiling of the cell surface proteome of cancer cells uncovers an abundance of proteins with chaperone function. J. Biol. Chem. 2003, 278, 7607–7616. 10.1074/jbc.M210455200. [DOI] [PubMed] [Google Scholar]
- Zhai L.; Kita K.; Wano C.; Wu Y.; Sugaya S.; Suzuki N. Decreased cell survival and DNA repair capacity after UVC irradiation in association with down-regulation of GRP78/BiP in human RSa cells. Exp. Cell Res. 2005, 305, 244–252. 10.1016/j.yexcr.2005.01.002. [DOI] [PubMed] [Google Scholar]
- Ray M. S.; Moskovich O.; Iosefson O.; Fishelson Z. Mortalin/GRP75 Binds to Complement C9 and Plays a Role in Resistance to Complement-dependent Cytotoxicity. J. Biol. Chem. 2014, 289, 15014–15022. 10.1074/jbc.M114.552406. [DOI] [PMC free article] [PubMed] [Google Scholar]
- Crowley V. M.; Khandelwal A.; Mishra S.; Stothert A. R.; Huard D. J.; Zhao J.; Muth A.; Duerfeldt A. S.; Kizziah J. L.; Lieberman R. L.; et al. Development of Glucose Regulated Protein 94-Selective Inhibitors Based on the BnIm and Radamide Scaffold. J. Med. Chem. 2016, 59, 3471–3488. 10.1021/acs.jmedchem.6b00085. [DOI] [PMC free article] [PubMed] [Google Scholar]
- Delie F.; Ribaux P.; Petignat P.; Cohen M. Anti-KDEL-coated nanoparticles: A promising tumor targeting approach for ovarian cancer?. Biochimie 2012, 94, 2391–2397. 10.1016/j.biochi.2012.06.010. [DOI] [PubMed] [Google Scholar]
- Suzuki T.; Lu J.; Zahed M.; Kita K.; Suzuki N. Reduction of GRP78 expression with siRNA activates unfolded protein response leading to apoptosis in HeLa cells. Arch. Biochem. Biophys. 2007, 468, 1–14. 10.1016/j.abb.2007.09.004. [DOI] [PubMed] [Google Scholar]
- Murakami A.; Nakaura M.; Nakatsuji Y.; Nagahara S.; Tran-Cong Q.; Makino K. Fluorescent-labeled oligonucleotide probes: detection of hybrid formation in solution by fluorescence polarization spectroscopy. Nucleic Acids Res. 1991, 19, 4097–4102. 10.1093/nar/19.15.4097. [DOI] [PMC free article] [PubMed] [Google Scholar]
- Pham J. W.; Sontheimer E. J. Molecular Requirements for RNA-induced Silencing Complex Assembly in the Drosophila RNA Interference Pathway. J. Biol. Chem. 2005, 280, 39278–39283. 10.1074/jbc.M509202200. [DOI] [PubMed] [Google Scholar]
- Chiu Y. L.; Rana T. M. siRNA function in RNAi: A chemical modification analysis. RNA 2003, 9, 1034–1048. 10.1261/rna.5103703. [DOI] [PMC free article] [PubMed] [Google Scholar]
- Gray D. M.; Hung S. H.; Johnson K. H. Absorption and circular dichroism spectroscopy of nucleic acid duplexes and triplexes. Methods Enzymol. 1995, 246, 19–34. 10.1016/0076-6879(95)46005-5. [DOI] [PubMed] [Google Scholar]
- Hwang G. T. Single-Labeled Oligonucleotides Showing Fluorescence Changes upon Hybridization with Target Nucleic Acids. Molecules 2018, 23, 124 10.3390/molecules23010124. [DOI] [PMC free article] [PubMed] [Google Scholar]
- Sjöback R.; Nygren J.; Kubista M. Characterization of fluorescein–oligonucleotide conjugates and measurement of local electrostatic potential. Biopolymers 1998, 46, 445–453. . [DOI] [PubMed] [Google Scholar]
- Misra U. K.; Payne S.; Pizzo S. V. Ligation of Prostate Cancer Cell Surface GRP78 Activates a Proproliferative and Antiapoptotic Feedback Loop. J. Biol. Chem. 2011, 286, 1248–1259. 10.1074/jbc.M110.129767. [DOI] [PMC free article] [PubMed] [Google Scholar]
- Cheng Z.; Teo G.; Krueger S.; Rock T. M.; Koh H. W.; Choi H.; Vogel C. Differential dynamics of the mammalian mRNA and protein expression response to misfolding stress. Mol. Syst. Biol. 2016, 12, 855. 10.15252/msb.20156423. [DOI] [PMC free article] [PubMed] [Google Scholar]
- Lecoeur H. Nuclear Apoptosis Detection by Flow Cytometry: Influence of Endogenous Endonucleases. Exp. Cell Res. 2002, 277, 1–14. 10.1006/excr.2002.5537. [DOI] [PubMed] [Google Scholar]
Associated Data
This section collects any data citations, data availability statements, or supplementary materials included in this article.


