Abstract
Pure TiO2 and Cu-doped TiO2 nanoparticles are synthesized by the biomediated green approach using the Bengal gram bean extract. The extract containing biomolecules acts as capping agent, which helps to control the size of nanoparticles and inhibit the agglomeration of particles. Copper is doped in TiO2 to enhance the electronic conductivity of TiO2 and its electrochemical performance. The Cu-doped TiO2 nanoparticle-based anode shows high specific capacitance, good cycling stability, and rate capability performance for its envisaged application in lithium-ion battery. Among pure TiO2, 3% Cu-doped TiO2, and 7% Cu-doped TiO2 anode, the latter shows the highest capacity of 250 mAh g–1 (97.6% capacity retention) after 100 cycles and more than 99% of coulombic efficiency at 0.5 A g–1 current density. The improved electrochemical performance in the 7% Cu-doped TiO2 is attributed to the synergetic effect between copper and titania. The results reveal that Cu-doped TiO2 nanoparticles might be contributing to the enhanced electronic conductivity, providing an efficient pathway for fast electron transfer.
Introduction
Renewable energy sources such as solar, wind, hydropower, and geothermal energies are among the green alternative energy source options to the natural energy sources (coal, oil, natural gas, etc.). Furthermore, these renewable energy sources are carbon-free and contribute to decrease the global warming issues. However, these energy sources suffer from the limitation of generating continuous energy because these often rely on weather for generation of power. So, in such conditions, energy-storage devices play an important role to store the generated energy from the renewable energy sources when available, and it can be used as per requirement. Besides this, storage devices are used as a source of energy in portable devices and hybrid electric vehicles, which contribute to reducing greenhouse (CO2) gases and environmental pollution. Considering the urgency and need for preferably solid-state storage devices, researchers developed different energy-storage devices such as lithium-ion battery (LIB),1 supercapacitor,2,3 Ni-MH battery,4 etc. Among these energy-storage devices, lithium-ion battery (LIB) is a promising candidate due to its high power density, long-term life, and environmentally benign nature.1,5−7 However, the key factor affecting the performance of LIBs is the anode material. Recent reports show that natural graphite is commonly used as the anode material in commercial LIBs due to its credibility and low operating voltage (<0.2 V vs Li+/Li). The diffusion rate of lithium into carbon materials is between 10–12 and 10–6 cm2 s–1 at a low operating voltage (<0.2 V vs Li+/Li) and hence the possibility of formation of solid electrolyte interface (SEI) layer at low voltage is more. Interestingly, for graphite, it is between 10–9 and 10–7 cm2 s–1 and demonstrates high volume expansion (∼10%), which results in batteries with low power density. Thus, there is dire need to develop alternative high-operating-voltage electrode materials, which would circumvent these limitations, particularly for large battery development.8,9 As a result, the researchers have focused their attention on the development of different kinds of intercalation- and deintercalation-based electrode materials, such as graphite, carbon, Li4TiO2, and TiO2.10−12 Several transition-metal oxide materials have been explored as alternative anode material to graphitic carbon.13−15 Among them, TiO2 is an ideal anode material for LIBs, due to its low cost, nontoxicity, high capacity, long cycle life, and very low volume change (∼4%) during Li+ intercalation/deintercalation. Besides, another intriguing incentive is the higher operating voltage of TiO2 (>1.5 V vs Li+/Li) than the graphite anode, which could effectively stop the formation of Li dendrites and lithium electroplating.16 Even though TiO2-based materials possess many advantages, they still encounter a big challenge of poor reversibility during charge–discharge, poor rate capability, poor electronic conductivity (10–12–10–7 S cm–1), and poor ionic conductivity, which lead to poor electrochemical performance, thereby hampering its practical applications.17−19
One of the most commonly used strategies is to design TiO2-based composites with conducting carbon materials (graphene, CNTs, etc.); however, introducing a large quantity of carbon reduces the capacity of electrode material. Thus, strategies to develop new methodologies and materials to improve the electronic conductivity are the need of time. Recent literature reports reveal that metal doping exhibits considerable advantages to alter the intrinsic conductivity and rate capability of anode material (metal oxides).20−25 It is reported that the doping of metal ion can improve the conductivity of transition-metal oxides (TiO2, Li4Ti5O12–TiO2, and MnO2). Zhang et al.18 synthesized Cu-doped TiO2 nanowires demonstrating enhanced conductivity and electrochemical kinetic properties via decreasing the band gap of TiO2 nanowires. Chen et al.10 synthesized Cu-doped dual-phase Li4Ti5O12–TiO2 exhibiting enhanced capacity, cycle performance, and rate capability. Li et al.26 synthesized Cu-doped MnO2 nanoparticles with improved electronic conductivity and lithium diffusivity in electrodes. Therefore, it is realized that Cu doping can improve the capacity, cycle performance, and rate capability of transition-metal oxides, which is attributed to the narrowing of the band gap and enhancing electronic conductivity. With this motivation, in this work, we have synthesized Cu-doped TiO2 nanoparticles by using our previously reported biogreen method, which is simple, economic, and scalable.
In the typical process, Cu-doped TiO2 nanoparticles are synthesized by a facile, cost-effective, scalable, and eco-friendly approach using remnant water (ideally kitchen waste) collected from soaked Bengal gram beans (Cicer arietinum L.). The gram bean extract containing pectin biomolecules are responsible for the synthesis of Cu-doped TiO2 nanoparticles. Pectin is a complex polysaccharide that is present in most primary cell walls and it acts as a capping agent and hinders the aggregation. Interestingly, when a Cu-doped TiO2 nanoparticle-based thin film is used as an anode material for LIBs, it demonstrates the high capacity and excellent rate capability compared to pure TiO2. This improvement can be due to the decrease in the band gap, which helps to enhance the electronic conductivity of TiO2. The effect of Cu doping concentration (3 and 7 wt % Cu-doped TiO2) is also studied. The results indicate that Cu-doped TiO2 is a promising anode material for high-performance LIBs.
Results and Discussion
X-ray Diffraction (XRD) Pattern
Confirmation of phase composition, crystal structure, and crystallite size of the synthesized (a) pure TiO2, (b) 3 wt % Cu-doped TiO2, and (c) 7 wt % Cu-doped TiO2 nanoparticles is carried out using powder XRD, and the results are shown in Figure 1. The XRD spectra of the samples showed well-defined diffraction peaks, which could be indexed to the anatase phase of TiO2 (JCPDS card No. 71-1168) belonging to the tetragonal structure with space group I41/amd (141).27 The peaks in pure TiO2 are attributed to the reflection from (101), (004), (200), (105), (211), (204), (116), (220), and (215) planes of the anatase phase (Figure 1a). XRD spectra of Cu-doped TiO2 nanoparticles are shown in Figure 1b,c with characteristic peaks originating from a pure TiO2 sample representing the tetragonal anatase phase of TiO2. No obvious peaks corresponding to Cu or any copper oxide phases are observed in the diffraction spectra of Cu-doped TiO2. This does not mean that Cu-associated phases in the system are absent, but probably the diffraction from TiO2 surface is more intense compared to the Cu-oxide reflected rays (covered by TiO2), resulting in the Cu-oxide’s peak intensity ratio being less compared to that of TiO2. The (200) diffraction peak shifts slightly to lower 2θ values in the Cu-doped TiO2 (inset in Figure 1).28Figure 1 clearly shows that the intensity of Cu-doped TiO2 peaks is higher compared to pure TiO2, which indicates that Cu-doping enhances the crystallinity and improves the structural quality of TiO2. The crystallite sizes of pure TiO2, 3% Cu-doped TiO2, and 7% Cu-doped TiO2 were calculated with reference to (101) peak at 2θ = 24.9 and found to be ∼10, 14, and 11 nm, respectively.
Figure 1.
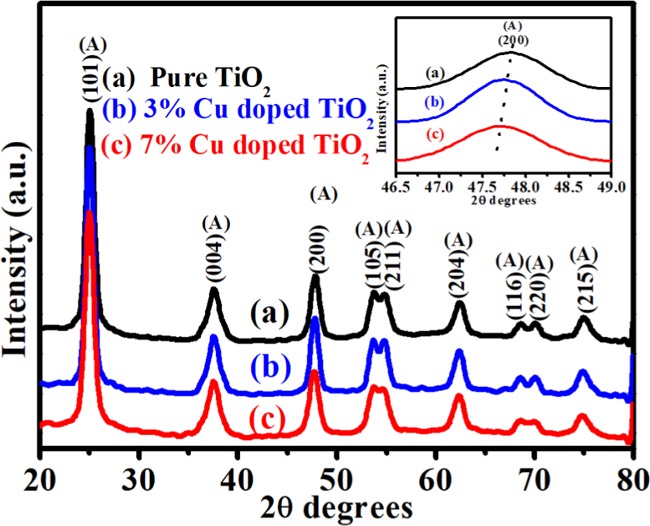
Representative X-ray diffraction pattern of biosynthesized (a) pure TiO2, (b) 3% Cu-doped TiO2, and (c) 7% Cu-doped TiO2.
Figure S1a–c shows the Rietveld refinement plot of pure and Cu-doped TiO2 nanoparticles. The lattice parameter (a, b, and c) values of Cu-doped TiO2 nanoparticles reveal a minor increase in the ″a″ lattice parameter and minor decrease in the ″c″ lattice parameters compared to the pure TiO2 (results tabulated in Table S1).29 The result indicates that the Cu dopants are adequately incorporated in the TiO2 lattice expanding the unit cell volume compared to the pure TiO2 cell volume (Table S1).
Raman Spectroscopy
Raman spectroscopy is a simple and important technique for confirmation of structural phase of pure and Cu-doped TiO2 nanoparticles, and the results are shown in Figure 2. For all of the samples, the Raman spectra show six Raman-active modes (Eg, Eg, B1g, B1g + A1g, and Eg), which indicates that the anatase phase of TiO2 is predominant.30,31 The Raman peaks were observed at 146, 199, 397, 516, and 642 cm–1 for pure TiO2 and Cu-doped TiO2 nanoparticles, illustrating a similar Raman peak pattern to the anatase phase of TiO2, and it is in agreement with the reported literature.32,33 Furthermore, no extra peak associated with copper oxide is observed even at a higher concentration of Cu-doped TiO2 nanoparticles. It means that Raman spectroscopy data is in good agreement with the XRD results. Moreover, Cu-doped TiO2 nanoparticles retain the anatase structure, which indicates that the Cu cations are incorporated into the TiO2 framework. Interestingly, it has been observed that the Raman peak at 146 cm–1 (inset in Figure 2) tends to shift to a higher wavenumber with an increase in Cu dopant. Generally, it has been accepted that the shifts in the Raman peak occur due to the change in bond polarizability and strength of the Ti–O bond upon Cu doping. These changes in bond strength are clearly observed in the Rietveld refinement results (Figure S1).30
Figure 2.
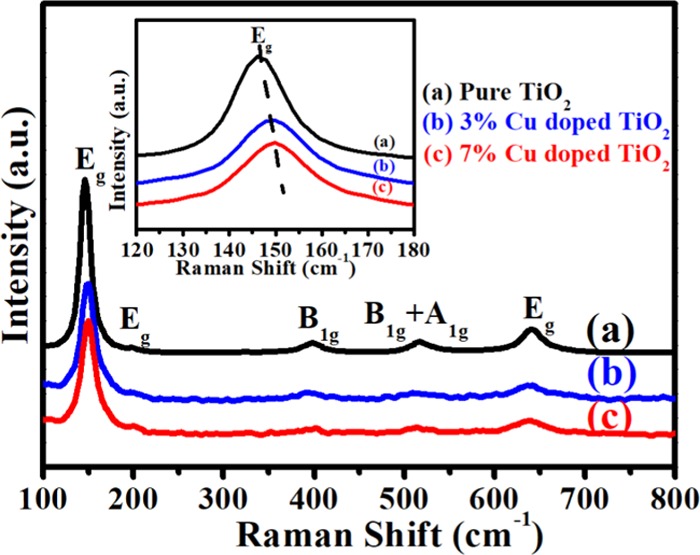
Representative Raman spectra of biosynthesized (a) pure TiO2, (b) 3% Cu-doped TiO2, and (c) 7% Cu-doped TiO2.
X-ray Photoelectron Spectroscopy (XPS)
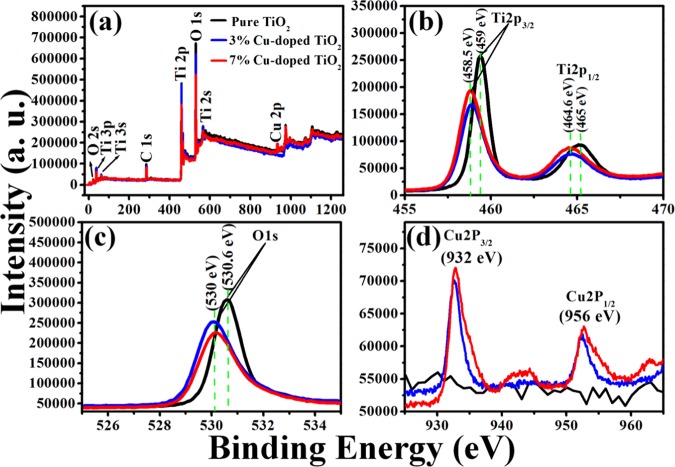
XPS is a crucial analysis technique to determine the elemental composition of a substance and their oxidation states.30,34Figure 3a shows XPS survey spectra of pure TiO2 and Cu-doped TiO2. In the survey spectra of pure TiO2, 3% Cu-doped TiO2, and 7% Cu-doped TiO2 spectra, four common XPS peaks at around 284–286, 258–260, 464–466, and 529–531 eV are observed, which are characteristic of C 1s, Ti 2P3/2, Ti 2P3/1, and O 1s, respectively. However, in the case of Cu-doped TiO2 samples, the XPS images showed two extra peaks at around 931–953 eV (apart from the four common peaks), which are characteristic of Cu 2P (Cu 2P3/2 and Cu 2P2/1) supporting the fact that copper is successfully doped in TiO2.3535 XPS images revealing the characteristic peaks of individual elements were also recorded as shown in Figure 3. The XPS image characteristic of Ti shows two peaks (Figure 3b) at ∼459 (Ti 2p3/2) and 465 eV (Ti 2P1/2) (pure TiO2), which suggests that Ti exists in Ti(IV) state, which is in good agreement with the literature report. But in the case of Cu-doped TiO2 (Figure 3b), these peaks shift slightly downward at ∼458.5 and 464.6 eV, which suggest the substitution of Ti(IV) by Cu1+ ions. The XPS image characteristic of O in pure TiO2 shows a peak at 530.6 eV (O 1s) (Figure 3c), which is in good agreement with the literature report. On the other hand, in the case of Cu-doped TiO2, it is observed to have shifted to 530 eV. This can be attributed to the formation of oxygen vacancies after Cu doping in TiO2. Furthermore, in the case of Cu-doped TiO2, the XPS images revealed two additional peaks at 932 and 952 eV, which could be assigned to Cu 2P3/2 and Cu 2P2/1, respectively (Figure 3d), and could be attributed to the characteristic peaks of Cu2O. This observation was in good agreement with the literature report36,37 and revealed that the doped Cu in TiO2 is in Cu(I) oxidation state.
Figure 3.
Representative XPS (a) survey spectra and characteristic high-resolution XPS images of (b) Ti, (c) O, and (d) Cu recorded from pure TiO2 (black curve), 3% Cu-doped TiO2 (blue curve), and 7% Cu-doped TiO2 (red curve).
Scanning Electron Microscopy (SEM)
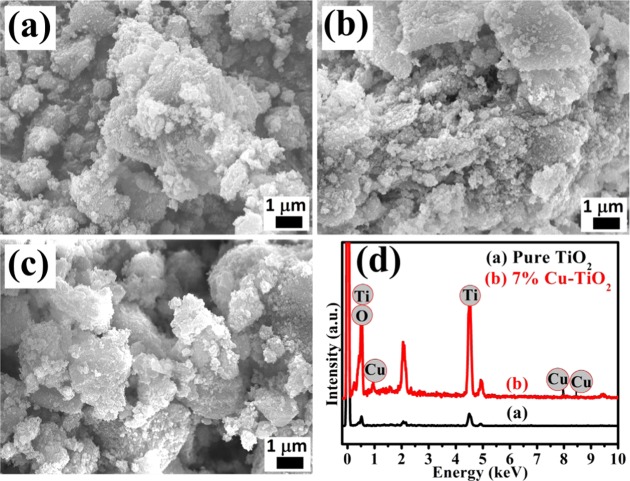
The surface morphology and elemental analysis of the biosynthesized pure and Cu-doped TiO2 nanoparticles are also examined by SEM and energy-dispersive X-ray (EDX) pattern, and the results are shown in Figure 4. The micrographs of (a) pure TiO2, (b) 3% Cu-doped TiO2, and (c) 7% Cu-doped TiO2 nanoparticles calcined at 400 °C are shown in Figure 4a–c, which demonstrate the uniform spherical-shaped nanoparticles with narrow size distribution. No major change in the morphology of the Cu-doped TiO2 nanoparticles is observed compared to pure TiO2. Furthermore, representative EDX patterns of pure TiO2 and 7% Cu-doped TiO2 nanoparticles were recorded to investigate the elemental composition, and the results are shown in Figure 4d. The EDX pattern of pure TiO2 (Figure 4d) clearly shows the exclusive presence of Ti and O element, which confirms the absence of impurities in the pure TiO2 nanoparticles. Similarly, the 7% Cu-doped TiO2 (Figure 4d) shows the presence of Cu, Ti, and O elements, confirming the successful incorporation of copper ion in TiO2.
Figure 4.
Representative SEM images of biosynthesized (a) pure TiO2, (b) 3% Cu-doped TiO2, and (c) 7% Cu-doped TiO2. (d) Representative EDX pattern of pure TiO2 and 7% Cu-doped TiO2.
Transmission Electron Microscopy (TEM)
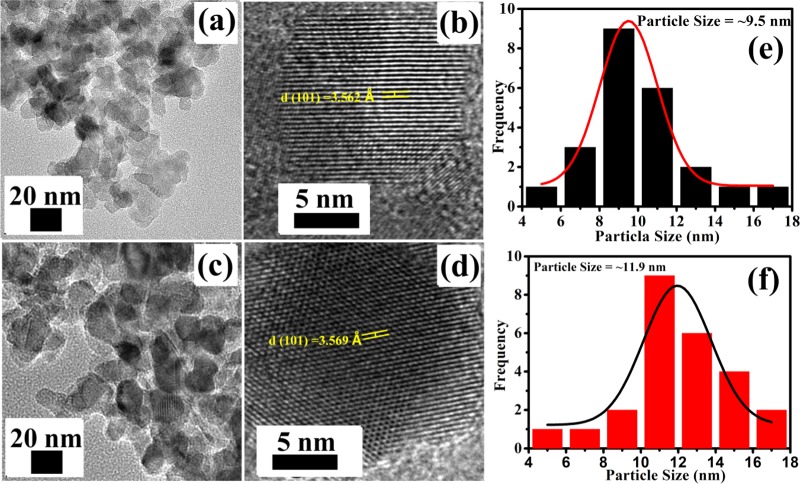
TEM is an advanced analysis technique to determine the morphology and crystallite size of the nanoparticles. TEM images of pure and 7% Cu-doped TiO2 nanoparticles are shown in Figure 5, which clearly show the uniform distribution of spherical-shaped nanoparticles (Figure 5a,c). High-resolution TEM (HR-TEM) images of pure and 7% Cu-doped TiO2 nanoparticles (Figure 5b,d) demonstrate well-defined fringes, indicating the crystalline nature of the samples. The interspacing distance between the fringes are 3.562 and 3.569 Å for pure TiO2 and 7% Cu-doped TiO2, respectively. The interspacing distance is slightly higher in 7% Cu-doped TiO2 compared to pure TiO2, which is attributed to the successful doping of Cu in TiO2. In addition, Figure 5e,f exhibits the particle size distribution histogram of pure and 7% Cu-doped TiO2, which clearly shows that the average crystallite size of Cu-doped TiO2 (∼11.9 nm) is greater than that of pure TiO2 (∼9.5 nm) due to the large ionic radius of copper. The role of gram bean extract in controlling the agglomeration and particle size is elucidated from the TEM images and particle size distribution histograms recorded from TiO2 nanoparticles prepared without and with gram bean extract (Figure S2).
Figure 5.
Representative TEM and HR-TEM images of biosynthesized (a, b) pure TiO2, (c, d ) 7% Cu-doped TiO2. Particle size distribution histograms of (e) pure-TiO2 and (f) 7% Cu-doped TiO2.
Electrochemical Characterization
Electrochemical performances were investigated to understand the Cu-doping effects on the TiO2 structure by galvanostatic analysis using TiO2/Li half-cell configuration in the voltage window of 0.01–3 V at ambient temperature for LIB application.
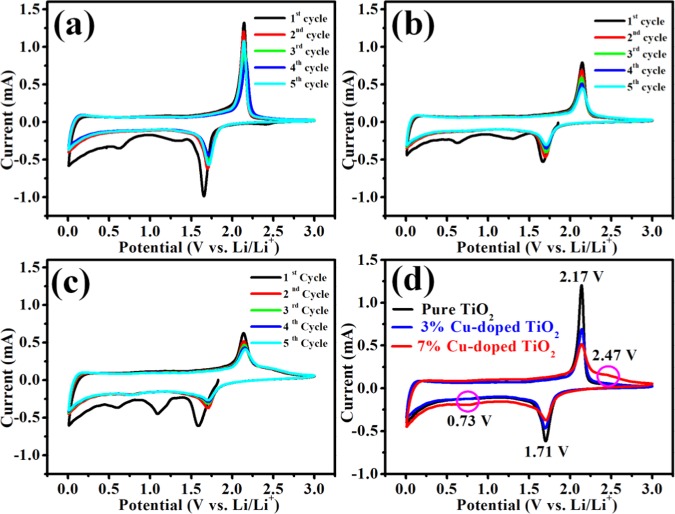
Cyclic voltammetry (CV) profiles of pure TiO2, 3% Cu-doped TiO2, and 7% Cu-doped TiO2 nanoparticles are carried out at a scan rate of 0.3 mV s–1 in a potential range of 0.01–3 V to explore the lithium insertion/extraction behavior. The initial five successive CV curves of the pure TiO2, 3% Cu-doped TiO2, and 7% Cu-doped TiO2 nanoparticles are shown in Figure 6a–c. Figure 6a–c displays the location of the first cathodic CV peaks (∼1.66 V), which is different from those in the following four cycles. Besides this, in the first discharge CV curve, two extra peaks are observed in the potential range 0.5–1.5 V (vs Li/Li+) and these two extra peaks (∼0.62 V and in between 1.3 and 1.7 V) disappear in the next four CV curves. It means that the specific current of the first CV curve is high compared to the subsequent CV curves. It is attributed to the formation of solid electrolyte interface (SEI) layer.38−40 In Figure 6a–c, a pair of cathodic and anodic intense peaks remain after the first CV curve at about 1.71 and 2.14 V versus Li/Li+. These two peaks correspond to the Li-ion insertion into and extraction from the interstitial octahedral site of TiO2, respectively. The sharp oxidation/reduction peaks reveal the two-phase reaction process, showing the coexistence of Li-poor Li0.01TiO2 (tetragonal) and Li-rich Li0.55TiO2 (orthorhombic) phase.
| 1 |
The comparative CV curves of the second cycles of all three anode materials are shown in Figure 6d. In the case of Cu-doped TiO2 with sharp and intense oxidative and reductive peaks along with two broad and less intense peaks also appear in subsequent cycles. The cathodic peak at 0.73 V is attributed to the transformation of Cu2O into Cu particles and Li2O, and the anodic peak at 2.47 V is attributed to the formation of Cu2O.41−43 It is observed that the peak intensity increases with the doping concentration of copper. The overall electrochemical reaction for copper oxide can be described as follows:43,44
| 2 |
Figure 6d shows the comparison of second CV curves of all samples, which clearly show that the intensity of oxidation (2.17 V) and reduction (1.71 V) peak decreases with increase in Cu-doping concentration. This observation indicates improved wetting and enhanced Li-ion insertion kinetics with an increase in doping concentration of copper. Interestingly, the shift is observed in 7% Cu-doped TiO2, which means that the Li-ion insertion kinetics is higher in 7% Cu-doped TiO2 compared to the pure TiO2 and 3% Cu-doped TiO2.40,44,4540,44,45 The increase of Li-ion insertion kinetics and wettability of copper-doped TiO2 electrode material is due to the decrease in band gap with an increase in Cu-doping concentration and the synergistic effect of copper and titania.46,47
Figure 6.
Cyclic voltammograms for the first to fifth cycles for the TiO2 nanopowder in the potential range of 0.01–3 V vs Li/Li+ for an applied scan rate of 0.3 mV s–1 for (a) pure TiO2, (b) 3% Cu-doped TiO2, and (c) 7% Cu-doped TiO2 and (d) comparative cyclic voltammogram curves of the second cycle of each electrode material.
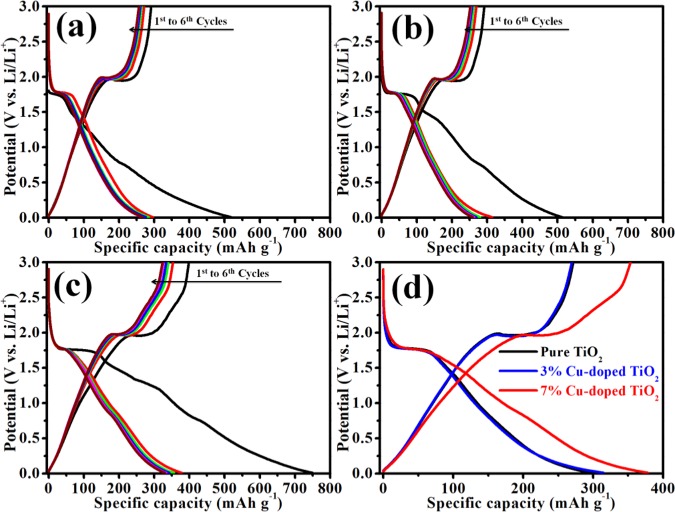
Figure 7 displays the first six galvanostatic charge–discharge profiles of pure TiO2, 3% Cu-doped TiO2, and 7% Cu-doped TiO2 cell at the current rate of 0.05 A g–1 in the potential window 0.01–3 V. With all of the three electrodes, three potential plateaus are observed in the voltage regions of 1.6–1.8, 1.0–1.4, and 0.6–0.8 V for the first discharge cycle, while the first charge cycle shows only one sloping line or potential plateau at about ∼2.1 V. So, the charge–discharge profiles of all sample are in good agreement with the first CV curves, as shown in Figure 7a–c.
Figure 7.
Charge–discharge cycles for (a) pure TiO2, (b) 3% Cu-doped TiO2, and (c) 7% Cu-doped TiO2. (d) Comparative charge–discharge curves of the second cycle for all nanopowder materials in the potential range of 0.01–3 V vs Li/Li+ for an applied scan rate of 0.05 A g–1.
Pure TiO2, 3% Cu-doped TiO2, and 7% Cu-doped TiO2 show initial irreversible capacities of 514, 517, and 748 mAh g–1, respectively. From the above results, it is clear that the irreversible capacity values of the first discharge–charge cycle increase with an increase in Cu concentration, which means that the intercalated Li ions are not completely deintercalated, which is attributed to the formation of SEI layer. This is commonly observed for the first cycle in all electrode materials. The subsequent cycles show low irreversible capacity, as shown in Figure 7a–c and Table S3. A comparison of the second charge–discharge cycle of each electrode is shown in Figure 7d, which clearly shows that the second discharge capacities for pure TiO2, 3% Cu-doped TiO2, and 7% Cu-doped TiO2 are 296, 314, and 378 mAh g–1, respectively. Interestingly, the second charge cycle of 7% Cu-doped TiO2 shows 353 mAh g–1 charge capacity, which is higher than the theoretical capacity of TiO2 (335 mAh g–1). This may be attributed to increased conductivity of electrode material by the Cu doping.41,48 From Figure 7 and Table S3, it is clear that the Cu-doped TiO2 shows better electrochemical performance compared to the pure TiO2 nanoparticles, revealing that copper contributes to the improved electronic conductivity of TiO2 and synergetic effect of Cu and TiO2.
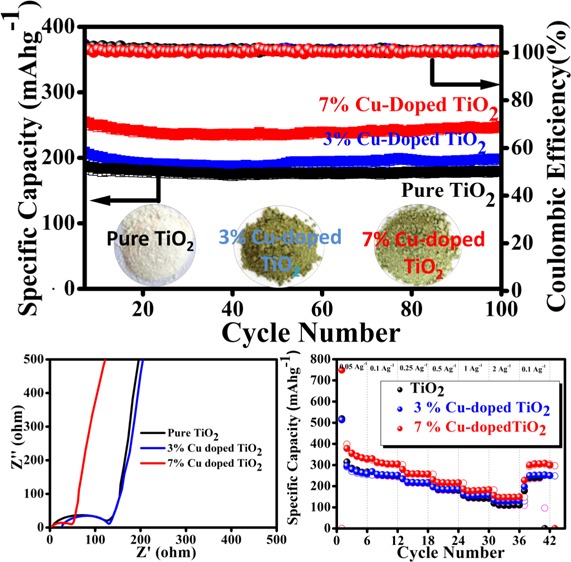
Influence of Cu-doping on electrochemical performance was investigated by cycle stability and rate capability performance, and the results are shown in Figure 8a,b, respectively. The cycling stability (Figure 8a) of each cell is investigated up to 100 cycles at the current density of 0.5 A g–1 in the potential window 0.01–3 V. From the cycle stability data, it is clear that the specific capacity value of TiO2 increases with percentage increase of Cu doping. Interestingly, the 7% Cu-doped TiO2 cell shows a high specific capacity of 250 mAh g–1, which is higher than that of pure TiO2 (180 mAh g–1) and 3% Cu-doped (198 mAh g–1). After 100 cycles, it exhibits 97.6% capacity retention because of the increase in the conductivity of the electrode material due to the doping of Cu in TiO2.
Figure 8.
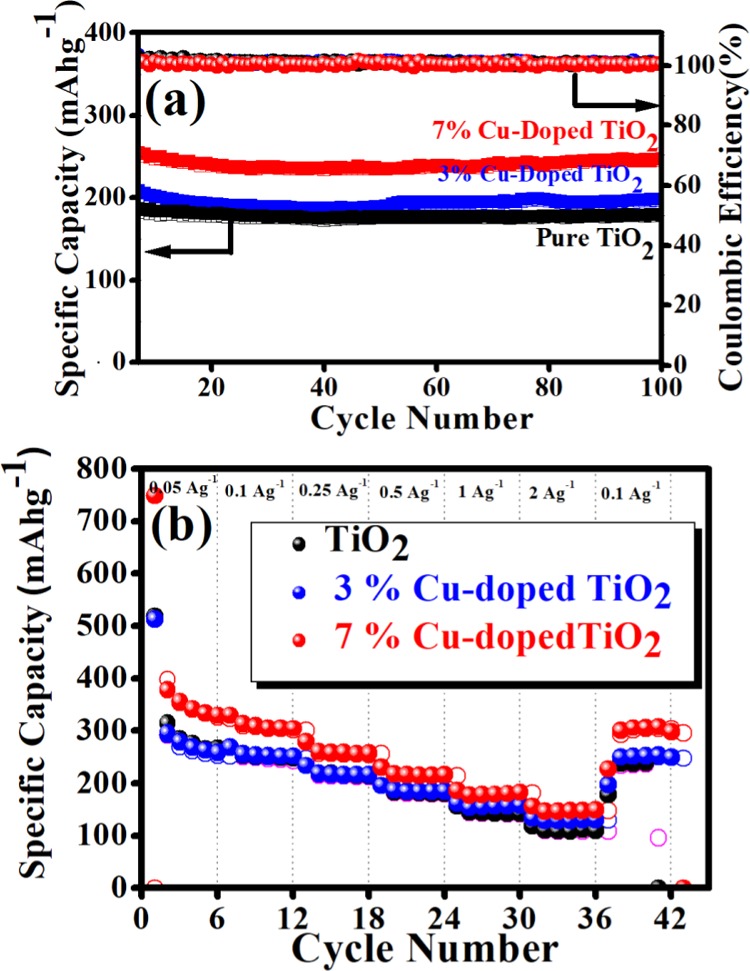
(a) Cycle stabilities of pure TiO2, 3% Cu-doped TiO2, and 7% Cu-doped TiO2 at 0.5 A g–1 current density. (b) Rate performance of pure TiO2, 3% Cu-doped TiO2, and 7% Cu-doped TiO2 at different current densities.
The rate performances of pure TiO2 and copper-doped TiO2 at different current rates ranging from 0.05 to 2 A g–1 are investigated as shown in Figure 8b. It is observed that each cell shows good rate capability, but exceptionally fading in initial few cycles (at current rate 0.05 A g–1), which is attributed to the loss of symmetry during phase transition accompanied by a decrease in the unit cell along the c axis. Furthermore, the subsequent increase of unit cell volume (∼4%) along the b direction results in capacity fading.49 Among them, 7% Cu-doped TiO2 shows high specific capacity at each current density compared to pure TiO2 and 3% Cu-doped TiO2. It delivers reversible specific capacities of 378, 330, 279, 230, 186, and 157 mAh g–1 at 0.05, 0.1, 0.25, 0.5, 1, and 2 A g–1 of current density, respectively. It is clearly observed that even at the high current density (2 A g–1) it shows 157 mAh g–1 of specific capacity, much higher than pure TiO2 and 3% Cu-doped TiO2 electrodes (119 and 134 mAh g–1, respectively) (details of rate capability data are given in Table S4). Interestingly, when the current density returns after 2 A g–1 to the current density of 0.1 A g–1, it shows a discharge capacity of 299 mAh g–1 after 42 cycles and recovers 90% of capacity retention from the initial cycle at 0.1 A g–1, indicating very good rate capability of the material.
Furthermore, to study the electrochemical kinetics of synthesized pure TiO2, 3% Cu-doped TiO2, and 7% Cu-doped TiO2, electrochemical impedance spectroscopy (EIS) study is performed. It is used to examine the activity occurring at the electrode/electrolyte interfaces and Li-ion intercalation/deintercalation within electrode materials in the battery cells. Figure 9 shows the Nyquist plots of pure TiO2, 3% Cu-doped TiO2, and 7% Cu-doped TiO2. Each Nyquist plot is composed of the compressed semicircle (in the high- to medium-frequency region) and a Warburg impedance (Zw) straight line (in the low-frequency region) corresponding to the charge-transfer resistance (Rct) between the electrolyte and the electrode and Li+ ion diffusion in the electrode material. From the Nyquist plot, the Rct values (diameters of the semicircle) for pure TiO2, 3% Cu-doped TiO2, and 7% Cu-doped TiO2 are 117, 109, and 48.35 Ω, respectively. Among them, the 7% Cu-doped TiO2 electrode material showed the lowest Rct value compared to the other electrode material, which indicates that the electrode (7% Cu-doped TiO2) facilitates easy and fast electronic transportation enhancing the conductivity. The results indicate an enhancement in the Li+ ion diffusion in the Cu-doped TiO2 electrode.
Figure 9.
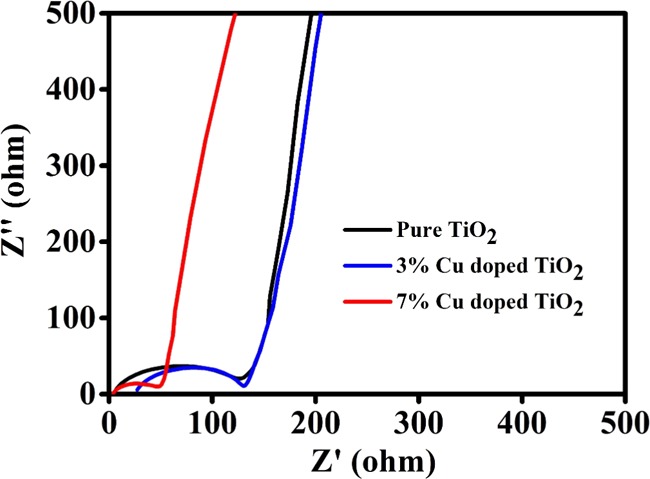
Electrochemical impedance spectra (EIS) of pure TiO2, 3% Cu-doped TiO2, and 7% Cu-doped TiO2.
Conclusions
In summary, we have successfully synthesized the copper-doped TiO2 nanoparticles employing a biomediated green approach using the Bengal gram bean extract. The synthesized electrode materials are explored as an anode for lithium-ion battery application. The Cu-doped TiO2 anodes show better charging–discharging capacity than the pure TiO2 anode, which is due to the enhanced conductivity and synergistic effect of the individual components (Cu and TiO2). Interestingly, among the explored TiO2 electrode, the 7% Cu-doped TiO2 cell shows a higher specific capacity compared to pure TiO2 and 3% Cu-doped TiO2 cells. Besides, the 7% Cu-doped TiO2 anode shows higher than 99% coulombic efficiency after 100 cycles compared to pure TiO2 and 3% Cu-doped TiO2 at the 0.5 A g–1 current rate. Apart from this, the 7% Cu-doped TiO2 anode shows better specific capacitance, cycling stability, and rate capability performance, which is attributed to the contribution of doped copper reducing the charge-transfer resistance (Rct) between the electrolyte and the electrode material and enhancement in the Li-ion diffusion compared to pure TiO2 and the 3% Cu-doped TiO2. It is expected that this work would pave new avenues for the scientific community to develop environmentally benign metal-doped TiO2 nanoparticles using the Bengal gram bean extract as a greener and economic approach. Furthermore, metal doping is one of the best ways to enhance the electronic conductivity of TiO2 nanoparticles and thus the study is underway to understand the influence of other metal dopants and their varying concentrations on the electrochemical performance for their application in lithium-ion battery.
Experimental Section
Chemicals
Titanium chloride (TiCl4), copper(II) chloride dihydrate (CuCl2·2H2O), and ammonia (AR grade 28%) procured from Merck were used as such without further purification for the synthesis of Cu-doped TiO2 nanoparticles. Bengal gram beans (C. arietinum L.) were purchased from a local market in Aurangabad, India.
Synthesis of Gram Bean Extract
Dry Bengal gram beans (20 g, C. arietinum L.) were precleaned and soaked for 6 h in 100 mL of deionized (DI) water at room temperature (25 °C). After 6 h, the soaked seeds were removed and the extract was subjected to filtration using a glass fiber filter. The filtered solution was used as gram bean extract for the synthesis of pure TiO2 and Cu-doped TiO2 nanoparticles.
Synthesis of Cu-Doped TiO2 Nanoparticles
In typical synthesis of 3 and 7 wt % Cu-doped TiO2 nanoparticles using biosynthesis method, 6.9 mL of TiCl4 solution was dropwise added into 10 mL of gram bean extract in two beakers separately and further diluted to 50 mL. Copper chloride was used as a source of copper and an appropriate amount of CuCl2·2H2O was added to this solution for having 3 wt % (0.40 g) and 7 wt % (0.94 g) Cu doping, respectively. Subsequently, the pH of the solution was adjusted to 7 using ammonia solution to form titanium-hydroxide pectin gel, which shrinks and inhibits the further growth of the nanoparticles. The shrunk gel was washed with deionized water. The powder was dried in an electric oven at 100 °C and subsequently calcined at 400 °C for 3 h to remove the organic contaminants. Pristine TiO2 was also prepared in the same way without doping copper ion for better comparison. All Cu-doped TiO2 and pure TiO2 nanoparticles so produced were characterized for the confirmation of their preliminary structural and morphological properties.
Material characterization
Bruker AXS D8 Advance X-ray diffractometer equipped with Cu Kα1 radiation was used for powder X-ray diffraction measurement in the range of 10–80°. Raman spectra were recorded using a UniG2D Raman Spectroscope (UniNano Tech) with a 532 nm continuous-wave laser as the light source. UV–visible diffuse reflectance spectra of the samples were recorded using a UV–vis spectrophotometer (LabIndia, UV 3092). The morphologies of the as-synthesized Cu-doped TiO2 materials and calcined pure TiO2 were investigated by scanning electron microscopy (SEM, JEOL, JSM 6500F microscope) operating at 15 kV. Particle size and morphology of 7 wt % Cu-doped TiO2 and pure TiO2 were recorded using transmission electron microscopy (TEM) measurement on an FEI Tecnai G2-F20 microscope (Philips) with a field-emission gun operating at a 200 kV. Specimens were prepared by ultrasonication of TiO2 nanoparticles in ethanol, followed by dropping the suspension on a carbon-coated copper grid.
Electrode and Coin Cell Preparation for Electrochemical
The electrodes for the electrochemical analysis were prepared by coating a composite slurry of 80 wt % of active materials (Cu-doped TiO2), 15 wt % of conducting carbon (super-P, timcal), and 5 wt % of poly(vinylidene difluoride) binder prepared in N-methyl-2-pyrrolidone on a carbon-coated copper foil by using the doctor blade method, wherein the copper foil act as a current collector. This composite-coated foil was then subsequently dried at 60 °C for 24 h and then cut into a circular disk with the help of a punching machine fitted with cutters suitable for coin cells of CR2032. The material loadings in the range of 2.0–4.0 mg were achieved. The CR2032 cells for electrochemical testing were assembled inside an argon-filled glovebox at an extremely low oxygen level of less than 0.1 ppm. A metallic lithium (Li) disk was used as both counter and reference electrodes in opposite sides. The two electrodes were separated by a Whatman glass microfiber filter separator soaked in the electrolyte solution. Lithium hexafluorophosphate (1 M, LiPF6) in 1:1 volume ratio of ethylene carbonate and dimethyl carbonate mixture was used as the electrolyte. Cyclic voltammetry (at a scan rate of 0.3 mV s–1) and impedance measurement were carried out by an SP 300 Bio-Logic potentiostat. Galvanostatic charge–discharge and cycling profile (at a constant current density of 0.5 A g–1) measurements were carried out using an MTI battery cycler in the potential window 0.01–3.0 V for half-cell configurations at ambient temperature conditions.
Acknowledgments
A.A.K. acknowledges CSIR, New Delhi, for the research fellowship (File No. 09/809(0013)/2012-EMR-I). The authors acknowledge Shivaji University Group for Advanced Research “SUGAR” and the Department of Chemistry, Shivaji University, Kolhapur, for laboratory facilities. Financial support by Ministry of Science and Technology, R.O.C. Contract No. 106-2113-M-011-002, is also acknowledged.
Supporting Information Available
The Supporting Information is available free of charge on the ACS Publications website at DOI: 10.1021/acsomega.8b01903.
Rietveld refinement plot of biosynthesized (a) pure TiO2, (b) 3% Cu–TiO2, and (c) 7% Cu–TiO2 (Figure S1); particle size distribution histograms and representative TEM images of TiO2 nanoparticles prepared without and with Bengal gram bean extract (Figure S2); results of crystal analyses by Rietveld refinements of pure TiO2, 3% Cu-doped TiO2, and 7% Cu-doped TiO2 (Table S1); comparative specific capacitances of first six charge–discharge cycles of pure TiO2, 3% Cu-doped TiO2, and 7% Cu-doped TiO2 (Table S2); comparative rate capabilities of pure TiO2, 3% Cu-doped TiO2, and 7% Cu-doped TiO2 (Table S3) (PDF)
The authors declare no competing financial interest.
Supplementary Material
References
- Armand M.; Tarascon J.-M. Building Better Batteries. Nature 2008, 451, 652–657. 10.1038/451652a. [DOI] [PubMed] [Google Scholar]
- Vadiyar M. M.; Kolekar S. S.; Chang J.-Y.; Ye Z.; Ghule A. V. Anchoring Ultrafine ZnFe2O4/C Nanoparticles on 3D ZnFe2O4 Nanoflakes for Boosting Cycle Stability and Energy Density of Flexible Asymmetric Supercapacitor. ACS Appl. Mater. Interfaces 2017, 9, 26016–26028. 10.1021/acsami.7b06847. [DOI] [PubMed] [Google Scholar]
- Vadiyar M. M.; Kolekar S. S.; Chang J.-Y.; Kashale A. A.; Ghule A. V. Reflux Condensation Mediated Deposition of Co3O4 Nanosheets and ZnFe2O4 Nanoflakes Electrodes for Flexible Asymmetric Supercapacitor. Electrochim. Acta 2016, 222, 1604–1615. 10.1016/j.electacta.2016.11.146. [DOI] [Google Scholar]
- Ouyang L.; Huang J.; Wang H.; Liu J.; Zhu M. Progress of Hydrogen Storage Alloys for Ni-MH Rechargeable Power Batteries in Electric Vehicles: A Review. Mater. Chem. Phys. 2017, 200, 164–178. 10.1016/j.matchemphys.2017.07.002. [DOI] [Google Scholar]
- Yang Z.; Choi D.; Kerisit S.; Rosso K. M.; Wang D.; Zhang J.; Graff G.; Liu J. Nanostructures and Lithium Electrochemical Reactivity of Lithium Titanites and Titanium Oxides: A Review. J. Power Sources 2009, 192, 588–598. 10.1016/j.jpowsour.2009.02.038. [DOI] [Google Scholar]
- Piper D. M.; Evans T.; Leung K.; Watkins T.; Olson J.; Kim S. C.; Han S. S.; Bhat V.; Oh K. H.; Buttry D. A.; Lee S.-H. Stable Silicon-Ionic Liquid Interface for Next-Generation Lithium-Ion Batteries. Nat. Commun. 2015, 6, 6230 10.1038/ncomms7230. [DOI] [PubMed] [Google Scholar]
- Dwivedi P. K.; Muniraj V. K. A.; Devarapalli R. R.; Shelke M. V. Ni(OH)2-Fe2O3/CNOs Ternary Nanocomposite Designed as an Anode with Complementary Properties for High-Performance Li-Ion Battery. ChemistrySelect 2018, 3, 2286–2292. 10.1002/slct.201702779. [DOI] [Google Scholar]
- Sohn H.; Kim D. H.; Yi R.; Tang D.; Lee S.-E.; Jung Y. S.; Wang D. Semimicro-Size Agglomerate Structured Silicon-Carbon Composite as an Anode Material for High Performance Lithium-Ion Batteries. J. Power Sources 2016, 334, 128–136. 10.1016/j.jpowsour.2016.09.096. [DOI] [Google Scholar]
- Whittingham M. S. Lithium Batteries and Cathode Materials. Chem. Rev. 2004, 104, 4271–4302. 10.1021/cr020731c. [DOI] [PubMed] [Google Scholar]
- Chen C.; Huang Y.; An C.; Zhang H.; Wang Y.; Jiao L.; Yuan H. Copper-Doped Dual Phase Li4Ti5O12–TiO2 Nanosheets as High-Rate and Long Cycle Life Anodes for High-Power Lithium-Ion Batteries. ChemSusChem 2015, 8, 114–122. 10.1002/cssc.201402886. [DOI] [PubMed] [Google Scholar]
- Prakash A. S.; Manikandan P.; Ramesha K.; Sathiya M.; Tarascon J. M.; Shukla A. K. Solution-Combustion Synthesized Nanocrystalline Li4Ti5O12 as High-Rate Performance Li-Ion Battery Anode. Chem. Mater. 2010, 22, 2857–2863. 10.1021/cm100071z. [DOI] [Google Scholar]
- Ma X.-H.; Zeng S.-S.; Zou B.-K.; Liang X.; Liao J.-Y.; Chen C.-H. Synthesis of Different CuO Nanostructures by a New Catalytic Template Method as Anode Materials for Lithium-Ion Batteries. RSC Adv. 2015, 5, 57300–57308. 10.1039/C5RA10825J. [DOI] [Google Scholar]
- Xia W.; Mahmood A.; Zou R.; Xu Q. Metal-Organic Frameworks and Their Derived Nanostructures for Electrochemical Energy Storage and Conversion. Energy Environ. Sci. 2015, 8, 1837–1866. 10.1039/C5EE00762C. [DOI] [Google Scholar]
- Goriparti S.; Miele E.; De Angelis F.; Di Fabrizio E.; Zaccaria R. P.; Capiglia C. Review on Recent Progress of Nanostructured Anode Materials for Li-Ion Batteries. J. Power Sources 2014, 257, 421–443. 10.1016/j.jpowsour.2013.11.103. [DOI] [Google Scholar]
- Zhao Y.; Li X.; Yan B.; Xiong D.; Li D.; Lawes S.; Sun X. Recent Developments and Understanding of Novel Mixed Transition-Metal Oxides as Anodes in Lithium Ion Batteries. Adv. Energy Mater. 2016, 6, 1502175 10.1002/aenm.201502175. [DOI] [Google Scholar]
- Han H.; Song T.; Bae J.-Y.; Nazar L. F.; Kim H.; Paik U. Nitridated TiO2 Hollow Nanofibers as an Anode Material for High Power Lithium Ion Batteries. Energy Environ. Sci. 2011, 4, 4532–4536. 10.1039/c1ee02333k. [DOI] [Google Scholar]
- Lan T.; Zhang W.; Wu N.-L.; Wei M. Nb-Doped Rutile TiO2 Mesocrystals with Enhanced Lithium Storage Properties for Lithium Ion Battery. Chem. – Eur. J. 2017, 23, 5059–5065. 10.1002/chem.201605115. [DOI] [PubMed] [Google Scholar]
- Zhang Y.; Meng Y.; Zhu K.; Qiu H.; Ju Y.; Gao Y.; Du F.; Zou B.; Chen G.; Wei Y. Copper-Doped Titanium Dioxide Bronze Nanowires with Superior High Rate Capability for Lithium Ion Batteries. ACS Appl. Mater. Interfaces 2016, 8, 7957–7965. 10.1021/acsami.5b10766. [DOI] [PubMed] [Google Scholar]
- Sopha H.; Salian G. D.; Zazpe R.; Prikryl J.; Hromadko L.; Djenizian T.; Macak J. M. ALD Al2O3-Coated TiO2 Nanotube Layers as Anodes for Lithium-Ion Batteries. ACS Omega 2017, 2, 2749–2756. 10.1021/acsomega.7b00463. [DOI] [PMC free article] [PubMed] [Google Scholar]
- Liu Y.; Yang Y. Recent Progress of TiO2-Based Anodes for Li Ion Batteries. J. Nanomater. 2016, 2016, 8123652 10.1155/2016/8123652. [DOI] [Google Scholar]
- Kong H.; Lv C.; Yan C.; Chen G. Engineering Mesoporous Single Crystals Co-Doped Fe2O3 for High-Performance Lithium Ion Batteries. Inorg. Chem. 2017, 56, 7642–7649. 10.1021/acs.inorgchem.7b00008. [DOI] [PubMed] [Google Scholar]
- Issac I.; Scheuermann M.; Becker S. M.; Bardají E. G.; Adelhelm C.; Wang D.; Kübel C.; Indris S. Nanocrystalline Ti2/3Sn1/3O2 as Anode Material for Li-Ion Batteries. J. Power Sources 2011, 196, 9689–9695. 10.1016/j.jpowsour.2011.07.046. [DOI] [Google Scholar]
- Harunsani M. H.; Oropeza F. E.; Palgrave R. G.; Egdell R. G. Electronic and Structural Properties of SnxTi1–xO2 (0.0 ≤ x ≤ 0.1) Solid Solutions. Chem. Mater. 2010, 22, 1551–1558. 10.1021/cm902970u. [DOI] [Google Scholar]
- Nithyadharseni P.; Abhilash K. P.; Petnikota S.; Anilkumar M. R.; Jose R.; Ozoemena K. I.; Vijayaraghavan R.; Kulkarni P.; Balakrishna G.; Chowdari B. V. R.; Adams S.; Reddy M. V. Synthesis and Lithium Storage Properties of Zn, Co and Mg Doped SnO2 Nano Materials. Electrochim. Acta 2017, 247, 358–370. 10.1016/j.electacta.2017.06.170. [DOI] [Google Scholar]
- Jiao S.; Lian G.; Jing L.; Xu Z.; Wang Q.; Cui D.; Wong C.-P. Sn-Doped Rutile TiO2 Hollow Nanocrystals with Enhanced Lithium-Ion Batteries Performance. ACS Omega 2018, 3, 1329–1337. 10.1021/acsomega.7b01340. [DOI] [PMC free article] [PubMed] [Google Scholar]
- Li Q.; Yin L.; Li Z.; Wang X.; Qi Y.; Ma J. Copper Doped Hollow Structured Manganese Oxide Mesocrystals with Controlled Phase Structure and Morphology as Anode Materials for Lithium Ion Battery with Improved Electrochemical Performance. ACS Appl. Mater. Interfaces 2013, 5, 10975–10984. 10.1021/am403215j. [DOI] [PubMed] [Google Scholar]
- Ming H.; Li X.; Su L.; Liu M.; Jin L.; Bu L.; Kang Z.; Zheng J. One Step Synthesis of C&N co-Doped Mesoporous TiO2 with Enhanced Performance in a Lithium-Ion Battery. RSC Adv. 2013, 3, 3836–3839. 10.1039/C3RA22703K. [DOI] [Google Scholar]
- Kim S. G.; Ju M. J.; Choi I. T.; Choi W. S.; Choi H.-J.; Baek J.-B.; Kim H. K. Nb-Doped TiO2 Nanoparticles for Organic Dye-Sensitized Solar Cells. RSC Adv. 2013, 3, 16380–16386. 10.1039/c3ra42081g. [DOI] [Google Scholar]
- Zhao F.; Wang B.; Tang Y.; Ge H.; Huang Z.; Liu H. K. Niobium Doped Anatase TiO2 as an Effective Anode Material for Sodium-Ion Batteries. J. Mater. Chem. A 2015, 3, 22969–22974. 10.1039/C5TA04876A. [DOI] [Google Scholar]
- Roy N.; Sohn Y.; Leung K. T.; Pradhan D. Engineered Electronic States of Transition Metal Doped TiO2 Nanocrystals for Low Overpotential Oxygen Evolution Reaction. J. Phys. Chem. C 2014, 118, 29499–29506. 10.1021/jp508445t. [DOI] [Google Scholar]
- Zhang H.; Xing Z.; Zhang Y.; Li Z.; Wu X.; Liu C.; Zhu Q.; Zhou W. Ni2+ and Ti3+ co-Doped Porous Black Anatase TiO2 with Unprecedented-High Visible-Light-Driven Photocatalytic Degradation Performance. RSC Adv. 2015, 5, 107150 10.1039/C5RA23743B. [DOI] [Google Scholar]
- Xing Y.; Wang S.; Fang B.; Song G.; Wilkinson D. P.; Zhang S. N-Doped Hollow Urchin-Like Anatase TiO2@C Composite as a Novel Anode for Li-Ion Batteries. J. Power Sources 2018, 385, 10–17. 10.1016/j.jpowsour.2018.02.077. [DOI] [Google Scholar]
- Yeo Y.; Jung J.-W.; Park K.; Kim I.-D. Graphene-Wrapped Anatase TiO2 Nanofibers as High-Rate and Long-Cycle-Life Anode Material for Sodium Ion Batteries. Sci. Rep. 2015, 5, 13862 10.1038/srep13862. [DOI] [PMC free article] [PubMed] [Google Scholar]
- Li J.; Zeng H. C. Hollowing Sn-Doped TiO2 Nanospheres via Ostwald Ripening. J. Am. Chem. Soc. 2007, 129, 15839–15847. 10.1021/ja073521w. [DOI] [PubMed] [Google Scholar]
- Sun Q.; Peng Y.-P.; Chen H.; Chang K.-L.; Qiu Y.-N.; Lai S.-W. Photoelectrochemical Oxidation of Ibuprofen via Cu2O-doped TiO2 Nanotube Arrays. J. Hazard. Mater. 2016, 319, 121–129. 10.1016/j.jhazmat.2016.02.078. [DOI] [PubMed] [Google Scholar]
- Navas J.; Sánchez-Coronilla A.; Aguilar T.; Hernández N. C.; de los Santos D. M.; Sánchez-Márquez J.; Zorrilla D.; Fernández-Lorenzo C.; Alcántara R.; Martín-Calleja J. Experimental and Theoretical Study of the Electronic Properties of Cu-doped Anatase TiO2. Phys. Chem. Chem. Phys. 2014, 16, 3835–3845. 10.1039/c3cp54273d. [DOI] [PubMed] [Google Scholar]
- Wang Y.; Duan W.; Liu B.; Chen X.; Yang F.; Guo J. The Effects of Doping Copper and Mesoporous Structure on Photocatalytic Properties of TiO2. J. Nanomater. 2014, 2014, 178152 10.1155/2014/178152. [DOI] [Google Scholar]
- Lübke M.; Johnson I.; Makwana N. M.; Brett D.; Shearing P.; Liu Z.; Darr J. A. High Power TiO2 and High Capacity Sn-doped TiO2 Nanomaterial Anodes for Lithium-Ion Batteries. J. Power Sources 2015, 294, 94–102. 10.1016/j.jpowsour.2015.06.039. [DOI] [Google Scholar]
- Yan Y.; Du F.; Shen X.; Ji Z.; Sheng X.; Zhou H.; Zhu G. Large-Scale Facile Synthesis of Fe-Doped SnO2 Porous Hierarchical Nanostructures and Their Enhanced Lithium Storage Properties. J. Mater. Chem. A 2014, 2, 15875–15882. 10.1039/C4TA02077D. [DOI] [Google Scholar]
- Yang C.; Yu S.; Ma Y.; Lin C.; Xu Z.; Zhao H.; Wu S.; Zheng P.; Zhu Z.-Z.; Li J.; Wang N. Cr3+ and Nb5+ co-Doped Ti2Nb10O29 Materials for High-Performance Lithium-Ion Storage. J. Power Sources 2017, 360, 470–479. 10.1016/j.jpowsour.2017.06.026. [DOI] [Google Scholar]
- Zhang W.; Zhou Z.; Zhao W.; Yang Z.; Yang X. Chemical Replacement Route to Cu2-xSe-Coated CuO Nanotube Array Anode for Enhanced Performance in Lithium Ion Batteries. J. Mater. Chem. A 2014, 2, 5800–5808. 10.1039/c3ta14722c. [DOI] [Google Scholar]
- Shi L.; Fan C.; Sun C.; Ren Z.; Fu X.; Qian G.; Wang Z. Synthesis of Different CuO Nanostructures from Cu(OH)2 Nanorods Through Changing Drying Medium for Lithium-Ion Battery Anodes. RSC Adv. 2015, 5, 28611–28618. 10.1039/C4RA16778C. [DOI] [Google Scholar]
- Hasan M.; Chowdhury T.; Rohan J. F. Nanotubes of Core/Shell Cu/Cu2O as Anode Materials for Li-Ion Rechargeable Batteries. J. Electrochem. Soc. 2010, 157, A682–A688. 10.1149/1.3364794. [DOI] [Google Scholar]
- Klein F.; Pinedo R.; Berkes B. B.; Janek J.; Adelhelm P. Kinetics and Degradation Processes of CuO as Conversion Electrode for Sodium-Ion Batteries: An Electrochemical Study Combined with Pressure Monitoring and DEMS. J. Phys. Chem. C 2017, 121, 8679–8691. 10.1021/acs.jpcc.6b11149. [DOI] [Google Scholar]
- Owens B. B.; Passerini S.; Smyrl W. H. Lithium Ion Insertion in Porous Metal Oxides. Electrochim. Acta 1999, 45, 215–224. 10.1016/S0013-4686(99)00205-4. [DOI] [Google Scholar]
- Lin C.; Ding B.; Xin Y.; Cheng F.; Lai M. O.; Lu L.; Zhou H. Advanced Electrochemical Performance of Li4Ti5O12-based Materials for Lithium-Ion Battery: Synergistic Effect of Doping and Compositing. J. Power Sources 2014, 248, 1034–1041. 10.1016/j.jpowsour.2013.09.120. [DOI] [Google Scholar]
- Lin C.; Fan X.; Xin Y.; Cheng F.; Lai M. O.; Zhou H.; Lu L. Li4Ti5O12-Based Anode Materials With Low Working Potentials, High Rate Capabilities and High Cyclability for High-Power Lithium-Ion Batteries: A Synergistic Effect of Doping, Incorporating A Conductive Phase and Reducing the Particle Size. J. Mater. Chem. A 2014, 2, 9982–9993. 10.1039/C4TA01163E. [DOI] [Google Scholar]
- Débart A.; Dupont L.; Poizot P.; Leriche J.-B.; Tarascon J. M. A Transmission Electron Microscopy Study of the Reactivity Mechanism of Tailor-Made CuO Particles Toward Lithium. J. Electrochem. Soc. 2001, 148, A1266–A1274. 10.1149/1.1409971. [DOI] [Google Scholar]
- Sudant G.; Baudrin E.; Larcher D.; Tarascon J.-M. Electrochemical Lithium Reactivity with Nanotextured Anatase-Type TiO2. J. Mater. Chem. 2005, 15, 1263–1269. 10.1039/b416176a. [DOI] [Google Scholar]
Associated Data
This section collects any data citations, data availability statements, or supplementary materials included in this article.


