

Liu et al. report here that C9orf72, which is linked to the most common forms of the neurodegenerative diseases amyotrophic lateral sclerosis and frontotemporal dementia, is a key regulator of lipid metabolism under stress.
Keywords: ALS, autophagy, CARM1, C9orf72, FTD, lipid metabolism, NOX2
Abstract
Cells undergo metabolic adaptation during environmental changes by using evolutionarily conserved stress response programs. This metabolic homeostasis is exquisitely regulated, and its imbalance could underlie human pathological conditions. We report here that C9orf72, which is linked to the most common forms of the neurodegenerative diseases amyotrophic lateral sclerosis (ALS) and frontotemporal dementia (FTD), is a key regulator of lipid metabolism under stress. Loss of C9orf72 leads to an overactivation of starvation-induced lipid metabolism that is mediated by dysregulated autophagic digestion of lipids and increased de novo fatty acid synthesis. C9orf72 acts by promoting the lysosomal degradation of coactivator-associated arginine methyltransferase 1 (CARM1), which in turn regulates autophagy–lysosomal functions and lipid metabolism. In ALS/FTD patient-derived neurons or tissues, a reduction in C9orf72 function is associated with dysregulation in the levels of CARM1, fatty acids, and NADPH oxidase NOX2. These results reveal a C9orf72–CARM1 axis in the control of stress-induced lipid metabolism and implicates epigenetic dysregulation in relevant human diseases.
Nutrient utilization and energy metabolism are critical for the maintenance of cellular homeostasis, and their dysregulation could lie at the origin of many human diseases. Glucose and lipids are two main energy sources in energy homoeostasis. During compensatory responses to energy shortage such as glucose starvation, lipids serve as the source of energy supply, providing the fatty acids (FAs) whose metabolism is crucial for the survival of cells, including neurons (Du et al. 2009; Cabodevilla et al. 2013). FAs are stored as triacylglycerols that form lipid droplets (LDs), which are organelles consisting of a core of lipid esters covered by a phospholipid monolayer. LDs are dynamic organelles involved in lipid metabolism. The process of LD biogenesis is not entirely clear, but LD formation is known to occur in the endoplasmic reticulum (ER) (Fujimoto and Parton 2011). When mammalian cells experience starvation conditions, LD biogenesis is elevated (Rambold et al. 2015), and, at the same time, the turnover of LDs is increased, releasing free FAs (FFAs) (Fujimoto and Parton 2011). The turnover of LDs is reported to be mediated by macroautophagy (referred to here as autophagy) (Singh et al. 2009), a lysosome-degradative process used for degrading or recycling organelles in response to stress to maintain cellular homeostasis.
Amyotrophic lateral sclerosis (ALS) is a neurodegenerative disorder characterized by progressive degeneration of motor neurons. The hexanucleotide repeat expansion in C9orf72 is the most common cause of both ALS and the related neurodegenerative disease frontotemporal dementia (FTD) (DeJesus-Hernandez et al. 2011; Renton et al. 2011). In addition to the toxicity resulting from the expanded repeat (Taylor et al. 2016), the reduction in C9orf72 transcript and protein levels in patient cells and brain tissue suggests that loss-of-function mechanisms may contribute to ALS and FTD pathogenesis (DeJesus-Hernandez et al. 2011; Gijselinck et al. 2012; Belzil et al. 2013; Ciura et al. 2013; Donnelly et al. 2013; Mori et al. 2013; Xi et al. 2013; Haeusler et al. 2014; Liu et al. 2014; Waite et al. 2014). Additionally, there has been one report of a loss-of-function splice site mutation in C9orf72 causing ALS (Liu et al. 2016). Furthermore, higher C9orf72 levels may have beneficial effects against neurodegeneration in humans (van Blitterswijk et al. 2015; McGoldrick et al. 2018). Moreover, loss of C9orf72 hypersensitizes cells to stress (Maharjan et al. 2017), and the haploinsufficiency of C9orf72 leads to neurodegeneration in human motor neurons (Shi et al. 2018). Still a poorly characterized protein, C9orf72 has been shown to possess the structural components of a DENN (differentially expressed in normal and neoplasia)-like protein by bioinformatics analysis (Zhang et al. 2012; Levine et al. 2013). Recent studies have suggested that C9orf72 regulates membrane trafficking, the autophagy–lysosome pathway, and autoimmunity (Farg et al. 2014; Amick et al. 2016; Burberry et al. 2016; O'Rourke et al. 2016; Sellier et al. 2016; Sullivan et al. 2016; Ugolino et al. 2016; Webster et al. 2016; Yang et al. 2016; Aoki et al. 2017; Jung et al. 2017); however, the molecular functions of C9orf72 remain poorly understood. Energy metabolism defects have been associated in ALS patients, including hypermetabolism and hyperlipidemia (Dupuis et al. 2008, 2011; Dorst et al. 2011). This hypermetabolism results at least in part from an increased resting energy expenditure in ALS patients (Bouteloup et al. 2009; Vaisman et al. 2009), reflecting an altered basal metabolic rate. However, there has been no molecular mechanism identified to explain the ALS-related defects in energy and lipid metabolism.
Here, we report that C9orf72 regulates the lipid metabolism in the cell, particularly under conditions of glucose starvation stress. Mechanistically, C9orf72 controls the turnover of its interactor, coactivator-associated arginine methyltransferase 1 (CARM1), which serves as an epigenetic activator of autophagy and FA synthesis genes. CARM1 is dysregulated in mice lacking C9orf72 and in human cells and tissues derived from patients with C9orf72-linked ALS/FTD. Our study reveals a previously unknown C9orf72–CARM1 axis that plays a key role in the regulation of lipid metabolism and may have implications for the pathogenesis of relevant neurodegenerative diseases.
Results
Loss of C9orf72 alters lipid metabolism under starvation
To identify the cellular processes affected by the loss of C9orf72, particularly under nutrient stress, we performed a quantitative whole-proteome analysis of C9orf72 knockout (C9KO) and wild-type mouse embryonic fibroblasts (MEFs) under glucose starvation as well as control (complete medium [CM]) conditions by using tandem mass tag (TMT)-labeling mass spectrometry (MS). The quantitative analysis showed that more lipid metabolism-related proteins were differentially regulated in C9KO MEFs than in wild-type cells under glucose starvation (Supplemental Fig. S1A,B), suggesting that the loss of C9orf72 alters lipid metabolism under the starvation stress. Furthermore, among the proteins that were differentially regulated by the loss of C9orf72 after glucose starvation, there was a significant enrichment in proteins related to lipid synthesis (Supplemental Fig. S1C,D). To examine the potential C9orf72-dependent defects in lipid metabolism, we first measured the total cellular lipid concentration in C9KO and wild-type MEFs under both well-fed and starvation conditions. The levels of lipids were similar between C9KO and wild-type MEF cells when they were cultured with CM or starved for only a short time (6 h) (Fig. 1A). Consistent with previous analysis showing that lipids are increased under starvation conditions because of enhanced lipid biogenesis (Kaushik and Cuervo 2015), prolonged glucose starvation for 16 h increased the lipid levels (Fig. 1A). Interestingly, under this condition, the lipid levels were significantly elevated in the absence of C9orf72. Given that LDs are the main cell organelles for lipid storage, we quantified the amounts of LDs by staining cells with a well-characterized lipid probe: boron-dipyrromethene (BODIPY493/503) (Singh et al. 2009). Again, no difference was observed in LD amounts between wild-type and C9KO cells when cultured with CM. However, LD signals were significantly increased in the C9KO MEFs after starvation in glucose-free medium for 16 h (Fig. 1B,C).
Figure 1.
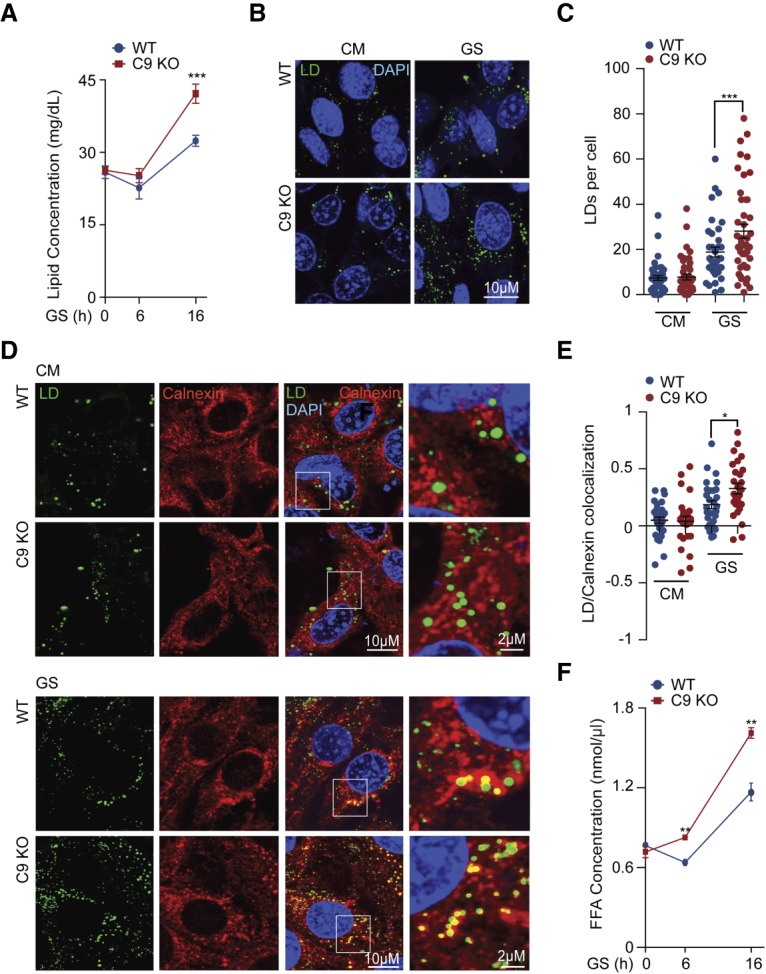
Loss of C9orf72 alters lipid metabolism under glucose starvation. (A) Wild-type and C9KO MEFs were starved with glucose-free medium for the indicated hours, and the lipid amount at each time point was detected by a fluorometric lipid-binding assay as described in the Materials and Methods. n = 3. (B,C) Wild-type and C9KO MEFs were cultured with CM or starved with glucose-free medium for 16 h, and LDs were stained by BODIPY493/503. The number of LDs per cell was counted, and 50 cells per group from three independent experiments were analyzed. (D,E) Wild-type and C9KO MEFs cultured with CM or starved with glucose-free medium (16 h) were triple-labeled with LDs by BODIPY493/503 and ER marker calnexin for confocal immunofluorescence microscopy analysis. The colocalizations of BODIPY493/503 and calnexin per cell were analyzed by Pearson's R-value. Thirty cells in each group from three independent experiments were statistically analyzed. (F) Wild-type and C9KO MEFs were starved with glucose-free medium for 0, 6, and 16 h. The FFA amounts were determined by an enzyme-coupled fluorometric assay as described in the Materials and Methods. n = 3. (GS) Glucose starvation. Data are presented as mean ± SEM. (*) P < 0.05; (**) P < 0.01; (***) P < 0.001.
Since the ER is the main cellular organelle for LD biogenesis (Wilfling et al. 2014) and our proteomic analysis indicated an enrichment of ER proteins among differentially regulated proteins in C9KO cells under glucose starvation (Supplemental Fig. S1E), we examined the formation of LDs in the ER of C9KO MEFs. When the MEFs were cultured in CM, colocalization of LDs with the ER was only rarely observed in either wild-type or C9KO MEF cells, suggesting a low basal level of lipid biogenesis in the ER in both cell types (Fig. 1D,E). When the cells were starved in glucose-free medium for 16 h, the colocalization of the LDs and ER was increased in both the wild-type and C9KO MEF cells. However, the C9KO MEFs exhibited more LDs colocalized with the ER than the wild-type cells did under this condition (Fig. 1D,E). These data suggest that loss of C9orf72 increases LD biogenesis under glucose starvation condition.
FAs, stored as triglycerides, are the major component of lipids in LDs. When released from triglycerides, FFAs are the main energy source for lipid utilization under conditions of starvation. We therefore tested the FFA levels in the C9KO and wild-type cells. In wild-type MEFs, the FFA level was initially slightly decreased after 6 h of treatment in the glucose-free medium but then increased sharply after 16 h of treatment (Fig. 1F). By comparison, the FFA levels in the C9KO MEFs were increased at both 6 and 16 h after glucose starvation (Fig. 1F). Furthermore, the C9KO cells exhibited higher levels of FFA than wild-type cells for the duration of the glucose starvation conditions (Fig. 1F).
Loss of C9orf72 increases FA flux and biogenesis
To determine whether the FFA accumulation under glucose starvation conditions in C9KO cells resulted from an increase in extracellular FFA uptake or intracellular biogenesis, we first examined the capacity for cellular uptake of extracellular FFA using a dodecanoic acid fluorescent FA substrate. We found no difference in the FFA uptake ability between the C9KO and wild-type MEF cells under well-fed or glucose-starved conditions (Supplemental Fig. S2A), suggesting that the FFA accumulation in the C9KO cells was due to intrinsic changes in the FFA biogenesis. Next, we examined the activities of two major intracellular FFA-generating pathways, including LD digestion and de novo FA synthesis.
Autophagy promotes FA flux by digesting LDs and organelle membranes into FAs, which are used to generate increased amounts of LDs (Kaushik and Cuervo 2015). Given the recent suggestion that C9orf72 is involved in the regulation of autophagy (Ugolino et al. 2016; Yang et al. 2016), we asked whether the increase of FFAs in C9KO MEFs upon glucose starvation was a result of augmented autophagic activity. We first investigated the status of autophagic flux in wild-type and C9KO MEF cells under glucose starvation conditions by monitoring the turnover of LC3II, a common marker for autophagic activity. There was no difference in the LC3II levels between wild-type and C9KO MEFs after glucose starvation (Supplemental Fig. S2B). However, after treatment with bafilomycin A1, an autophagy inhibitor that prevents lysosomal degradation of LC3II, C9KO MEFs exhibited significantly more LC3II than did wild-type controls (Supplemental Fig. S2B), indicating an enhanced autophagic flux in the glucose-starved C9KO MEFs. In addition, when the cells were treated with both glucose starvation and bafilomycine A1, there were more LC3-positive puncta in the C9KO MEFs than in the wild-type controls (Supplemental Fig. S2C,D). Thus, the loss of C9orf72 led to an enhanced autophagic flux under glucose starvation conditions, which is consistent with the previous reports that C9orf72 is a negative regulator of autophagic flux (Ugolino et al. 2016; Yang et al. 2016).
To confirm that the autophagy-mediated LD digestion was increased in the absence of C9orf72, we examined the colocalization of LDs with lysosomes as described previously (Singh et al. 2009; Seo et al. 2017). The colocalization of the BODIPY and LAMP1 signals was increased under glucose starvation conditions when compared with well-fed cells (Fig. 2A,B), consistent with the previous reports that the digestion of LDs by the autophagy is enhanced under starvation conditions (Kaushik and Cuervo 2015). Notably, under this condition, there was a significantly higher degree of colocalization of BODIPY and LAMP1 in C9KO MEFs than in wild-type cells. Next, we isolated LDs from these cells and measured the levels of LC3 and p62 proteins as markers for autophagic digestion of these lipid organelles. The adipose differentiation-related protein (ADRP) was used as a loading control (Singh et al. 2009). The LDs isolated from C9KO MEFs showed significantly higher levels of LC3II and p62 than did wild-type cells under glucose starvation conditions (Fig. 2C), indicative of an increased lipophagy. To confirm that the increase in the level of LDs in the absence of C9orf72 is dependent on the autophagy–lysosome pathway, we used bafilomycin A1 to inhibit lysosomal activity. The treatment of bafilomycin A1 reversed the increase in the level of LDs in the absence of C9orf72, as indicated by the BODIPY staining, and resulted in comparable levels of LDs in C9KO and wild-type MEFs (Supplemental Fig. S2E,F), demonstrating that the increase in LDs depends on lysosomal activity. To further confirm the involvement of the autophagy–lysosome pathway, we blocked autophagy induction by depleting Atg5 or FIP200 in C9KO MEFs. The complete removal of Atg5 from C9KO MEFs reversed the increase in the levels of LDs and lipophagy as quantified by the number of LDs per cell and their colocalization with LAMP1 (Fig. 2D–F). Furthermore, reducing FIP200 by shRNAs similarly ablated the increases in the levels of LDs and lipophagy in C9KO MEFs (Supplemental Fig. S2G–I). Together, these data indicate that loss of C9orf72 stimulates glucose starvation-induced LD digestion through the autophagy–lysosome pathway.
Figure 2.
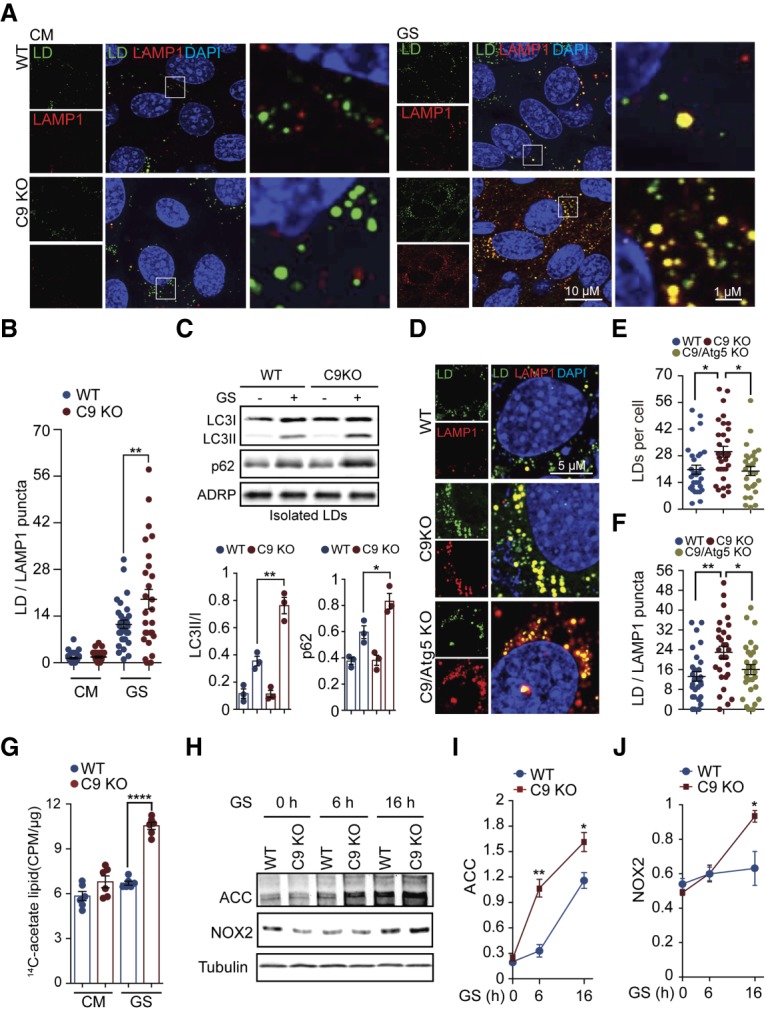
Loss of C9orf72 increases FA flux and biogenesis. (A,B) Wild-type and C9KO MEFs were starved with glucose-free medium for 16 h, and then the association of autophagy with LDs was monitored by immunostaining of BODIPY and lysosomal marker LAMP1. The number of BODIPY and LAMP1 double-positive puncta per cell was counted, and 30–40 cells in each group from three independent experiments were statistically analyzed. (C) Wild-type and C9KO MEFs were grown with or without glucose starvation for 16 h, and then LDs were isolated and subjected to SDS-PAGE and immunoblot against anti-LC3 and P62. ADRP served as a loading control. The ratios of LC3II/I and the amounts of P62 were calculated and statistically analyzed. n = 3. (D–F) Wild-type, C9KO, and C9/Atg5 double-knockout MEFs were starved with glucose-free medium for 16 h. The LDs were labeled with BODIPY and counted, and the association of autophagy and LDs was monitored as in A. Twenty-eight to 30 cells in each group from three independent experiments were statistically analyzed. (G) Wild-type and C9KO MEFs were cultured in CM or glucose-free medium with [1,2-14C] acetate at a final concentration of 0.3 µCi for 6 h. The incorporation of [1,2-14C] in total lipids was measured by a scintillation counter. Counts per minute (CPM) were normalized to the total amount of protein. n = 6. (H–J) Wild-type and C9KO MEFs were grown in glucose-free medium, and the protein levels of acetyl-CoA carboxylase (ACC) and NOX2 were determined at the indicated time points by immunoblotting. n = 3. (GS) Glucose starvation. Data are presented as mean ± SEM. (*) P < 0.05; (**) P < 0.01.
Next, we asked whether loss of C9orf72 enhances de novo FA synthesis, a pathway that could provide a new carbon source for the increased lipid metabolism. We used the radiolabeled [1,2-14C] acetate, a precursor of acetyl-CoA, to trace newly synthesized FAs in wild-type and C9KO MEFs under well-fed and glucose starvation conditions. We found that the incorporation of 14C into the lipids was significantly increased in C9KO MEFs compared with wild-type controls under the glucose starvation condition (Fig. 2G), indicating that loss of C9orf72 results in enhanced de novo synthesis of lipids under the nutrient stress. Next, we investigated whether FA de novo synthesis was altered upon the loss of C9orf72. Two enzymes regulating FA de novo synthesis were found to be up-regulated, including acetyl-CoA carboxylase (ACC) and FA synthase (FASN) (Fig. 2H,I; Supplemental Fig. S2J). Among them, ACC is the rate-limiting enzyme controlling the critical step of FA de novo synthesis (Currie et al. 2013). In both wild-type and C9KO MEFs, glucose starvation increased the level of ACC proteins. Under glucose starvation conditions, C9KO MEFs showed significantly higher ACC levels than wild-type MEFs (Fig. 2H,I). FASN showed changes similar to ACC in C9KO under glucose starvation conditions (Supplemental Fig. S2J). These data suggest that loss of C9orf72 heightens the activation of ACC and FASN, which is consistent with the increased lipid and FFA levels in the cells lacking C9orf72. Additionally, while studying the molecular consequences of the altered lipid metabolism in the absence of C9orf72, we found a consistent increase in the level of the NADPH oxidase NOX2. NOX2 is the most studied NADPH oxidase family member and was reported to be activated by FFAs (Inoguchi et al. 2000). NOX2 is also known to cause oxidative stress and has been found to be up-regulated in the nervous tissues of ALS patients (Wu et al. 2006; Marden et al. 2007). We confirmed that treatment with a common FA, sodium palmitate, resulted in a dose-dependent increase in the levels of NOX2 in MEFs by Western analysis (Supplemental Fig. S2K). Furthermore, we found that NOX2 was increased in C9KO MEFs upon glucose starvation compared with wild-type MEFs (Fig. 2H,J). These results suggest that loss of C9orf72 could contribute to the up-regulation of NOX2 and related pathogenesis in ALS patients.
C9orf72 negatively regulates CARM1 protein level
We then investigated the molecular mechanism underlying C9orf72-mediated regulation of lipid metabolism. In a quantitative proteomic study for C9orf72-interacting proteins using stable isotope labeling by amino acids in cell culture (SILAC) MS, we identified CARM1 as a potential strong interactor of C9orf72 (Supplemental Table S1). CARM1 is a transcriptional regulator that influences autophagy through an epigenetic mechanism (Shin et al. 2016). Hence, we asked whether CARM1 is the critical player that links C9orf72 to the regulation of autophagy and lipid metabolism.
First, we tested CARM1 protein levels upon C9orf72 depletion. Under basal condition, loss of C9orf72 increased CARM1 protein levels in C9KO MEFs (Fig. 3A,B). Additionally, CARM1 was up-regulated by glucose starvation, as reported previously (Fig. 3A,B; Shin et al. 2016). Notably, a longer duration of glucose starvation—up to 16 h—led to a greater increase in the CARM1 levels in C9KO MEFs than in wild-type cells (Fig. 3A,B). To further confirm the specificity of the regulation of CARM1 by C9orf72, we generated stable knockdown HEK293 cell lines using shRNAs against C9orf72. Like the C9KO MEFs, the HEK293 cells with stable C9orf72 knockdown exhibited up-regulation of CARM1 protein when compared with control cells, and this up-regulation could be further amplified by glucose starvation (Supplemental Fig. S3A). Conversely, overexpressed C9orf72 in HEK293 cells reduced CARM1 protein levels markedly under both well-fed and starvation conditions (Fig. 3C). Finally, we performed a rescue experiment by stably expressing human C9orf72 in the C9KO MEFs. With the restoration of the C9orf72 protein level, the accumulated CARM1 protein caused by loss of C9orf72 was brought down to the normal level of the wild-type cells (Fig. 3D).
Figure 3.
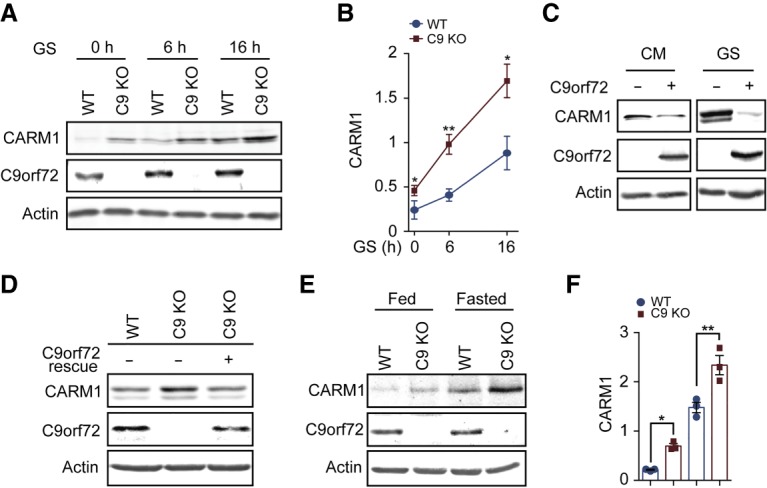
C9orf72 negatively regulates CARM1 protein level. (A,B) After glucose starvation for 0, 6, and 16 h, wild-type and C9KO MEFs were lysed, and CARM1 expression was determined by immunoblotting. n = 3. (C) Flag-tagged human C9orf72 was expressed in HEK293 cells, which were grown with or without glucose starvation for 6 h. The cells were then analyzed for CARM1 expression by immunoblotting. (D) The rescue of C9orf72 levels by stably expressing human C9orf72 in C9KO MEFs reversed the increase in CARM1 protein level under 6-h glucose starvation back to the wild-type level. (E,F) Cerebral cortex lysates from 2-mo-old wild-type and C9KO mice with or without 24-h fasting conditions were analyzed for CARM levels by immunoblotting. n = 3. (GS) Glucose starvation. Data are presented as mean ± SEM. (*) P < 0.05; (**) P < 0.01.
To determine whether this regulation holds true under physiological conditions, we analyzed the CARM1 protein levels in brains from C9KO mice and gender-matched wild-type littermate controls with or without fasting treatment. C9KO mice showed significantly higher levels of CARM1 than wild-type controls (Fig. 3E,F). Furthermore, the difference between the protein levels of CARM1 in C9KO mice and controls under the fasted condition was much greater than that under normal conditions. Collectively, these data demonstrate that C9orf72 is a negative regulator of CARM1 protein level.
C9orf72 negatively regulates CARM1 via lysosomal degradation
To gain insight into the molecular mechanism underlying the C9orf72-mediated regulation of CARM1 protein level, we first determined the CARM1 mRNA levels. However, there was no difference in CARM1 mRNA levels between C9KO MEFs and wild-type cells under either well-fed or glucose starvation conditions (Supplemental Fig. S3C), suggesting that the regulation of CARM1 by C9orf72 did not occur at the transcriptional level. Next, we asked whether C9orf72 regulates the turnover of the CARM1 protein. We performed a cycloheximide chase analysis to measure the half-life of the CARM1 protein. In wild-type MEFs, the endogenous CARM1 protein half-life was ∼2 h under glucose starvation; however, its half-life was increased to ∼4 h in C9KO MEFs, indicating that the degradation of the CARM1 protein was significantly impaired in the absence of C9orf72 (Supplemental Fig. S3D).
It was reported recently that CARM1 can be degraded by proteasomes and that the level of its E3 ubiquitin ligase, SKP2, is reduced under glucose starvation due to the activation of AMPK (Supplemental Fig. S3E), leading to CARM1 up-regulation (Shin et al. 2016). However, treatment with an AMPK-specific inhibitor, compound C, did not abolish the increase of CARM1 levels in C9KO MEFs under glucose starvation (Supplemental Fig. S3E). Additionally, there was no change detected in the SKP2 protein levels in C9KO MEFs and the brains of C9KO mice with or without starvation treatment (Supplemental Fig. S3F,G). Moreover, loss of C9orf72 did not affect the binding of CARM1 to SKP2 or the ubiquitination of CARM1 (Supplemental Fig. S3H,I). Thus, these data indicate that the C9orf72-dependent regulation of CARM1 is not mediated by AMPK/SKP2-dependent degradation through the ubiquitin–proteasome system.
Aside from the ubiquitin–proteasome system, the autophagy–lysosome pathway is the other major avenue for protein degradation in eukaryotic cells. We therefore examined the possible role of lysosomes in the degradation of CARM1 protein. The blockage of lysosomal proteolysis by either bafilomycin A1 or chloroquine significantly increased the CARM1 protein levels under both well-fed and glucose-starved conditions but to a larger extent under starvation conditions (Fig. 4A,B). The inhibition of the lysosomal degradation activity was confirmed by the accumulation of the lysosomal marker LAMP1 (Fig. 4A). Similarly, blocking autophagy by depleting Atg5 or FIP200 significantly increased the CARM1 protein levels under glucose starvation conditions (Supplemental Fig. S3K–N). These results indicate that CARM1 is degraded at least partially via lysosomal proteolysis, especially under conditions of glucose starvation.
Figure 4.
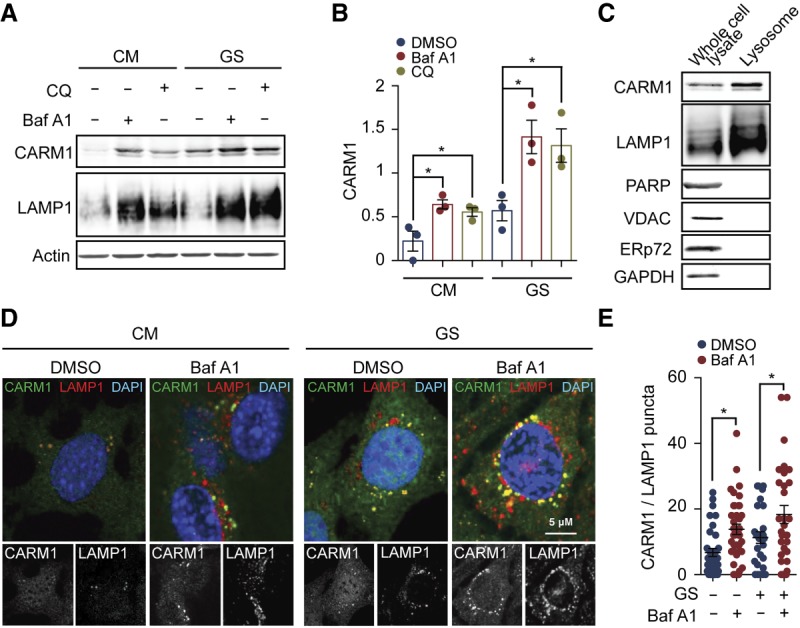
CARM1 is degraded by the autophagy–lysosomal pathway. (A,B) MEFs growing under normal conditions or subjected to glucose starvation for 6 h were treated with 100 nM inhibitor of lysosomal degradation bafilomycin A1 or 25 µM chloroquine. The ratio of CARM1 or LAMP1 to β-actin was statistically analyzed. n = 3. (C) Lysosomes were isolated form MEFs and subjected to detection of CARM1 by immunoblotting. GAPDH (cytosol), PARP (nucleus), VDCA (mitochondria), and ERp72 (ER) were regarded as negative controls, and LAMP1 was regarded as a positive control. (D,E) MEFs were cultured in CM or starved with glucose-free medium for 6 h with or without the presence of 100 nM bafilomycin A1. The colocalization of CARM1 and LAMP1 was determined by immunostaining. The number of CARM1/LAMP1 double-positive puncta per cell was counted. Thirty to 40 cells in each group from three independent experiments were statistically analyzed. (GS) Glucose starvation. Data are presented as mean ± SEM. (*) P < 0.05.
To further characterize the lysosome-mediated CARM1 degradation, we studied the subcellular distribution of CARM1 and lysosomes by immunostaining. In MEFs growing under the normal conditions, CARM1 exhibited a largely diffuse distribution, with a few puncta in the cytoplasm. The majority of CARM1-positive puncta was colocalized with the lysosomes marked by LAMP1 (Fig. 4D). Treatment of the MEFs with either bafilomycin A1 or glucose starvation significantly increased the number of CARM1-positive puncta and their colocalization with lysosomes in a synergistic manner (Fig. 4D,E), suggesting that the lysosomal localization of CARM1 is enhanced under the conditions of glucose deprivation or lysosomal inhibition. To confirm the localization of CARM1 to lysosomes, we isolated lysosomes from MEF cells grown in glucose-free medium. Consistent with the immunostaining data, CARM1 was enriched in the isolated lysosomes (Fig. 4C). These results suggest that CARM1 is recruited to the lysosome for degradation upon glucose starvation.
To determine whether C9orf72 is required for the lysosomal degradation of CARM1, we isolated lysosomes from wild-type and C9KO MEFs and assessed their CARM1 protein. Under the normal conditions, the lysosomal CARM1 was already decreased in C9KO MEFs (Fig. 5A). Furthermore, the starvation-induced lysosomal accumulation of CARM1 was completely abolished in the absence of C9orf72 (Fig. 5A), indicating that C9orf72 is required for the lysosomal localization of CARM1. We further confirmed this finding by examining the colocalization of CARM1 and lysosomes. In contrast to wild-type MEFs, C9KO MEFs had fewer CARM1-positive puncta, and, more importantly, there was no colocalization of CARM1 and the lysosome in the absence of C9orf72 (Fig. 5B,C). Moreover, treatment of the MEFs with either glucose starvation or bafilomycin A1 failed to recruit CARM1 to the lysosome in the absence of C9orf72 (Fig. 5B,C), confirming that C9orf72 is essential for the localization of CARM1 to lysosomes. Additionally, blocking the autophagy–lysosome pathway by treatment with chemical inhibitor bafilomycin A1 or by genetic depletion of Atg5 or FIP200 failed to increase the CARM1 protein levels in C9KO MEFs, in contrast to wild-type MEFs, under glucose starvation (Supplemental Fig. S3J–N), indicating that the C9orf72-dependent degradation of CARM1 requires the autophagy–lysosome pathway.
Figure 5.

C9orf72 interacts with CARM1 and is required for its lysosomal degradation. (A) Wild-type and C9KO MEFs were grown with or without glucose starvation for 6 h. Lysosomes were isolated, and CARM1 protein levels were determined by immunoblotting. n = 3. (B,C) Wild-type and C9KO MEFs were grown with or without glucose starvation conditions for 6 h in the presence or absence of 100 nM bafilomycin A1, and then the colocalization of CARM1 and LAMP1 was determined by immunostaining. The number of CARM1/LAMP1 double-positive puncta per cell were counted. Forty to 60 cells in each group from three independent experiments were analyzed. (D,E) Wild-type and C9KO MEFs were treated with or without 20 µM MG132 for 4 h, and the CARM1 protein levels in the cytoplasmic and nuclear fractions were detected by immunoblotting. Wild-type and C9KO MEFs were starved with glucose-free medium for 6 h with or without 200 nM bafilomycin A1, and the CARM1 protein levels in the cytoplasmic and nuclear fractions were determined by immunoblotting. n = 3. (F) MEFs were grown with or without glucose starvation for 6 h followed by immunoprecipitation using anti-CARM1 antibody. IgG was used as a control. (G,H) Purified C9orf72 and Flag-CARM1 proteins were shown to have direct interaction using the in vitro protein–protein interaction assay. Flag-CARM1 was immunoprecipitated by Flag beads, and coimmunoprecipitated C9orf72 (arrowhead) was detected by Western blotting. Flag beads only and Flag peptides were used as controls. The asterisk indicates IgG common to all samples. n = 3. (I,J) C9orf2 long-form full-length protein (1–481), the short form (1–222), and the C-terminal fragment (149–481) were tagged with Flag and expressed in HEK293 cells, and their interaction with endogenous CARM1 was analyzed by coimmunoprecipitation assays. Immunoprecipitation was conducted using Flag beads after cells were starved with glucose-free medium for 16 h. GUS-Flag was used as a control. (K,L) MEFs were fed or starved for 6 h with or without 100 nM bafilomycin A1 treatment. Lysosomal localization of endogenous C9orf72 and CARM1 was determined by immunostaining. Twenty-six to 40 cells from three independent experiments were statistically analyzed. (M) MEFs were grown with glucose-free medium for 0, 6, and 16 h. Lysosomes were isolated, and CARM1 and C9orf72 protein levels were determined by immunoblotting. LAMP1 was used as a loading control. n = 3. Data are presented as mean ± SEM. (*) P < 0.05; (**) P < 0.01; (***) P < 0.001; (****) P < 0.0001.
Since our proteomic data suggest that CARM1 interacts with C9orf72 (Supplemental Table S1), we assessed whether C9orf72 recruits CARM1 to lysosomes for degradation through their interaction. To address this question, we examined C9orf72-dependent degradation of CARM1. First, in wild-type MEFs, treatment with the proteasome inhibitor MG132 resulted in accumulation of CARM1 only in the nucleus but not in the cytoplasm (Fig. 5D,E), consistent with the previously reported proteasomal degradation of nuclear CARM1 (Shin et al. 2016). However, treatment of wild-type MEFs with the lysosome inhibitor bafilomycin A1 significantly increased the protein levels of CARM1 in both cytoplasmic and nuclear compartments (Fig. 5D,E). This result indicates that the degradation of CARM1 in the cytoplasm is mediated mainly by the lysosome and that inhibition of the lysosomal degradation leads to accumulation of CARM1 in both the cytoplasm and the nucleus, which are two interconnected compartments. Furthermore, in C9KO MEFs, the MG132 treatment still led to accumulation of nuclear CARM1; however, the bafilomycin A1 treatment yielded no change of CARM1 levels in either the cytoplasm or the nucleus, indicating that C9orf72 is required for the lysosomal degradation of CARM1 (Fig. 5D,E).
Next, we investigated the interaction between CARM1 and C9orf72. First, we confirmed the association of CARM1 with C9orf72 in HEK293 cells, where immunoprecipitation of CARM1 but not IgG control pulled down C9orf72 (Fig. 5F). Interestingly, glucose starvation substantially increased the association between CARM1 and C9orf72 (Fig. 5F). Furthermore, we demonstrated that CARM1 can directly interact with C9orf72 by coimmunoprecipitation assays using purified proteins (Fig. 5G,H; Supplemental Fig. S4C). Additionally, we examined the protein domains important for the interaction between CARM1 and C9orf72. CARM1 has a PH domain-like fold (residue 28–139) that is adjacent to the core catalytic domain (residues 140–479) (Troffer-Charlier et al. 2007). Consistent with a previous report (Troffer-Charlier et al. 2007), the remaining N-terminal (residues 1–27) and C-terminal (residues 480–608) regions are highly discorded and not stable enough to accumulate when expressed in the cells. The PH domain-like fold but not the core catalytic domain of CARM1 interacted with C9orf72, as indicated by coimmunoprecipitation assays (Supplemental Fig. S4D–F), suggesting that the PH domain-like fold of CARM1 contributes to the interaction with C9orf2. As a DENN-like protein, C9orf72 protein domains have not been clearly established. The major form of C9orf72 protein is 481 residues long, and a minor N-terminal short form (residues 1–222) is also expressed. Compared with the full-length C9orf2 protein (residues 1–481), the N-terminal short form (residues 1–222) and a relatively stable C-terminal truncate (residues 149–481) have less interaction with endogenous CARM1 in coimmunoprecipitation assays (Fig. 5I,J), suggesting that full-length C9orf72 is required for optimal interaction with CARM1.
Next, we studied the colocalization of C9orf72, CARM1, and lysosome. Triple immunostaining indicated that both C9orf72 and CARM1 were colocalized with LAMP1, the marker for lysosomes, especially under glucose starvation or bafilomycin A1 treatment (Fig. K,L). We then analyzed the dynamic relocation of C9orf72 and CARM1 upon glucose starvation in purified lysosomal fractions. Both C9orf72 and CARM1 were detected in the isolated lysosomes, and their lysosomal recruitment was further enhanced by starvation in an identical time-dependent manner (Fig. 5M). Furthermore, inhibiting lysosomal degradation with bafilomycin A1 significantly increased the protein levels of CARM1 and C9orf72 (Fig. 4A; Supplemental Fig. S4A,B) as well as the colocalization of the two proteins with the lysosome (Fig. 5K,L), suggesting that both CARM1 and C9orf72 are degraded in lysosomes. Taken together, given that the loss of C9orf72 leads to increased levels of CARM1, these results suggest that C9orf72 is required for the lysosomal localization and degradation of CARM1, especially under the glucose starvation condition.
CARM1 is required for the regulation of lipid metabolism by C9orf72
Since CARM1 was negatively regulated by C9orf72 (Fig. 3; Supplemental Fig. S3A), we sought to test whether CARM1 mediates the dysfunctional lipid metabolism or the altered autophagy–lysosomal pathway in C9KO cells. CARM1 activity as a transcription coactivator depends on its translocation from the cytoplasm to the nucleus. To directly study the transport of CARM1 from the cytoplasm to the nucleus, we sought to identify the nuclear localization sequence (NLS) of the protein. Bioinformatic analysis predicted the region of residues 347–380 as a potential NLS for CARM1. To experimentally validate the NLS domain for CARM1, we expressed V5-tagged wild-type hCARM1 in MEFs and observed nuclear enrichment of CARM1 under glucose starvation conditions (Fig. 6A). By comparison, removing the region of residues 347–380 completely blocked the nuclear translocation of CARM1 in either wild-type or C9KO MEFs (Fig. 6A), establishing this sequence as the NLS for the protein. Next, we examined the subcellular localization of CARM1 in wild-type and C9KO MEFs. By immunostaining for endogenous CARM1, we found that the loss of C9orf72 led to a significant increase in the nuclear staining of CARM1, and this effect was more pronounced in conditions of glucose starvation (Fig. 6B). Consistent with this observation, C9KO MEFs exhibited a significantly higher level of CARM1 in the isolated nucleus than did wild-type MEFs under both well-fed and glucose-starved conditions (Fig. 6C). Similar results were also obtained in HEK293 cells in which C9orf72 was knocked down (Supplemental Fig. S3B). These data indicate that the loss of C9orf72 increases CARM1 protein levels and nuclear localization, suggesting an augmentation in CARM1 activity and function in the nucleus.
Figure 6.

CARM1 is required for the regulation of lipid metabolism by C9orf72. (A) Wild-type V5-CARM1 and mutant V5-CARM1(Δ347–380) were expressed in wild-type and C9KO MEFs under glucose starvation conditions for 6 h. Eleven to 12 fields of view containing 39–47 cells from three independent experiments were statistically analyzed. (B) Wild-type and C9KO MEFs were cultured in CM or starved with glucose-free medium for 6 h followed by immunostaining of endogenous CARM1. Fifteen to 18 fields of view in each group from three independent experiments were statistically analyzed for the nuclear enrichment of CARM1. (C) CARM1 protein levels were determined by immunoblotting of the nuclear fractions of wild-type and C9KO MEFs grown with or without glucose starvation conditions for 6 h. The ratio of CARM1 to PARP was calculated and statistically analyzed. n = 3. (D,E) LDs were stained with BODIPY493/503 after wild-type, C9KO, and C9orf72/CARM1 double-knockout MEFs were grown with glucose-free medium for 16 h. The loss of C9orf72 led to an accumulation of LDs, which was reversed by the deletion of CARM1. The number of LDs per cell was counted, and 40 cells in each group from three independent experiments were statistically analyzed. (F,G) Wild-type, C9KO, and C9orf72/CARM1 double-knockout MEFs were grown with glucose-free medium for 16 h followed by quantitation of lipid amounts and FFA levels in each group. n = 3. (H) Wild-type, C9KO, and C9orf72/CARM1 double-knockout MEFs were starved for 16 h. LDs were isolated and immunoblotted against anti-LC3. ADRP served as a loading control. (I) Wild-type, C9KO, and C9orf72/CARM1 double-knockout MEFs were cultured in glucose-free medium with [1,2-14C] acetate at the final concentration of 0.3 µCi for 6 h. The incorporation of [1,2-14C] in total lipids was measured by a scintillation counter. Counts per minute (CPM) were normalized to the total amount of protein. n = 3. (J) After starving wild-type, C9KO, and C9orf72/CARM1 double-knockout MEFs with glucose-free medium for 6 h, the levels of ACC in each group were determined by immunoblotting. (K) ACC mRNA level was determined by quantitative PCR (qPCR) after MEFs were grown with glucose-free medium for 6 h. n = 3. (L–N) Wild-type and C9KO MEFs were starved for 6 h. The enrichment of CARM1 and H3R17me2 on the promoter of Atg14, Map1lc3b, or ACC in each group was measured by ChIP-qPCR (chromatin immunoprecipitation [ChIP] combined with qPCR) using anti-CARM1 and anti-H3R17me2 antibodies, respectively. n = 3. (GS) Glucose starvation. Data are presented as mean ± SEM. (*) P < 0.05; (**) P < 0.01; (***) P < 0.001; (****) P < 0.0001.
We then assessed whether the up-regulation of CARM1 mediated the dysfunction in lipid metabolism and the autophagy–lysosomal pathway caused by loss of C9orf72. By using CRISPR–Cas9 genome editing, we deleted CARM1 in C9KO MEFs to create double-knockout cells. In C9KO MEFs under glucose starvation conditions, the depletion of CARM1 completely reversed their abnormally high levels of lipids, LDs, and FFAs to normal levels (Fig. 6D–G), suggesting that CARM1 is a key factor downstream from C9orf72 in the regulation of lipid metabolism. As CARM1 is the coactivator of TFEB (Shin et al. 2016), which is an autophagy regulator that we found previously to translocate to the nucleus upon loss of C9orf2 (Ugolino et al. 2016), we investigated potential regulation of TFEB in these settings. Although TFEB translocated from the cytoplasm to the nucleus in C9KO MEFs compared with wild-type MEFs, the deletion of CARM1 in C9KO MEFs did not affect the nuclear enrichment of TFEB (Supplemental Fig. SA,B), suggesting that CARM1 does not regulate the nuclear transportation of TFEB.
To examine the autophagy–lysosomal function, we analyzed the levels of LC3 proteins in wild-type MEFs, C9KO cells, and CARM1/C9orf72 double-knockout cells with or without the treatment with bafilomycin A1. Under glucose starvation conditions, the C9KO cells showed a much higher level of LC3II in the presence of bafilomycin A1, indicating that the loss of C9orf72 leads to an increase in the autophagic flux induced by glucose deprivation (Supplemental Fig. S5C,D). However, in the CARM1/C9orf72 double-knockout cells, bafilomycin treatment failed to accumulate LC3II under glucose starvation conditions, indicating that the increased autophagic flux were reversed (Supplemental Fig. S5C,D). Accordingly, the level of the lysosomal marker LAMP1 was also reduced in CARM1/C9orf72 double-knockout cells as compared with C9KO cells (Supplemental Fig. S5C,E), suggesting that the lysosomal function was dramatically decreased upon removal of CARM1. These data indicate that CARM1 is required for the enhanced autophagy–lysosomal function caused by loss of C9orf72.
We next examined the role of CARM1 in C9orf72-regulated autophagic digestion of lipids. The isolated LDs from the C9KO cells exhibit increased LC3II levels after glucose deprivation (Figs. 2C, 6H). However, the CARM1/C9orf72 double-knockout cells showed a reduced LC3II level in the isolated LDs as compared with wild-type MEFs (Fig. 6H), suggesting that the autophagic digestion of LDs was decreased upon the loss of CARM1. Next, we analyzed the colocalization of LDs and lysosomes in wild-type MEFs, C9KO cells, and CARM1/C9orf72 double-knockout cells. As compared with the C9KO cells, which showed a significant increase in the colocalization of BODIPY-labeled LDs and LAMP1-labeled lysosomes under conditions of glucose starvation, the CARM1/C9orf72 double-knockout cells showed almost no colocalization of these two markers (Supplemental Fig. S5F,G). These data indicate that CARM1 is required for the enhanced lipid metabolism through autophagy that is induced by the loss of C9orf72.
We further examined whether CARM1 is involved in the enhanced FA de novo synthesis in the absence of C9orf72 using radiolabeled [1,2-14C] acetate. As mentioned above, the FA de novo synthesis was enhanced in C9KO MEFs compared with wild-type controls under glucose starvation (Figs. 2G, 6I). However, the deletion of CARM1 in C9KO MEFs completely abolished the enhancement in the biosynthetic process, as CARM1/C9orf72 double-mutant MEFs presented an equal level of 14C incorporation in lipids with wild-type controls (Fig. 6I). Next, we asked whether CARM1 underlies the dysregulation of ACC, the rate-limiting enzyme of de novo FA synthesis that is up-regulated upon the loss of C9orf72 in glucose starvation (Fig. 2E,F). As compared with the C9KO MEFs under glucose starvation, the CARM1/C9orf72 double-knockout cells showed a normal level of ACC protein, similar to that in wild-type cells (Fig. 6J). Consistently, the mRNA levels of the mouse ACC changed in accordance with the protein levels (Fig. 6K), suggesting that CARM1 regulates ACC at the transcriptional level. These data suggest that CARM1 is required for the up-regulation of ACC and the increased de novo biogenesis of lipids resulting from the loss of C9orf72.
CARM1 functions as a transcriptional coactivator and catalyzes the methylation on histone H3R17, which is associated with transcriptional activation (Yang and Bedford 2013; Shin et al. 2016). The enhanced autophagy and FFA de novo synthesis in the absence of C9orf72 could be controlled by the epigenetic regulation of CARM1 on specific genes. The epigenetic regulation of CARM1 on autophagic genes, including Atg14 and Map1lc3b, via the methylation on H3R17 has been established previously (Shin et al. 2016). Here we found that C9KO MEFs showed increased enrichment of CARM1 and H3R17me2 at the promoter regions of Atg14 and Map1lc3b under glucose starvation conditions when compared with wild-type MEFs (Fig. 6L,M). To explore whether the transcriptional activation of ACC is epigenetically regulated by CARM1 via the methylation on H3R17, we examined the level of H3R17me2 bound at the promoter region of the mouse gene encoding ACC. We first analyzed a chromatin immunoprecipitation (ChIP) sequencing (ChIP-seq) data set generated from MEFs in a previous study (Shin et al. 2016) and found that H3R17me2 was enriched at the mouse gene encoding ACC (Supplemental Fig. S6A). By the ChIP-qPCR (ChIP combined with quantitative PCR) assay, we confirmed that the methylated H3R17 was indeed highly enriched at the gene locus using an H3R17me2-specific antibody (Supplemental Fig. S6B). Furthermore, we found that H3R17me2 accumulated at a much higher level at the mouse ACC gene promoter in C9KO MEFs than wild-type MEFs under 6-h glucose starvation conditions (Fig. 6N; Supplemental Fig. S6C), indicating that loss of C9orf72 enriched H3R17me2 at the locus. Consistent with H3R17me2, CARM1 showed a threefold higher enrichment at the mouse ACC gene promoter in C9KO MEFs compared with wild-type MEFs under glucose starvation for 6 h (Fig. 6N; Supplemental Fig. S6C). These data suggest that the enhanced association of CARM1 and H3R17me2 with the ACC promoter region mediates the increased transcriptional activation of the ACC gene in the absence of C9orf72.
Dysregulation of CARM1 and lipid metabolism in patients with C9orf72-linked ALS/FTD
The most common cause of ALS and FTD is the hexanucleotide repeat expansion in C9orf72 (DeJesus-Hernandez et al. 2011; Renton et al. 2011). One consequence of the repeat expansion is a reduction in the level of the C9orf72 protein (DeJesus-Hernandez et al. 2011; Gijselinck et al. 2012; Belzil et al. 2013; Ciura et al. 2013; Donnelly et al. 2013; Mori et al. 2013; Xi et al. 2013; Liu et al. 2014; Waite et al. 2014). Therefore, we determined whether CARM1 is dysregulated in C9orf72-linked ALS/FTD patients. First, we confirmed that the C9orf72 protein levels were reduced in two independent lines of B lymphocytes from ALS patients carrying the C9orf72 repeat expansion as compared with two controls (Fig. 7A,B). We found that the two patient-derived B lymphocyte lines exhibited higher levels of CARM1 protein than did controls, especially under glucose starvation conditions (Fig. 7C,D). Consistent with the observation in lymphocytes, we also found up-regulated CARM1 protein in the induced pluripotent stem cell (iPSC)-derived motor neurons from two C9orf72-linked ALS/FTD patients when compared with two non-ALS/FTD controls (Fig. 7K,O). Furthermore, we validated the up-regulation of CARM1 in the spinal cord tissues of three C9orf72-linked ALS/FTD patients, which is in accordance with reduced C9orf72 protein levels observed in the patients’ tissues (Fig. 7F–I).
Figure 7.

Dysfunctional lipid metabolism and dysregulation of CARM1 in C9orf72-linked ALS patients. (A,B) C9orf72 protein levels in B lymphocytes derived from C9orf72-linked ALS patients and controls were determined by immunoblotting. n = 4. (C,D) C9 ALS patient and control B lymphocytes were cultured in CM or glucose-free medium for 6 h, and C9orf72 protein levels were determined as in A and B. n = 4. (E) FFA levels were determined in two independent pairs of iPSC-derived motor neurons from control and C9 ALS patients. n = 3. (F–J) Protein levels of C9orf72, CARM1, and LAMP1 in spinal cords from three C9 ALS patients and four controls were determined by immunoblotting. n = 3–4. (K) Representative immunoblots for analyzing CARM1, C9orf72, ACC, and LAMP1 in iPSC-derived motor neurons from two C9 ALS patients and two controls. (L) Representative images of iPSC-derived motor neurons from two C9 ALS patients and two controls, including the staining with CHAT (motor neuron marker), BODIPY (LD), and LAMP1 (lysosomal marker). (M,N) Quantitative analyses of BODIPY staining (n = 24–27 fields of view; K) and BODIPY/LAMP1 dual-positive puncta (45–47 cells; L) in iPSC-derived motor neurons from C9 ALS patients and controls. (O–S) Quantitation of the immunoblotting analysis in I for iPSC-derived motor neurons from C9 ALS patients and controls. n = 4. (GS) Glucose starvation. Data are presented as mean ± SEM. (*) P < 0.05; (**) P < 0.01; (***) P < 0.001.
Next, we examined the lipid metabolism, including the levels of FFA and LDs in the iPSC-derived motor neurons from patients with C9orf72-linked ALS/FTD. We found that the levels of FFA and LDs in the two independent lines of motor neurons from C9orf72 ALS/FTD patients were higher than those in controls (Fig. 7E,L,M), indicating a dysfunctional lipid metabolism in the patient-derived neurons. Moreover, the lysosomal marker LAMP1 protein levels were increased in the C9orf72 ALS/FTD patient-derived motor neurons and spinal cord tissues (Fig. 7F,I,K,R). Additionally, the colocalization of LDs and lysosomes was increased in the C9orf72 ALS/FTD patient-derived motor neurons (Fig. 7L,N), suggesting up-regulated digestion of LDs via the autophagy–lysosome pathway after loss of C9orf72. Furthermore, the C9orf72 ALS/FTD patient-derived motor neurons showed an increased protein level of ACC (Fig. 7K,Q), consistent with the up-regulation of the de novo FA synthesis as a result of increased CARM1 activity in the patients’ cells. Last, in agreement with the up-regulation of NOX2 in C9KO MEFs (Fig. 2H,J), which is induced by the increased FFA levels, the NOX2 protein was up-regulated in the C9orf72 ALS/FTD patient-derived motor neurons (Fig. 7K,S) and spinal cord tissues (Fig. 7F,J). Taken together, these data indicate that the pathways related to CARM1 and lipid metabolism are dysregulated in C9orf72 ALS/FTD patient cells and tissues.
Discussion
In the present study, we identified a function for C9orf72 mediated by CARM1 in regulating lipid metabolism. This newly identified activity represents a previously unknown pathway in regulating lipid mobilization under nutrient stress induced by glucose starvation in the cell. Our findings also implicate this pathway in the pathogenesis of C9orf72-linked ALS/FTD, as suggested by the dysregulation of CARM1 in patient-derived cells and tissues. The molecular connections highlight a dynamic regulation of lipid metabolism, autophagy, and transcriptional programs. Collectively, C9orf72 emerges as a regulator of lipid metabolism and autophagy in the maintenance of metabolic homeostasis, particularly during changes in nutrient availability (Supplemental Fig. S7).
DENN-like proteins have been reported to carry out functions related to membrane trafficking and autophagy (Marat et al. 2011). Our findings indicate that C9orf72, as a DENN-like protein, functions in regulating lipid homeostasis. C9orf72 is identified as a negative regulator of CARM1, which is required for the regulation of lipid metabolism by C9orf72. Under conditions of glucose starvation, CARM1 is translocated from the cytoplasm to the nucleus, where it may act as an epigenetic regulator to activate the transcriptional program for the de novo lipogenesis and the autophagy–lysosome pathway as a stress response mechanism to maintain energy balance in the cell. In this starvation-induced adaptive program, autophagy plays a key role in the digestion of lipids as a nutrient source as well as in the biogenesis of LDs to replenish lipid storage. C9orf72 seems to play the role of a brake in this stress response by recruiting CARM1 to lysosomes for degradation, providing a mechanism for controlling starvation-induced lipid utilization. Thus, a reduction in C9orf72 function leads to aberrant activation of lipid metabolism. In ALS patients, the down-regulation of C9orf72 and up-regulation of CARM1 in the central nervous system suggest that dysregulation of lipid metabolism could contribute to the pathogenesis of the disease.
Autophagy, a common pathway implicated in neurodegenerative diseases (Nixon 2013; Yamamoto and Yue 2014), is an important regulator of lipid metabolism, especially under starvation conditions, since the energy metabolism shifts to the breakdown of lipids under these conditions (Singh et al. 2009; Settembre et al. 2013; Kaushik and Cuervo 2015). We found that the loss of C9orf72 increased the autophagic flux and its association with LDs under glucose starvation conditions (Fig. 2A–F; Supplemental Fig. S2B–F). In addition to autophagy as a mechanism for supplying the FFAs needed for LD biogenesis, the de novo synthesis of FAs was enhanced by the loss of C9orf72 (Fig. 2G). This enhancement of FA synthesis resulted at least in part from the up-regulation of the rate-limiting enzyme ACC, which promotes the FA synthesis, in the absence of C9orf72 after prolonged glucose starvation (Fig. 2H,I). These results are consistent with the increase in FFA levels seen with the loss of C9orf72. The increase in lipogenesis and autophagy that occurs when C9orf72 activity is lost is in line with the activation of CARM1, which mediates the transcriptional programs promoting autophagic functions and lipid metabolism. For instance, our data demonstrate that loss of C9orf72 promotes the nuclear enrichment of CARM1 and increases the activity of CARM1 as an epigenetic activator to be associated with the promoter region of the genes, including ACC, Atg14, and Map1lc3b (Fig. 6). It has also been reported that CARM1 activates transcription factor TFEB (Shin et al. 2016), which controls expression of autophagic and lysosomal gene expression (Settembre et al. 2011) and was found to be inactivated by C9orf72 (Ugolino et al. 2016), consistent with our findings here that C9orf72 interacts with and negatively regulates the turnover of CARM1 (Fig. 3; Supplemental Fig. S3A). Together, the identification of the C9orf92–CARM1 axis provides a molecular mechanism for the changes in autophagy and lipid metabolism upon loss of C9orf72.
Our results indicate that loss of C9orf72 leads to cellular hypermetabolism of lipids. This mobilization of lipid metabolism is an adaptive response to nutrient stresses such as glucose starvation. C9orf72 appears to offer a control mechanism built in by nature to buffer the stress response. However, when C9orf72 function is reduced, such as in patients’ cells, a chronic stress state is mimicked, or the adaptive response is prone to overdrive, which may contribute to the susceptibility of the cells to undergo degeneration. This metabolic imbalance of energy and lipids could be particularly relevant to the pathogenesis of ALS/FTD, which is associated with hypermetabolism and hyperlipidemia. We found that NOX2, which is associated with increased FFAs and promotes oxidative stress (Inoguchi et al. 2000), was up-regulated in C9orf72 ALS/FTD patient cells and tissues, suggestive of functional alterations as a result of the dysregulated lipid metabolism. NOX2 has also been found to be up-regulated in ALS-linked SOD1 mouse models and sporadic ALS patients and may participate in the pathogenesis (Wu et al. 2006; Marden et al. 2007). There is also other evidence suggesting that a dysregulation of lipid metabolism is associated with motor neuron diseases. For example, the abnormal up-regulation of CARM1, which was observed in ALS/FTD patients in the present study, has also been found in animal models and cells of patients with spinal muscular atrophy (Sanchez et al. 2013). Moreover, mutations in Spartin/SPG20, a gene important for LD turnover, have been linked to hereditary spastic paraplegia (Patel et al. 2002; Eastman et al. 2009). In summary, our identification of the C9orf72–CARM1 signaling cascade that is involved in regulating lipid metabolism may shed light on the pathogenic mechanisms of ALS/FTD and other related diseases.
Materials and methods
Plasmids
The C9orf72 shRNAs were constructed as described previously (Ugolino et al. 2016). The FIP200 shRNA was purchased from Sigma (TRCN0000304384). The guide RNAs (gRNAs) for CRISPR–Cas9-mediated knockout of CARM1 or Atg5 were designed with Benchling as follows: CARM1 (oligo1: 5′-CACCGCTCACTATCGGCGACGCGAA-3′; oligo2: 5′-AAACTTCGCGTCGCCGATAGTGAGC-3′) and atg5 (oligo1: 5′-CACCGAAGAGTCAGCTATTTGACGT-3′; oligo2: 5′-AAACACGTCAAATAGCTGACTCTTC-3′). The oligos were synthesized and cloned into LentiCRISPRv2 plasmid (Sanjana et al. 2014). The Flag-tagged C9orf72 constructs were generated using the Gateway cloning system (Thermo Fisher) as described previously (Ugolino et al. 2016). For the expression of human C9orf72 in C9KO MEFs, the human C9orf72 cDNA was cloned into the pLenti-CMV-Puro-DEST(w118-1) vector using the Gateway cloning system (Thermo Fisher). Human CARM1 cDNA (NM_199141.1) was generated from human B lymphocytes and cloned into the pcDNA3.1 plasmid with an N-terminal V5 tag using the Gateway cloning system. The NLS of CARM1 (residues 347–380) was predicated by the cNLS Mapper (Kosugi et al. 2009).
Cell culture
MEFs and HEK293 cells were maintained in DMEM supplemented with 10% FBS. Human B lymphocytes were from Coriell Cell Repositories and cultured with RPMI 1640 medium containing 15% FBS. The generation of C9KO MEFs from C9KO mouse embryos was described previously (Ugolino et al. 2016). For glucose starvation, cells were cultured with fresh CM for 2 h and then replaced with glucose-free DMEM containing 10% dialyzed FBS. For autophagic flux determination, cells were subjected to glucose starvation with or without 100 nM autophagy inhibitor bafilomycin A1 for 6 and 16 h. For the ubiquitination assay of CARM1, MEFs were treated with 10 µM MG132 for 4 h under glucose starvation. Lipofectamine 2000 reagent (Thermo Fisher) was used to perform cell transfection on HEK293 cells, and jetPRIME (Polyplus Transfection) was used on MEFs. To generate stable C9orf72 knockdown HEK293 cells, the plasmids encoding shRNAs that are either targeting C9orf72 or scrambled controls were transfected into HEK293 cells. Eight hours after transfection, cells were washed twice with PBS and cultured with fresh CM and then subjected to 2 µg/mL puromycin selection for 2 wk. Lentivirus was used to generate knockout and knockdown MEFs. For the preparation of lentivirus, HEK293 cells were cotransfected with the lentiviral plasmid and viral packaging vectors (psPAX2 and pMD2G). Sixty hours after transfection, cell supernatants were collected and passed through 0.45-µm cellulose acetate filters. For lentivirus infection of MEFs, cells were plated at 2 × 10⁶ cells per 10-cm dish and then supplemented with either human C9orf72-expressing lentivirus, CARM1 gRNA-expressing lentivirus, or FIP200 shRNA-expressing lentivirus for 48 h prior to puromycin selection at a final concentration of 5 µg/mL for additional 72 h. Cells stably expressing shRNA were maintained in 10% FBS DMEM containing puromycin at a final concentration of 2 µg/mL. Stable MEF lines expressing C9orf72 were generated by multiple rounds of puromycin selection. CARM1 knockout MEF lines were selected by picking individual colonies that exhibited no CARM1 expression.
Quantitative MS
For TMT-labeling quantitative MS, cells were washed with PBS and resuspended in lysis buffer (8 M urea/50 mM tetraethyl ammoniumbicarbonate). The lysates were diluted to a final urea concentration of 1 M, and trypsin/LysC (1:50 enzyme:protein; Promega) was added. After overnight incubation, peptides were sequentially acidified, destalted, and lyophilized. Peptides were resolved in 0.2% formic acid and then quantified. Peptides were then lyophilized and labeled by 6-plex TMT (Pierce TMT). Labeled peptides were mixed and desalted consequently. The labeled peptides were enriched in tandem for modified peptides, and then all modified peptides were desalted and resuspended for liquid chromatography-tandem MS (LC-MS/MS) analysis. Unmodified peptides were fragmented by basic pH reversed phase LC (RPLC) and then lyophilized and resolved for LC-MS/MS analysis. The resulting spectra were analyzed by Proteome Discoverer 2.1 (database used: mouse RefSeq version 78). Carbamidomethylation on cysteine residues and TMT on Lys and peptide N terminus were included as fixed modifications. Oxidation on methionine was included as dynamic modification for total protein. Up to two missed cleavages were allowed. A 1% false discovery rate was applied for both peptide and protein levels.
According to the UniProt database, 604 mouse proteins are related to lipid metabolism. Among the 604 proteins, 214 proteins were identified in our quantitative proteomic data. Ratios of C9KO (glucose starvation)/C9KO (CM) and wild-type (glucose starvation)/wild-type (CM) were calculated, which reflect the extent of protein variation induced by glucose starvation in C9KO MEFs and wild-type MEFs, respectively. The comparison of these ratios was then used to evaluate whether glucose starvation affects wild-type MEFs and C9KO MEFs differently. By comparing the proteomic data with the UniProt database, the enrichment analysis on lipid synthesis and ER was tested using the Fisher test.
For the SILAC quantitative MS, HEK293 cells were incubated with heavy (13C6,15N4 L-arginine, 13C6,15N2 L-lysine) or light (12C6,14N4 L-arginine, 12C6,14N2 L-lysine) DMEM. After the incubation, cells were verified for near completion of labeling by MS. After heavy isotope-labeled cells were transfected with C9orf72-Flag and light isotope-labeled cells were transfected with Lipofectamine, cells were lysed and precipitated with Flag tag beads. The immunoprecipitates were then pooled, concentrated, separated via SDS-PAGE, and subjected to trypsin in-gel digestion. The prepared samples were analyzed by a LC-MS/MS on an Orbitrap Elite mass spectrometer coupled with Easy nLC II LC system. Using the Proteome Discoverer 1.4 software suite against human RefSeq 59 protein database, the MS data were analyzed with the applications of 1% peptide spectrum match and peptide-level false discovery rate.
The quantification of lipids and FFAs
Total lipids were extracted using an organic extraction method. Briefly, 2 × 10⁶ MEFs were collected by trypsinization, pelleted, and suspended in 100 µL of PBS. Cell homogenates were mixed with an organic alcohol solvent provided by Cell Biolabs (STA-612-T). The mixture was centrifuged to gravitationally separate the phases. The upper organic phases that contained lipids were collected. The extracted lipids were completely dried with a vacuum drier and then quantified for total lipids (neutral lipids; Cell Biolabs, STA-617) and FFAs (Millipore Sigma, MAK044). The fluorescence intensity of lipid samples was measured by a fluorescent plate reader (FFA: λex = 535/λem = 587 nm; lipid: λex = 490/λem = 585 nm) (BioTek, Synergy H1).
Cellular FA uptake
The FA uptake of MEFs was measured using a dodecanoic acid fluorescent FA substrate (Millipore Sigma, MAK156-1KT). Briefly, 2 × 10⁴ MEFs were placed into each well of the 96-well plate, cultured in glucose-free medium for 4 h, and then incubated with serum- and glucose-free medium for 1 h. One-hundred microliters of TF2-C12 FA solution was added to each well, and the uptake of the substrates into cells, which results in an increase in fluorescence intensity, was read by a plate reader (λex = 485/λem = 515 nm) (BioTek, Synergy H1) in 10-min intervals for 30 min.
FA de novo synthesis
The FA de novo synthesis was measured using [1,2-14C] acetate as described previously with modifications (Lee et al. 2015). Specifically, MEFs were cultured with CM or glucose-free medium supplied with 0.3 µCi [1,2-14C] acetate for 6 h. Lipids were extracted by organic extraction and centrifuge phase separation followed by drying and resuspension (Cell Biolabs STA-612-T). The incorporation of [14C] into lipids was used to measure the de novo synthesis of FAs, which was quantified with a Beckman LS6500 scintillation counter. The radioactivity counts were normalized against protein input levels.
Subcellular fractionation
The cytosolic and nuclear fractions were extracted using a subcellular fractionation kit for cultured cells (Thermo Fisher, 78840). Cytoplasmic and membrane proteins were combined as the cytosolic fraction, and the nuclear-soluble and chromatin-bound proteins were combined as the nuclear fraction.
For isolating lysosomes and LDs, wild-type and C9KO MEFs were cultured in complete culture medium or starved with glucose-free medium for 6 h. After washing with cold PBS twice, 3 × 10⁷ MEFs from each group were harvested for lysosome isolation. The lysosome collection was prepared by gradient centrifugation using the lysosome enrichment kit for tissues and cultured cells (Thermo Fisher, 89839).
LDs were purified as described previously with some modifications (Ding et al. 2013). Briefly, 1 × 10⁸ cells were harvested and pelleted after being washed with cold PBS three times. Cell pellets were suspended in buffer A (20 mM tricine, 250 mM sucrose, 0.2 mM PMSF at pH 7.8) and kept for 20 min on ice. The suspensions were then passed through a 27 gauge, 1 in needle five to 10 times, while the lysis efficiency was monitored under a microscope. Cell suspensions were centrifuged at 3000g for 10 min at 4°C. Supernatants were moved into a tube, and 2 mL of buffer B (20 mM HEPES, 100 mM KCl, 2 mM MgCl2 at pH 7.4) was added carefully on top of the supernatants. After centrifugation at 182,000g for 1 h at 4°C, floating LDs at the top band of the gradient were carefully collected. The collected LDs were washed by centrifugation at 20,000g for 5 min at 4°C and then resuspended in 1 mL of buffer B. After centrifugation at 270,000g for 10 min at 4°C, supernatants were discarded, and the pellets were collected.
SDS-PAGE and Western blotting
All cells were briefly rinsed with cold PBS prior to collection. Both whole cells and subcellular fractions were lysed in RIPA buffer (50 mM Tris at pH 7.5, 150 mM NaCl, 0.5% SDS, 0.5% sarkosyl, 0.5% NP40, 20 mM EDTA, Roche protease inhibitors, 1 mM PMSF) on ice. Protein concentrations of lysates were determined by the bicinchonic acid assay (Thermo Fisher) before being analyzed by SDS-PAGE. The primary antibodies used included anti-CARM1 (Cell Signaling Technology, 3379), anti-skp2 (Santa Cruz Biotechnology, sc-7164), anti-LC3B (Cell Signaling Technology, 3868), anti-LAMP1 (Cell Signaling Technology, 3243), anti-C9orf72 (Bio-Rad VMA00065), anti-PARP (Cell Signaling Technology, 9542), anti-β-actin (Santa Cruz Biotechnology, sc-47778), anti-NOX2 (Abcam, ab129068), anti-ubiquitin (Cell Signaling Technology, 3936), anti-calnexin (Cell Signaling Technology, 2679P), anti-ACC (Cell Signaling Technology, 3676), and anti-ADRP (Progen Biotechnik, GP42).
Immunoprecipitation
Cells were lysed in immunoprecipitation lysis buffer (20 mM Tris-HCl at pH 7.5, 150 mM NaCl, 1 mM Na2EDTA, 1 mM EGTA, 1% Triton, 2.5 mM sodium pyrophosphate, 1 mM β-glycerophosphate, 1 mM Na3VO4, 1 µg/mL leupeptin, cocktail, 1 mM PMSF) on ice, sonicated for 15 min on ice, and centrifuged at 14,000g for 10 min. The resulting supernatants were collected for protein concentration assay and immunoprecipitation. The supernatants were incubated with a specific primary antibody overnight at 4°C with gentle rotation. The mixture was then incubated with protein A magnetic beads for 2 h at 4°C with gentle rotation. For the Flag immunoprecipitation, the supernatants were directly incubated with Flag beads for 2 h at 4°C with gentle rotation. After the incubation, beads were precipitated, and liquids were discarded. After washing with immunoprecipitation lysis buffer five times, beads were incubated in IgG elution buffer (pH 2; Thermo Fisher) for 15 min at room temperature. The liquids were collected and boiled with SDS loading buffer before being analyzed by SDS-PAGE and immunoblotted.
Protein purification and in vitro protein–protein interaction assay
C9orf72-coding sequence fused to C-terminal of 6xHis-SUMO tag was cloned into the pSATL vector and transformed into ArcticExpress (DE3) cells (Agilent Technologies). Transformed cells were grown, harvested, and then resuspended in lysis buffer [20 mM Tris-HCl at pH 8.0, 250 mM NaCl, 100 mM glycine, 1 mM tris(2-carboxyethyl)phosphine (TCEP)] supplemented with 10 mM imidazole, 1 M urea, 1 mM ATP, 1 mM MgCl2, and 1× bestatin, pepstatin A, E-64, and phenylmethylsulfonyl fluoride followed by disruption with a French press. After centrifugation at 16,000g for 20 min at 4°C, the supernatant was loaded to an immobilized metal affinity chromatography (IMAC) column (Bio-Rad) charged with nickel sulfate followed by consecutive washes with lysis buffer, lysis buffer containing 1 M NaCl and lysis buffer containing 75 mM NaCl. C9orf72 protein was then eluted by 250 mM imidazole containing-lysis buffer and desalted with 75 mM NaCl-containing lysis buffer. The resulting protein was then incubated with 6xHis-tagged SUMO-specific protease (SENP) for 1.5 h at 4°C followed by a reverse nickel column purification. The resulting protein was then loaded on a HiTrap Q HP column (GE Healthcare) followed by a HiLoad 26/60 S200 size exclusion column (GE Healthcare) to pool clean fractions with free C9orf72 proteins. For the in vitro protein–protein interaction assay, 2 µg of purified proteins of C9orf72 was mixed with 2 µg of Flag-CARM1 (Active Motif, 81107) in 50 µL of reaction buffer (50 mM Tris-HCl at pH 8, 1% NP40, 150 mM NaCl) and rotated overnight at 4°C. Immunoprecipitation was conducted using Flag beads. C9orf72 pulled down by Flag-CARM1 was analyzed and quantified via SDS-PAGE and immunoblotting. Flag beads only and Flag peptides were used as controls.
Immunofluorescence
Cells were washed three times with PBS and then fixed in 4% paraformaldehyde in PBS for 15 min at room temperature. Fixed cells were permeabilized with 0.3% Triton X-100 and blocked in blocking buffer (1× PBS/5% normal serum/0.1% Towen-20) for 1 h at room temperature. Cells were incubated with primary antibodies overnight at 4°C. After washing three times with PBS, cells were incubated with fluorescently conjugated secondary antibodies for 2 h at room temperature. Cells were again washed three times with PBS and then visualized with an SP8 confocal microscope (Leica). For visualizing LDs, fixed cells were incubated with BODIPY493/503 dye (Invitrogen) at a dilution of 1:1000 for 30 min at room temperature. Primary antibodies applied for the immunofluorescent staining included anti-CARM1 (Cell Signaling Technology, 3379 and 12495; NOVUS, AF7277), anti-C9orf72 (Proteintech Group, 22637-1-AP), anti-LAMP1 (Cell Signaling Technology, 9091 and 15665), anti-calnexin (Cell Signaling Technology, 2679P), and anti-choline acetyltransferase (Millipore, NG1780580). LDs were analyzed by counting positive puncta per cell. Colocalization was analyzed by Pearson's R-value using Coloc 2 in ImageJ software or by counting double-positive puncta per cell.
Quantitative RT-qPCR
Total RNAs were extracted using the RNeasy Plus minikit (Qiagen, 74136), and cDNAs were synthesized using the QuantiTect reverse transcription kit (Qiagen, 205313). RT-qPCR was performed on a Bio-Rad thermal cycler with iQ SYBR Green PCR mix (Bio-Rad). The quantity of mRNA was calculated by the ΔΔCt method, and GAPDH was used as a control. All reactions were performed in triplicate. The following primers were used: human GAPDH (fwd, 5′-AAGGTGAAGGTCGGAGTCAAC-3′; rev, 5′-GGGGTCATTGATGGCAACAATA-3′), human CARM1 (fwd, 5′-TCGCCACACCCAACGATTT-3′; rev, 5′-GTACTGCACGGCAGAAGACT-3′), mouse GAPDH (fwd, 5′-AAGGTCATCCCAGAGCTGAA-3′; rev, 5′-CTGCTTCACCACCTTCTTGA-3′), mouse CARM1 (fwd, 5′-ATGAGCACGGGCATTGTCCAAG-3′; rev 5′-TTGACTGCATAGTGGGCACTGG-3′), and the mouse homolog of ACC (fwd, 5′-ATGGGCGGAATGGTCTCTTTC-3′; rev, 5′-TGGGGACCTTGTCTTCATCAT-3′).
ChIP-qPCR and ChIP-seq analysis
MEFs (2 × 10⁷) were cross-linked using 1% formaldehyde for 10 min at room temperature and quenched with glycine at a final concentration of 125 mM for 5 min. Cells were lysed in ChIP lysis buffer (50 mM HEPES-KOH at pH 7.5, 140 mM NaCl, 1 mM EDTA at pH 8, 0.1% sodium deoxycholate, 0.1% sodium deoxycholate, protease inhibitors). Lysates were sonicated to shear DNA to an average fragment size of 200–500 base pairs (bp) and centrifuged at 8000g for 10 min at 4°C. Supernatants were diluted 10 times with dilution buffer (50 mM Tris-HCl at pH 8, 150 mM NaCl, 2 mM EDTA at pH 8, 1% NP40, 0.5% sodium deoxycholate, protease inhibitors) and incubated with anti-CARM1 (Cell Signaling Technology, 12495) or anti-H3R17me2 (Abcam, ab8284) for 1 h at 4°C. The mixed samples were immunoprecipitated overnight at 4°C with 60 µL of protein A/G beads, which were blocked with 75 ng of single-stranded herring sperm DNA per microliter of beads and 0.1 µg of BSA per microliter of beads. After immunoprecipitation, beads were washed with low-salt wash buffer (0.1% SDS, 1% Triton X-100, 2 mM EDTA, 2 mM EDTA, 150 mM NaCl), high-salt wash buffer (0.1% SDS, 1% Triton X-100, 2 mM EDTA, 2 mM EDTA, 500 mM NaCl), LiCl buffer (0.25 M LiCl, 0.25 M LiCl, 1% sodium deoxycholate, 1 mM EDTA, 10 mM Tris-HCl at pH 8.0), and TE buffer (10 mM Tris at pH 8.0, 1 mM EDTA) and eluted in elution buffer (1% SDS, 100 mM NaHCO3). The supernatants were decross-linked and digested by adding 2 µL of RNase A and incubated overnight at 65°C with shaking. Samples were then digested with proteinase K for 1 h at 60°C. ChIP and input DNAs were purified, and qRT–PCR was applied to measure the enrichment of bound DNAs. The primers targeting the promoter region of the mouse gene encoding ACC (NCBI 107476: Acaca) were designed according to previously reported ChIP-seq data (Shin et al. 2016). The following primers were used: primer set 1 (fwd, 5′-ATCTAATAACCTGGCCTTCA-3′; rev, 5′-GGTTCTCCTATCCGCTAA-3′), primer set 2 (fwd, 5′-CGGAACCTGGGAGGAGTA-3′; rev, 5′-AGGGCAGAATCTCCACTCACAT-3′), Atg14 (fwd, 5′-GAGACGCCATGATGATCTGA-3′; rev, 5′-GCCAAGGAGTGTGGGAAGTA-3′), and Map1lc3b (fwd, 5′-AGCCAGTGGGATATTGGTCT-3′; rev, 5′-AG AGCCTGCGGTACCCTAC-3′). The qPCR data were normalized against the input and the IgG controls. The data sets for H3R17me2 ChIP-seq were acquired from the NCBI Gene Expression Omnibus (GEO) database (GSE72901) (Shin et al. 2016) and uploaded to the Galaxy Web platform (Afgan et al. 2016) for analysis. Reads were aligned to the mouse genome (mm9) using Bowtie2. Only uniquely mapped reads were retained, and duplicate reads with mapping quality <20 were filtered out using SAMtools. The H3R17me2 peaks were identified using MACS2 with optimal parameters (q-value < 0.05, extension size: 141 bp) obtained from the MACS2 predicted tool. The read coverage distribution and predicted peaks at the locus were displayed in Integrative Genomics Viewer (IGV) browser.
Animal studies
The C9KO mice were generated in our previous study (Ugolino et al. 2016). The animal protocol was approved by the Johns Hopkins Animal Care and Use Committee following the National Research Council's guidance of the Care and Use of Laboratory Animals. Wild-type and C9KO mice were fed or fasted for 24 h. The brains were then isolated, and the cortex tissue lysate was prepared for Western blotting analysis. The mouse tissues were lysed in modified RIPA buffer (50 mM Tris at pH 7.5, 150 mM NaCl, 1% NP40, 0.1% SDS, 100 mM NaF, 17.5 mM β-glycerophosphate, 2.5% sodium deoxycholate, 10% glycerol, 1 mM PMSF, cocktail). Samples were sonicated and then centrifuged at 12,000g for 10 min at 4°C. Supernatants were then harvested for Western blotting.
Human tissue sample preparation
Human spinal cord tissues were obtained from Johns Hopkins Medical Institute and Department of Veterans Affairs Biorepository Brain Bank (Supplemental Table S2). Tissues were weighed and homogenized with 10 times the sample's volume of modified RIPA buffer (50 mM Tris at pH 7.5, 150 mM NaCl, 1% NP40, 0.1% SDS, 100 mM NaF, 17.5 mM β-glycerophosphate, 2.5% sodium deoxycholate, 10% glycerol) containing phosphatase inhibitors 2 and 3 (1:100; Millipore Sigma), 1 mM PMSF, 2 mM NaVO4, and protease inhibitor (1:200; Millipore Sigma). Samples were then sonicated and diluted with the modified RIPA buffer. After centrifugation at 12,000g for 10 min at 4°C, supernatants were collected for Western blotting.
Differentiation of iPSCs to motor neurons
The iPSCs were obtained from the National Institutes of Health-sponsored repository (Supplemental Table S2). The method for differentiating human iPSCs into motor neurons was adapted from a previous report (Du et al. 2015). The iPSCs were plated on Matrigel-coated plates prior to differentiation. Neuroepithelial progenitor (NEP) cells were generated from iPSCs using neural medum (1:1 DMEM/F12:neurobasal medium, glutamax, N2 supplement, B27 supplement, ascorbic acid), supplemented with 3 µM CHIR99021, 2 µM SB431542, and 2 µM DMH-1 for 6 d, changing medium every other day. NEP cells were then disassociated using 1 U/mL dispase and split approximately 1:6 onto new Matrigel-coated plates. Neural medium supplemented with 1 µM CHIR99021, 2 µM SB431542, 2 µM DMH-1, 0.1 µM retinoic acid (RA), and 0.5 µM purmorphamine was used to generate motor neuron progenitor (MNP) cells from NEPs. The medium was changed every other day for 6 d. To generate motor neuron-like cells, MNPs were disassociated with 1 U/mL dispase and placed in suspension culture using neural medium supplemented with 0.5 µM RA and 0.1 µM purmorphamine, changing medium every other day. After 6 d, motor neuron-like cells were disassociated and plated onto Matrigel-coated plates. Mature motor neurons were generated in 12 d using neural medium supplemented with 0.5 µM RA, 0.1 µM purmorphamine, and 0.1 µM compound E, changing medium every other day.
Statistical analysis
All experiments were independently repeated at least three times. For single comparison, data were statistically analyzed with Student's t-test. For multiple means of comparison, one-way analysis of variance (ANOVA) was performed followed by the Bonferroni post-hoc test to determine statistical significance. The sample size n represents biological replicates. For enrichment analysis, Fisher's test was performed.
Supplementary Material
Acknowledgments
We thank the National Institute of Neurological Disorders and Stroke repository, the Target ALS Human Postmortem Tissue Core, Dr. Lyle Ostrow at Johns Hopkins University, and the Department of Veterans Affairs Biorepository Brain Bank for providing patient cells and tissues; Chan-Hyun Na for proteomic analysis; Xia Feng for advice on iPSC and motor neuron culturing; and Michael Wolfgan and members of the Wang laboratory for discussion. This work was supported by grants from the National Institutes of Health (NS074324 and NS089616), Packard Center for ALS Research at Johns Hopkins, the ALS Association, and the Muscular Dystrophy Association.
Author contributions: Y.L. and J.W. designed the study. Y.L. performed most of the experiments. T.W. conducted the proteomic analysis. Y.J.J. performed the CARM1 coimmunoprecipitation analysis. K.J. performed iPSC characterization and motor neuron differentiation. H.L. conducted C9orf72 cloning and protein purification. K.J. and S.B. helped with protein purification. Y.-N.L. performed the analysis of nuclear and cytoplasmic CARM1 proteins. Y.S. helped with ChIP and immunostaining analysis. M.L. contributed to the analysis of CARM1 target DNA sequences. Y.L. and J.W. wrote the paper with contribution from T.W.
Footnotes
Supplemental material is available for this article.
Article published online ahead of print. Article and publication date are online at http://www.genesdev.org/cgi/doi/10.1101/gad.315564.118.
References
- Afgan E, Baker D, van den Beek M, Blankenberg D, Bouvier D, Cech M, Chilton J, Clements D, Coraor N, Eberhard C, et al. 2016. The Galaxy platform for accessible, reproducible and collaborative biomedical analyses: 2016 update. Nucleic Acids Res 44: W3–W10. [DOI] [PMC free article] [PubMed] [Google Scholar]
- Amick J, Roczniak-Ferguson A, Ferguson SM. 2016. C9orf72 binds SMCR8, localizes to lysosomes and regulates mTORC1 signaling. Mol Biol Cell 27: 3040–3051. [DOI] [PMC free article] [PubMed] [Google Scholar]
- Aoki Y, Manzano R, Lee Y, Dafinca R, Aoki M, Douglas AGL, Varela MA, Sathyaprakash C, Scaber J, Barbagallo P, et al. 2017. C9orf72 and RAB7L1 regulate vesicle trafficking in amyotrophic lateral sclerosis and frontotemporal dementia. Brain 140: 887–897. [DOI] [PubMed] [Google Scholar]
- Belzil VV, Bauer PO, Prudencio M, Gendron TF, Stetler CT, Yan IK, Pregent L, Daughrity L, Baker MC, Rademakers R, et al. 2013. Reduced C9orf72 gene expression in c9FTD/ALS is caused by histone trimethylation, an epigenetic event detectable in blood. Acta Neuropathol 126: 895–905. [DOI] [PMC free article] [PubMed] [Google Scholar]
- Bouteloup C, Desport JC, Clavelou P, Guy N, Derumeaux-Burel H, Ferrier A, Couratier P. 2009. Hypermetabolism in ALS patients: an early and persistent phenomenon. J Neurol 256: 1236–1242. [DOI] [PubMed] [Google Scholar]
- Burberry A, Suzuki N, Wang JY, Moccia R, Mordes DA, Stewart MH, Suzuki-Uematsu S, Ghosh S, Singh A, Merkle FT, et al. 2016. Loss-of-function mutations in the C9ORF72 mouse ortholog cause fatal autoimmune disease. Sci Transl Med 8: 347ra393. [DOI] [PMC free article] [PubMed] [Google Scholar]
- Cabodevilla AG, Sanchez-Caballero L, Nintou E, Boiadjieva VG, Picatoste F, Gubern A, Claro E. 2013. Cell survival during complete nutrient deprivation depends on lipid droplet-fueled β-oxidation of fatty acids. J Biol Chem 288: 27777–27788. [DOI] [PMC free article] [PubMed] [Google Scholar]
- Ciura S, Lattante S, Le Ber I, Latouche M, Tostivint H, Brice A, Kabashi E. 2013. Loss of function of C9orf72 causes motor deficits in a zebrafish model of amyotrophic lateral sclerosis. Ann Neurol 74: 180–187. [DOI] [PubMed] [Google Scholar]
- Currie E, Schulze A, Zechner R, Walther TC, Farese RV Jr. 2013. Cellular fatty acid metabolism and cancer. Cell Metab 18: 153–161. [DOI] [PMC free article] [PubMed] [Google Scholar]
- DeJesus-Hernandez M, Mackenzie IR, Boeve BF, Boxer AL, Baker M, Rutherford NJ, Nicholson AM, Finch NA, Flynn H, Adamson J, et al. 2011. Expanded GGGGCC hexanucleotide repeat in noncoding region of C9ORF72 causes chromosome 9p-linked FTD and ALS. Neuron 72: 245–256. [DOI] [PMC free article] [PubMed] [Google Scholar]
- Ding Y, Zhang S, Yang L, Na H, Zhang P, Zhang H, Wang Y, Chen Y, Yu J, Huo C, et al. 2013. Isolating lipid droplets from multiple species. Nat Protoc 8: 43–51. [DOI] [PubMed] [Google Scholar]
- Donnelly CJ, Zhang PW, Pham JT, Heusler AR, Mistry NA, Vidensky S, Daley EL, Poth EM, Hoover B, Fines DM, et al. 2013. RNA toxicity from the ALS/FTD C9ORF72 expansion is mitigated by antisense intervention. Neuron 80: 415–428. [DOI] [PMC free article] [PubMed] [Google Scholar]
- Dorst J, Kuhnlein P, Hendrich C, Kassubek J, Sperfeld AD, Ludolph AC. 2011. Patients with elevated triglyceride and cholesterol serum levels have a prolonged survival in amyotrophic lateral sclerosis. J Neurol 258: 613–617. [DOI] [PubMed] [Google Scholar]
- Du L, Hickey RW, Bayir H, Watkins SC, Tyurin VA, Guo F, Kochanek PM, Jenkins LW, Ren J, Gibson G, et al. 2009. Starving neurons show sex difference in autophagy. J Biol Chem 284: 2383–2396. [DOI] [PMC free article] [PubMed] [Google Scholar]
- Du ZW, Chen H, Liu H, Lu J, Qian K, Huang CL, Zhong X, Fan F, Zhang SC. 2015. Generation and expansion of highly pure motor neuron progenitors from human pluripotent stem cells. Nat Commun 6: 6626. [DOI] [PMC free article] [PubMed] [Google Scholar]
- Dupuis L, Corcia P, Fergani A, Gonzalez De Aguilar JL, Bonnefont-Rousselot D, Bittar R, Seilhean D, Hauw JJ, Lacomblez L, Loeffler JP, et al. 2008. Dyslipidemia is a protective factor in amyotrophic lateral sclerosis. Neurology 70: 1004–1009. [DOI] [PubMed] [Google Scholar]
- Dupuis L, Pradat PF, Ludolph AC, Loeffler JP. 2011. Energy metabolism in amyotrophic lateral sclerosis. Lancet Neurol 10: 75–82. [DOI] [PubMed] [Google Scholar]
- Eastman SW, Yassaee M, Bieniasz PD. 2009. A role for ubiquitin ligases and Spartin/SPG20 in lipid droplet turnover. J Cell Biol 184: 881–894. [DOI] [PMC free article] [PubMed] [Google Scholar]
- Farg MA, Sundaramoorthy V, Sultana JM, Yang S, Atkinson RA, Levina V, Halloran MA, Gleeson PA, Blair IP, Soo KY, et al. 2014. C9ORF72, implicated in amytrophic lateral sclerosis and frontotemporal dementia, regulates endosomal trafficking. Hum Mol Genet 23: 3579–3595. [DOI] [PMC free article] [PubMed] [Google Scholar]
- Fujimoto T, Parton RG. 2011. Not just fat: the structure and function of the lipid droplet. Cold Spring Harb Perspect Biol 3: a004838. [DOI] [PMC free article] [PubMed] [Google Scholar]
- Gijselinck I, Van Langenhove T, van der Zee J, Sleegers K, Philtjens S, Kleinberger G, Janssens J, Bettens K, Van Cauwenberghe C, Pereson S, et al. 2012. A C9orf72 promoter repeat expansion in a Flanders-Belgian cohort with disorders of the frontotemporal lobar degeneration-amyotrophic lateral sclerosis spectrum: a gene identification study. Lancet Neurol 11: 54–65. [DOI] [PubMed] [Google Scholar]
- Haeusler AR, Donnelly CJ, Periz G, Simko EA, Shaw PG, Kim MS, Maragakis NJ, Troncoso JC, Pandey A, Sattler R, et al. 2014. C9orf72 nucleotide repeat structures initiate molecular cascades of disease. Nature 507: 195–200. [DOI] [PMC free article] [PubMed] [Google Scholar]
- Inoguchi T, Li P, Umeda F, Yu HY, Kakimoto M, Imamura M, Aoki T, Etoh T, Hashimoto T, Naruse M, et al. 2000. High glucose level and free fatty acid stimulate reactive oxygen species production through protein kinase C-dependent activation of NAD(P)H oxidase in cultured vascular cells. Diabetes 49: 1939–1945. [DOI] [PubMed] [Google Scholar]
- Jung J, Nayak A, Schaeffer V, Starzetz T, Kirsch AK, Muller S, Dikic I, Mittelbronn M, Behrends C. 2017. Multiplex image-based autophagy RNAi screening identifies SMCR8 as ULK1 kinase activity and gene expression regulator. Elife 6: e23063. [DOI] [PMC free article] [PubMed] [Google Scholar]
- Kaushik S, Cuervo AM. 2015. Degradation of lipid droplet-associated proteins by chaperone-mediated autophagy facilitates lipolysis. Nat Cell Biol 17: 759–770. [DOI] [PMC free article] [PubMed] [Google Scholar]
- Kosugi S, Hasebe M, Tomita M, Yanagawa H. 2009. Systematic identification of cell cycle-dependent yeast nucleocytoplasmic shuttling proteins by prediction of composite motifs. Proc Natl Acad Sci 106: 10171–10176. [DOI] [PMC free article] [PubMed] [Google Scholar]
- Lee J, Ellis JM, Wolfgang MJ. 2015. Adipose fatty acid oxidation is required for thermogenesis and potentiates oxidative stress-induced inflammation. Cell Rep 10: 266–279. [DOI] [PMC free article] [PubMed] [Google Scholar]
- Levine TP, Daniels RD, Gatta AT, Wong LH, Hayes MJ. 2013. The product of C9orf72, a gene strongly implicated in neurodegeneration, is structurally related to DENN Rab-GEFs. Bioinformatics 29: 499–503. [DOI] [PMC free article] [PubMed] [Google Scholar]
- Liu EY, Russ J, Wu K, Neal D, Suh E, McNally AG, Irwin DJ, Van Deerlin VM, Lee EB. 2014. C9orf72 hypermethylation protects against repeat expansion-associated pathology in ALS/FTD. Acta Neuropathol 128: 525–541. [DOI] [PMC free article] [PubMed] [Google Scholar]
- Liu F, Liu Q, Lu CX, Cui B, Guo XN, Wang RR, Liu MS, Li XG, Cui LY, Zhang X. 2016. Identification of a novel loss-of-function C9orf72 splice site mutation in a patient with amyotrophic lateral sclerosis. Neurobiol Aging 47: 219.e1–219.e5. [DOI] [PubMed] [Google Scholar]
- Maharjan N, Kunzli C, Buthey K, Saxena S. 2017. C9ORF72 regulates stress granule formation and its deficiency impairs stress granule assembly, hypersensitizing cells to stress. Mol Neurobiol 54: 3062–3077. [DOI] [PubMed] [Google Scholar]
- Marat AL, Dokainish H, McPherson PS. 2011. DENN domain proteins: regulators of Rab GTPases. J Biol Chem 286: 13791–13800. [DOI] [PMC free article] [PubMed] [Google Scholar]
- Marden JJ, Harraz MM, Williams AJ, Nelson K, Luo M, Paulson H, Engelhardt JF. 2007. Redox modifier genes in amyotrophic lateral sclerosis in mice. J Clin Invest 117: 2913–2919. [DOI] [PMC free article] [PubMed] [Google Scholar]
- McGoldrick P, Zhang M, van Blitterswijk M, Sato C, Moreno D, Xiao S, Zhang AB, McKeever PM, Weichert A, Schneider R, et al. 2018. Unaffected mosaic C9orf72 case: RNA foci, dipeptide proteins, but upregulated C9orf72 expression. Neurology 90: e323–e331. [DOI] [PMC free article] [PubMed] [Google Scholar]
- Mori K, Weng SM, Arzberger T, May S, Rentzsch K, Kremmer E, Schmid B, Kretzschmar HA, Cruts M, Van Broeckhoven C, et al. 2013. The C9orf72 GGGGCC repeat is translated into aggregating dipeptide-repeat proteins in FTLD/ALS. Science 339: 1335–1338. [DOI] [PubMed] [Google Scholar]
- Nixon RA. 2013. The role of autophagy in neurodegenerative disease. Nat Med 19: 983–997. [DOI] [PubMed] [Google Scholar]
- O'Rourke JG, Bogdanik L, Yanez A, Lall D, Wolf AJ, Muhammad AK, Ho R, Carmona S, Vit JP, Zarrow J, et al. 2016. C9orf72 is required for proper macrophage and microglial function in mice. Science 351: 1324–1329. [DOI] [PMC free article] [PubMed] [Google Scholar]
- Patel H, Cross H, Proukakis C, Hershberger R, Bork P, Ciccarelli FD, Patton MA, McKusick VA, Crosby AH. 2002. SPG20 is mutated in Troyer syndrome, an hereditary spastic paraplegia. Nat Genet 31: 347–348. [DOI] [PubMed] [Google Scholar]
- Rambold AS, Cohen S, Lippincott-Schwartz J. 2015. Fatty acid trafficking in starved cells: regulation by lipid droplet lipolysis, autophagy, and mitochondrial fusion dynamics. Dev Cell 32: 678–692. [DOI] [PMC free article] [PubMed] [Google Scholar]
- Renton Alan E, Majounie E, Waite A, Simón-Sánchez J, Rollinson S, Gibbs JR, Schymick Jennifer C, Laaksovirta H, van Swieten John C, Myllykangas L, et al. 2011. A hexanucleotide repeat expansion in C9ORF72 is the cause of chromosome 9p21-linked ALS–FTD. Neuron 72: 257–268. [DOI] [PMC free article] [PubMed] [Google Scholar]
- Sanchez G, Dury AY, Murray LM, Biondi O, Tadesse H, El Fatimy R, Kothary R, Charbonnier F, Khandjian EW, Cote J. 2013. A novel function for the survival motoneuron protein as a translational regulator. Hum Mol Genet 22: 668–684. [DOI] [PubMed] [Google Scholar]
- Sanjana NE, Shalem O, Zhang F. 2014. Improved vectors and genome-wide libraries for CRISPR screening. Nat Methods 11: 783–784. [DOI] [PMC free article] [PubMed] [Google Scholar]
- Sellier C, Campanari ML, Julie Corbier C, Gaucherot A, Kolb-Cheynel I, Oulad-Abdelghani M, Ruffenach F, Page A, Ciura S, Kabashi E, et al. 2016. Loss of C9ORF72 impairs autophagy and synergizes with polyQ Ataxin-2 to induce motor neuron dysfunction and cell death. EMBO J 35: 1276–1297. [DOI] [PMC free article] [PubMed] [Google Scholar]
- Seo AY, Lau PW, Feliciano D, Sengupta P, Gros MAL, Cinquin B, Larabell CA, Lippincott-Schwartz J. 2017. AMPK and vacuole-associated Atg14p orchestrate µ-lipophagy for energy production and long-term survival under glucose starvation. Elife 6: e21690. [DOI] [PMC free article] [PubMed] [Google Scholar]
- Settembre C, Di Malta C, Polito VA, Garcia Arencibia M, Vetrini F, Erdin S, Erdin SU, Huynh T, Medina D, Colella P, et al. 2011. TFEB links autophagy to lysosomal biogenesis. Science 332: 1429–1433. [DOI] [PMC free article] [PubMed] [Google Scholar]
- Settembre C, De Cegli R, Mansueto G, Saha PK, Vetrini F, Visvikis O, Huynh T, Carissimo A, Palmer D, Klisch TJ, et al. 2013. TFEB controls cellular lipid metabolism through a starvation-induced autoregulatory loop. Nat Cell Biol 15: 647–658. [DOI] [PMC free article] [PubMed] [Google Scholar]
- Shi Y, Lin S, Staats KA, Li Y, Chang WH, Hung ST, Hendricks E, Linares GR, Wang Y, Son EY, et al. 2018. Haploinsufficiency leads to neurodegeneration in C9ORF72 ALS/FTD human induced motor neurons. Nat Med 24: 313–325. [DOI] [PMC free article] [PubMed] [Google Scholar]
- Shin HJ, Kim H, Oh S, Lee JG, Kee M, Ko HJ, Kweon MN, Won KJ, Baek SH. 2016. AMPK–SKP2–CARM1 signalling cascade in transcriptional regulation of autophagy. Nature 534: 553–557. [DOI] [PMC free article] [PubMed] [Google Scholar]
- Singh R, Kaushik S, Wang Y, Xiang Y, Novak I, Komatsu M, Tanaka K, Cuervo AM, Czaja MJ. 2009. Autophagy regulates lipid metabolism. Nature 458: 1131–1135. [DOI] [PMC free article] [PubMed] [Google Scholar]
- Sullivan PM, Zhou X, Robins AM, Paushter DH, Kim D, Smolka MB, Hu F. 2016. The ALS/FTLD associated protein C9orf72 associates with SMCR8 and WDR41 to regulate the autophagy–lysosome pathway. Acta Neuropathol Commun 4: 51. [DOI] [PMC free article] [PubMed] [Google Scholar]
- Taylor JP, Brown RH Jr, Cleveland DW. 2016. Decoding ALS: from genes to mechanism. Nature 539: 197–206. [DOI] [PMC free article] [PubMed] [Google Scholar]
- Troffer-Charlier N, Cura V, Hassenboehler P, Moras D, Cavarelli J. 2007. Functional insights from structures of coactivator-associated arginine methyltransferase 1 domains. EMBO J 26: 4391–4401. [DOI] [PMC free article] [PubMed] [Google Scholar]
- Ugolino J, Ji YJ, Conchina K, Chu J, Nirujogi RS, Pandey A, Brady NR, Hamacher-Brady A, Wang J. 2016. Loss of C9orf72 enhances autophagic activity via deregulated mTOR and TFEB signaling. PLoS Genet 12: e1006443. [DOI] [PMC free article] [PubMed] [Google Scholar]
- Vaisman N, Lusaus M, Nefussy B, Niv E, Comaneshter D, Hallack R, Drory VE. 2009. Do patients with amyotrophic lateral sclerosis (ALS) have increased energy needs? J Neurol Sci 279: 26–29. [DOI] [PubMed] [Google Scholar]
- van Blitterswijk M, Gendron TF, Baker MC, DeJesus-Hernandez M, Finch NA, Brown PH, Daughrity LM, Murray ME, Heckman MG, Jiang J, et al. 2015. Novel clinical associations with specific C9ORF72 transcripts in patients with repeat expansions in C9ORF72. Acta Neuropathol 130: 863–876. [DOI] [PMC free article] [PubMed] [Google Scholar]
- Waite AJ, Baumer D, East S, Neal J, Morris HR, Ansorge O, Blake DJ. 2014. Reduced C9orf72 protein levels in frontal cortex of amyotrophic lateral sclerosis and frontotemporal degeneration brain with the C9ORF72 hexanucleotide repeat expansion. Neurobiol Aging 35: 1779.e5–1779.e13. [DOI] [PMC free article] [PubMed] [Google Scholar]
- Webster CP, Smith EF, Bauer CS, Moller A, Hautbergue GM, Ferraiuolo L, Myszczynska MA, Higginbottom A, Walsh MJ, Whitworth AJ, et al. 2016. The C9orf72 protein interacts with Rab1a and the ULK1 complex to regulate initiation of autophagy. EMBO J 35: 1656–1676. [DOI] [PMC free article] [PubMed] [Google Scholar]
- Wilfling F, Haas JT, Walther TC, Farese RV Jr. 2014. Lipid droplet biogenesis. Curr Opin Cell Biol 29: 39–45. [DOI] [PMC free article] [PubMed] [Google Scholar]
- Wu DC, Re DB, Nagai M, Ischiropoulos H, Przedborski S. 2006. The inflammatory NADPH oxidase enzyme modulates motor neuron degeneration in amyotrophic lateral sclerosis mice. Proc Natl Acad Sci 103: 12132–12137. [DOI] [PMC free article] [PubMed] [Google Scholar]
- Xi Z, Zinman L, Moreno D, Schymick J, Liang Y, Sato C, Zheng Y, Ghani M, Dib S, Keith J, et al. 2013. Hypermethylation of the CpG island near the G4C2 repeat in ALS with a C9orf72 expansion. Am J Hum Genet 92: 981–989. [DOI] [PMC free article] [PubMed] [Google Scholar]
- Yamamoto A, Yue Z. 2014. Autophagy and its normal and pathogenic states in the brain. Annu Rev Neurosci 37: 55–78. [DOI] [PubMed] [Google Scholar]
- Yang Y, Bedford MT. 2013. Protein arginine methyltransferases and cancer. Nat Rev Cancer 13: 37–50. [DOI] [PubMed] [Google Scholar]
- Yang M, Liang C, Swaminathan K, Herrlinger S, Lai F, Shiekhattar R, Chen JF. 2016. A C9ORF72/SMCR8-containing complex regulates ULK1 and plays a dual role in autophagy. Sci Adv 2: e1601167. [DOI] [PMC free article] [PubMed] [Google Scholar]
- Zhang D, Iyer LM, He F, Aravind L. 2012. Discovery of novel DENN proteins: implications for the evolution of eukaryotic intracellular membrane structures and human disease. Front. Genet. 3: 283. [DOI] [PMC free article] [PubMed] [Google Scholar]
Associated Data
This section collects any data citations, data availability statements, or supplementary materials included in this article.