

Abstract
A novel family of bacterial hemoproteins named NosP has been discovered recently; its members are proposed to function as nitric oxide (NO) responsive proteins involved in bacterial group behaviors such as quorum sensing and biofilm growth and dispersal. Currently, little is known about molecular activation mechanisms in NosP. Here, functional studies were performed utilizing the distinct spectroscopic characteristics associated with the NosP heme cofactor. NosPs from Pseudomonas aeruginosa (Pa), Vibrio cholerae (Vc) and Legionella pneumophila (Lpg) were studied in their ferrous-unligated forms as well as their ferrous-CO, ferrous-NO, and ferric-CN adducts. The resonance Raman (rR) data collected on the ferric forms strongly support the existence of a distorted heme-cofactor, which is a common feature in NO sensors. The ferrous spectra exhibit a 213 cm−1 feature, which is assigned to the Fe-Nhis stretching mode. The Fe-C and C-O frequencies in the spectra of ferrous-CO NosP complexes are inversely correlated with relatively similar frequencies, consistent with a proximal histidine ligand and a relatively hydrophobic environment. The rR spectra obtained for isotopically labeled ferrous-NO adducts provide evidence of formation of a 5-coordinate NO complex, resulting from proximal Fe-Nhis cleavage, which is believed to play a role in biological heme-NO signal transduction. Additionally, we found that of the three NosPs studied, Lpg NosP contains the most electropositive ligand binding pocket, while Pa NosP has the most electronegative ligand binding pocket. This pattern is also observed in the measured heme reduction potentials for these three proteins, which may indicate distinct functions for each.
Graphical Abstract

Introduction
While at high concentrations nitric oxide (NO) is a cytotoxic gas, at low concentrations this molecule plays an important role in signal transduction.1, 2 In mammals, NO is generated from L-arginine by nitric oxide synthase (NOS)3, 4 and diffuses across cell membranes to activate the NO sensor soluble guanylate cyclase (sGC).5 This is important for a variety of signaling pathways including vasodilation and neurotransmission.6 Recently it has been reported that bacteria also respond to sub-micromolar concentrations of NO, such as in symbiotic signaling between V. fischeri and E. scolopes.2
So far, two classes of bacterial NO sensing proteins have been reported: heme-nitric oxide/oxygen binding domains (H-NOXs) and nitric oxide sensing proteins (NosPs). H-NOX proteins were discovered based on sequence homology with the sGC heme-binding domain.7 NO-ligated H-NOX effectively regulates cyclic di-GMP and histidine kinase signaling pathways in a variety of bacterial species; H-NOX proteins have been reviewed extensively.8–10
In bacteria that lack H-NOX domains, NosP proteins may serve as the primary NO sensor, as demonstrated in P. aeruginosa.11 NosP proteins are predicted to be particularly important in the regulation of biofilm formation in bacteria,12 a bacterial group behavior that involves the secretion of a protective polysaccharide matrix and is associated with chronic infection and antibiotic drug resistance.13–17 Understanding structural mechanics that underlie NosP ligand binding and initiation of signal transduction is a vital step in understanding this novel class of proteins and in the potential development of future antibiotic applications.
NosP proteins from P. aeruginosa, V. cholerae, and L. pneumophila were chosen for this study as they are predicted to, or have been shown to, participate in pathways that modulate biofilm or quorum sensing behaviors. NO-bound Pa NosP has been shown to regulate the activity of a co-cistronic histidine kinase that is required for NO-dependent biofilm reduction.11 NO-bound Vc NosP has been demonstrated to regulate the autophosphorylation activity18 of the quorum sensing kinase VpsS,19–21 and Lpg NosP modulates a co-cistronic kinase (Fischer, et al. unpublished data) whose cognate response regulator has been shown to result in a hyper-biofilm phenotype when deleted.21, 22
Resonance Raman (rR) spectroscopy is an effective tool to detect the structures of heme proteins and their intermediates.23 Model compounds and isotope labeling have been used to identify heme macrocycle modes.24, 25 The high-frequency region of a rR spectrum contains marker bands that are sensitive to oxidation state and spin state changes,26 whereas the low-frequency region provides information on the porphyrin macrocycle structure and its peripheral substituents,27 including both in-plane and out-of-plane features that are sensitive to the distinction of propionate and vinyl groups.27, 28 This is important because documenting the interaction between these peripheral groups and the protein can elucidate the structural effects resulting from heme-ligand binding.29, 30 Of special import for this work, it is possible to interrogate the status of Fe-X-Y fragments of CO, NO and O2-ligated forms.31 The results obtained here suggest that upon binding of the NO molecule, NosP proteins form a 5-coordinate NO species by displacing a proximal histidine ligand.
Experimental Procedures
Materials and general methods.
All reagents were obtained in their highest available purity and used as received. DEA NONOATE was purchased from Caymen Chemical (CAS 372965-00-9; purity ≥98%). Carbon monoxide (40%, balanced with hydrogen) was introduced from a gas tank directly bubbled into dithionite solution to create a saturated CO solution (Airgas, 99.3% pure). Sodium dithionite was purchased from Sigma Aldrich, in technical grade. Sodium nitrite was purchased from Fisher Scientific, in laboratory grade, and sodium nitrate-15N (99% atom %) was purchased from MSD isotopes (Division of Merck Frost Canada INC.)
Gene cloning.
NosP from Pa, Vc and Lpg (Accession numbers Q9I2D0, Q9KS17 and Q5ZYT2) were cloned as described previously11 with 6xHis tag. All plasmids were confirmed by DNA sequencing.
Protein expression and purification.
NosP from Pa, Lpg, and Vc plasmids were transformed into BL21 cells and grown in 1L yeast extract media (45 grams yeast extract, 90mM sodium phosphate pH 7.4) at 37° C. At OD=0.5, the media was supplemented with 20μM hemin (Sigma) and at OD=0.6 the protein was induced with 10μM IPTG at 16°C overnight. Cells were pelleted and lysed in lysis buffer (20mM Tris pH 8.0 at 4.0°C, 300mM NaCl, 1mM PMSF, 5mM 2-mercaptoethanol, 10% glycerol, 0.1mM EDTA, 0.3mM hemin, 1% Triton X-100) by sonication. The protein was purified from cleared lysate by Ni-NTA (Qiagen) using wash buffer (20mM Tris pH 8.0 at 4.0°C, 300mM NaCl, 1mM PMSF, 5mM 2-mercaptoethanol, 10% glycerol, 0.1mM EDTA, 4μM hemin) with increasing steps of imidazole (10, 20 and 50 mM imidazole). NosP was eluted with wash buffer and 250mM imidazole and desalted into storage buffer (20mM Tris pH 8.0 at 4.0°C, 100mM NaCl, 10% glycerol, 5mM 2-mercaptoethanol) and incubated in 0.3mM hemin (Sigma) over night at 4°C. The next day, NosP is concentrated in a 10kDa concentrator and unbound hemin is removed by FPLC (AKTA) gel filtration (Superdex200, GE). Fractions are analyzed by comparing A410/A280 to assess heme incorporation and stored at −80°C.
Mass Spectrometry.
Pa NosP purified from BL21 cells not supplemented with exogenous heme during purification was tested by LC/UV/MS to confirm the presence and character of its heme cofactor. Samples were run on AerisPeptide-XB-C18 (2.6 µm, 300Å, 150×2.1mm) with a linear gradient from 95% H2O (0.1% Ac, 0.02% TFA) 5% CH3CN (0.1%CN 0.2% TFA) to 5% H2O (0.1% Ac, 0.02% TFA) 95% CH3CN (0.1%CN 0.2% TFA) over 30 min at 0.4 mL/min, 35 °C. Mass data was acquired using TOF 4Ghz HiRes 3200, ESI m/z=250–3200, 1Hz. Absorbance was acquired with a diode array 4nm slit, 2nm step 0.2mAU threshold, 5Hz acquisition.
Complex preparation for absorbance spectroscopy.
NosP complexes are prepared in an anaerobic chamber (COY). Samples were incubated with 10 mM potassium ferricyanide for 10 min to oxidize the heme and then desalted by PD-10 gel filtration (GE) to remove ferricyanide. A 600 mM dithionite solution was prepared anaerobically by dissolving 52 mg of solid dithionite (stored in a desiccator) in 500 uL of oxygen-free tris buffered saline (20 mM Tris, pH 7.5, 100 mM NaCl). The protein was then incubated with 60 mM sodium dithionite for 45 min followed by desalting to remove dithionite. The protein was then exposed to either excess nitric oxide (NO) donor DEA-NONOate (Cayman Chemical) which has a 1/2 life of 16 min at 25°C and desalted to remove DEA and excess DEA-NONOate or was exposed to excess carbon monoxide (CO) gas continually passed through the headspace of a gas-tight reactivial. For CN− complexes, ferric protein was incubated in 10 mM potassium cyanide for 40 min. At each stage of preparation, a small amount of sample was saved for UV-Vis spectroscopic analysis (CARY).
Determination of koff for NO-NosP.
NO complexes were prepared as described above. The NO dissociation rate constant was measured using a dithionite trap as described previously.11, 32 Briefly, a dithionite trap was prepared by bubbling CO gas through protein storage buffer with varying concentrations of dithionite. The CO solution was injected into a gas tight cuvette containing the NosP-NO complex at various concentrations between ~200 nM to ~500 nM. Dissociation of NO from NosP was measured by scanning kinetics (CARY) of the change in UV-vis absorbance from the NO peak (395 nm) to the CO peak (420 nm) over time at 20 ºC. Because fitting the data to either peak alone results in the same fit, the difference was used to maximize the signal, as has been reported in similar measurements as previously described.11, 33 CO association is expected to be much faster than NO dissociation, as is observed with other heme proteins.34 The change in absorbance over time was fit to two parallel exponentials, each with the form ΔAbs(t) = A(1 − e−k*t). Supplemental Table 1 describes the graphing software used and further elaboration on the kinetic determinations is in the results section below. All rate constants reported are independent of CO and dithionite concentration (3, 30, and 300 µM tested).
Resonance Raman sample preparation.
The ferric NosP proteins were measured in NMR tubes. To prepare the ferrous samples, 75 µL of 150 µM NosP (from P. aeruginosa, V. cholerae and L. pneumophila) proteins were transferred into NMR tubes (WG-5 Economy, Wilmad), respectively, sealed with a rubber septum, and reduced by a stoichiometric amount of sodium dithionite solution under anaerobic condition; i.e., the sample was titrated with a sodium dithionite solution until the α/β bands at ∼526 and 533 nm had appeared, as monitored by a special device (model CHEM2000-VIS, Ocean Optics Inc., Dunedin, FL) that is capable of recording absorption spectra from samples contained in NMR tubes. The ferrous CO complexes were prepared by saturating the sample with CO gas prior to the injection of excess sodium dithionite solution. The prepration of the nitric oxide adducts of ferrous NosP was achieved by anaerobic decomposition of the proper isotope-labelled (15N or 18O) sodium nitrite with dithionite. Specifically, 50 µL of NosP protein was placed in an NMR tube which was sealed with a rubber septum. After being degassed with argon for 15 min, the proteins were reduced by injecting a 50-fold excess of sodium dithionite followed by 20-fold excess of sodium nitrite to form the nitric oxide adducts; the concentration of the sodium dithionite solution was determined by electronic absorption spectrophotometry (employing a molar absorptivity of 8043 M−1cm−1),35 as described previously.36, 37 It is noted that the sample preparation employed here for the rR measurements used a 20-fold excess of NO. These conditions may possibly give rise to a 5-coordinate NO complex, where the NO is positioned in the proximal pocket, but confirmation of this would require more elaborate rR studies with carefully controlled relative concentration of enzyme and nitric oxide, or possibly time-resolved rR studies demanding rather large quantities of protein.38
Resonance Raman measurement.
The spectra of ferric and ferrous nitrosyl NosP complexes were obtained using 406.7 nm excitation line, while the spectra of ferrous and their CO complexes were measured using 413.1 nm excitation line. Both lines are provided by a Kr+ laser (Coherent Innova Sabre Ion Laser) with a Spex 1269 spectrometer equipped with a Spec-10 LN liquid nitrogen cooled detector (Princeton Instruments). The slit width was 150 µm (a spectral resolution of 8 cm−1) for all the measurements except for high-frequency measurement on ferrous CO samples, where it was increased to 250 µm (a spectral resolution of 14 cm−1), owing to the weaker intensity of the ν(C-O) modes. The laser power for ferric and ferrous samples was kept around 10 mW whereas for the nitrosyl and ferrous CO complexes, it was adjusted to ~1 mW to avoid photodissociation. All samples were measured in a spinning NMR tube and a cylindrical focusing lens, providing a linear image on the sample, to avoid local heating and protein degradation. Spectra were calibrated with fenchone and acetone-d6 (for calibration with high frequency above 1700 cm−1) and processed with Grams 32/AI software (Galactic Industries, Salem, NH).
Measurement of heme redox potential.
Heme redox potential was measured using a slight modification of the method described by Massey39 with the modifications of Efimov et al,40 which measure reduction potential by measuring equilibrium co-reduction of the protein and a dye with a known reduction potential as a reference. Methylene blue was selected as the dye for this experiment as it was determined to have a reduction potential closest to that of the NosP proteins. Oxidized protein is prepared in a gas tight cuvette in an anaerobic chamber in a solution with 5 µg/mL Catalase, 5 mM Glucose and 50 µM Glucose Oxidase to ensure that the solution remains anaerobic, phosphate buffer at the appropriate pH at 50 mM, protein and dye are added such that they give absorbance ~1 AU, and xanthine (Sigma) to 300 µM is added as an electron source. Immediately before beginning reading, 3.5*10−6 units of xanthine oxidase (Sigma) is added. The sample is scanned from 700–350nm once per min for 40 min Next, a few crystals of sodium dithionite are added to fully reduce the sample and scans are continued for another 15 min to ensure maximal reduction. While preparation of anaerobic solution is a more common way to produce reduced proteins to avoid pH shock and product of reactive oxygen species, for this experiment the established methods add solid dithionite crystals to the sample to avoid changes to the absorbance amplitude from sample dilution.39, 40 The Soret is monitored during this time and no loss of absorbance is detected that might indicate any sort of damage to the protein. To determine the net reduction potential, the modified Nernst equation is used where the ratio of oxidized to reduced species is calculated from absorbance values: where At is the absorbance value at a given time point, and A max/min are the maximum and minimum observed absorbance values for the peak of the oxidized form of the protein/dye. This transformation is applied to the protein and dye separately, with n=1 for the protein and n=2 for the dye. The data are plotted against each other for each time point, which should give a line with slope of 1 under equilibrium conditions. As is described by Efimov et al, data points at the beginning and end of the experiment are excluded until the slope is between 0.99 and 1.1, as these points are more likely to be out of equilibrium for oxidized:reduced species. The line’s intercept is the difference in reduction potential between the protein and dye, so using the dye’s known reduction potential at a given pH, the protein’s reduction potential is extrapolated. Reported values are calculated for averages and standard error of the mean from at least four repetitions for pH 7.0 samples and at least 2 samples for pH 8.0 samples.
Results and Discussion
NosP from P. aeruginosa was the first NosP hemoprotein to be characterized; it was demonstrated to be involved in NO-mediated biofilm regulation.11 A molecular-level understanding of ligand binding and heme-based signaling are entirely lacking in this family, however. In this study, we use electronic and resonance Raman spectroscopies to characterize various ligation and oxidation states of three homologous NosP hemoproteins (Figure S1) and to explore the molecular features of the gas-ligand binding pocket.
NosPs contain heme B as a cofactor.
To confirm the heme cofactor present in NosP is heme B, as expected, we purified Pa NosP without supplementing hemin at any point during the expression/purification process for analysis by liquid chromatography mass spectrometry with diode array (LC/MS/DAD). Pa NosP has an elution peak at 17.8 min, which like a heme B standard, has m/z= 616 and gives an absorbance spectrum with a Soret peak at 398 nm (Figures S2a and S2b). The second elution peak at 20.5 min has high 280 nm absorbance and gives a deconvoluted mass of 43,107 da, which corresponds to His-tagged Pa NosP (Figure S2c). Furthermore, titration experiments between apo-NosP and heme (Figure S3) are consistent with a single heme binding site per NosP monomer.
NosP proteins interact with CO, NO and CN−.
NosP proteins purify bound to heme as demonstrated by their characteristic Soret absorption peak. Electronic absorbance spectra for Pa NosP11 and Vc NosP18 have been reported previously, demonstrating that NosP ligand binding properties are consistent with known NO sensors, such as sGC.41 The ligand binding properties of Lpg NosP are consistent with the NosP proteins characterized to date (Figure 1a and Table 1). Lpg NosP has resolved α and β peaks in the ferrous unligated state and a Soret maximum at 417 nm, which is similar to 6-coordinate heme proteins such as CooA.42–44 Upon NO binding, the Soret peak shifts to 395 nm, while the α/β peaks shift to 525 and 553 nm, respectively, consistent with a 5-coordinate {FeNO}7 heme nitrosyl complex. Upon CO binding, there is little shift in the Soret maximum, but the extinction coefficient is significantly higher and the α/β peaks shift to 533 and 566 nm respectively, similar to what is observed for other NosP proteins and sGC. Interestingly, in the ferric-CN complex, Lpg NosP has a single α/β at 544 nm, similar to C. eugametos cyanomet-hemoglobin (546nm),45 while in sGC and the other NosP proteins there is a single α/β peak observed at 538 nm (Table 1 and Figure 1b).46
Figure 1.
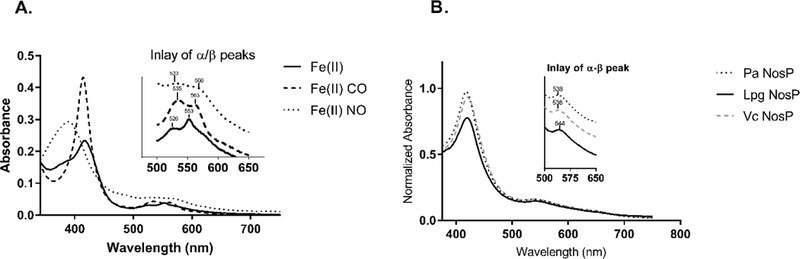
(A) Soret peaks of Lpg NosP with inlay of α/β peaks in ferrous unligated, ferrous CO and Ferrous NO complexes. (B) NosP Fe(III)-CN complexes. Soret peaks with inlay of α/β peak for ferric cyanide complexes for NosP from P. aeruginosa, L. pneumophila and V. cholerae.
Table 1.
Soret and α/β peaks of NosP proteins compared to sGC
| Fe (II) | Soret (nm) | α (nm) | β (nm) | Reference: | |
|---|---|---|---|---|---|
| Lpg NosP | 417 | 526 | 553 | This work | |
| Vc NosP | 415 | 529 | 553 | 18 | |
| Pa NosP | 420 | 524 | 554 | 11 | |
| sGC | 431 | 555 | 41 | ||
| Fe(II)-NO | |||||
| Lpg NosP | 395 | 533 | 566 | This work | |
| Vc NosP | 395 | 533 | 563 | 18 | |
| Pa NosP | 396 | 534 | 574 | 11 | |
| sGC | 398 | 537 | 571 | 41 | |
| Fe(II)-CO | |||||
| Lpg NosP | 417 | 535 | 563 | This work | |
| Vc NosP | 416 | 535 | 563 | 18 | |
| Pa NosP | 416 | 538 | 565 | 11 | |
| sGC | 423 | 541 | 567 | 41 | |
| Fe(III)-CN | |||||
| Lpg NosP | 419 | 544 | This work | ||
| Vc NosP | 420 | 538 | This work | ||
| Pa NosP | 418 | 538 | This work | ||
| sGC | 418 | 538 | 46 | ||
NO dissociates slowly from NosP proteins.
The dissociation rate constant of NO from Lpg NosP is comparable to those observed in other NosP proteins as well as those reported for other sub-micromolar NO sensors (Figure 2 and Table 2). Dissociation was measured by the CO-dithionite trap method described previously.11, 32, 33, 47 Briefly, NO bound protein is incubated in a solution saturated with carbon monoxide and a large excess of sodium dithionite. As NO dissociates from heme it is reduced by dithionite. CO then rapidly associates with heme in a process expected to be much faster than NO dissociation. Dithionite and CO are both present to prevent NO-rebinding, which is typically very fast, and would artificially lower the apparent NO dissociation rate constant. The data were fit to a parallel two term exponential-associative function. The slower step is reported as koff because it is the slowest step in NO-dissociation, not because we can assign it to the molecular step of Fe-N bond scission. The faster rate constant is possibly the result of association of the axial protein ligand after NO dissociation. Another possibility is that because excess NO was used in preparing the NO complex, the 5-coordinate NO species observed for NosP has NO bound in the proximal pocket, as is observed in cytochrome cʹ48 and some H-NOX proteins.49 Thus, the two rate constants could represent dissociation from the heme via a 6-coordinate ferrous intermediate to which CO binds more slowly than expected, although we note we see no dependence on CO in our measured rate constants. It is also possible that there could be a mixture of proximal and distal 5-coordinate NO complexes, and the two rate constants represent dissociation from these two different species.
Figure 2.

Dissociation of NO from Lpg NosP. NO bound NosP was incubated with a dithionite solution saturated with CO. As NO dissociates, rapid binding of CO occurs giving a large shift in Soret absorbance, while NO reacts with dithionite to prevent rebinding. The difference in the absorbance change due to NO (395 nm) dissociation and the absorbance change due to CO association (420 nm), over time, was fit to a two-term exponential function. The dissociation rate constants determined are independent of dithionite and CO concentration.
Table 2.
NO dissociation rate constants for NosPs and sGC
Typically, NO dissociation measurements reach a plateau within 1 hour,11, 33, 34, 47 while in this case, even after data collection for 3 hours, a plateau was not observed for Lpg NosP. Due to this, we cannot report a precise NO dissociation rate constant, but if this data is constrained to assume it has plateaued, we can report the dissociation rate constant is no faster than 2×10⁻⁴ per second for the slower rate constant and 100×10−4 for the faster rate constant. These rate constants are both independent of CO and dithionite concentration. We can thus conclude that the NO dissociation is quite slow. We are currently working on obtaining NO association kinetics, but as typical histidine-ligated hemoproteins have NO association rate constants that falls between 104–108 M−1s−1, we expect the KD to fall in the nanomolar to picomolar range.50
Ferric NosP hemes are mixtures of 5-coordinate high- and 6-coordinate low-spin states.
The high-frequency rR spectrum of the ferric NosP protein from P. aeruginosa (Figure 3a) has a peak near 1467 cm−1 attributable to glycerol; the relatively lower intensity of this feature in Figure 3c is the result of the lowered glycerol concentration. The ν4 mode is seen at 1374 cm−1, which indicates the sample is in the ferric state, while the intensity of the ν3 mode at 1505 cm−1, compared to the feature at 1492 cm−1, attributable to a 5-coordinated high spin state, shows that the dominant form is the 6-coordinated low spin state.51 This spin state mixture is also reflected by alterations in the ν 2 and ν10 bands; i.e., the ν 2 bands occur at 1579 cm−1 and 1588 cm−1, while the ν 10 bands occur at 1628 cm−1 and 1640 cm−1. It is also important to note that a vinyl stretching mode is expected to occur near 1620 cm−1, though definitive confirmation of its presence would require careful determination of depolarization ratios to confirm the assignment.
Figure 3.

High-frequency rR spectra of homologous ferric NosP proteins. Spectra were measured at room temperature with an excitation line at 406.7 nm. The 1467 cm−1 band is attributed to glycerol. (A) NosP from P. aeruginosa (B) NosP from V. cholerae (C) NosP from L. pneumophila.
The high frequency region of the ferric NosP protein from V. cholerae (Figure 3b) exhibits features characteristic of the ferric state, with the ν4 oxidation state marker occurring at 1374 cm−1.Again, the ν3 spin state marker bands are indicative of the presence of a mixture of 5-coordinated high spin (the ν3 mode at 1492 cm−1) and 6-coordinated low spin (the ν3 mode at 1505 cm−1) species, with the latter showing an increased relative population. The ν2 and ν10 mode for 5-coordinated high spin (1579 and 1628 cm−1) and 6-coordinated low spin (1588 and 1640 cm−1) species are also observed, at expected positions, in this region.
Figure 3 (trace C) shows the high frequency region of the ferric NosP protein from L. pneumophila, with its ν4 band occurring at 1374 cm−1, consistent with the ferric state. Two ν3 modes, observed at 1492 cm−1 and 1505 cm−1, show that this protein also exists in equilibrium between 5-coordinated high spin and 6-coordinated low spin forms, respectively. The intensity of the high spin ν3 (1492 cm−1) band is quite a bit larger relative to the low spin ν3 (1505 cm−1) mode, indicating a higher percentage of high spin species. This spin state mixture is also reflected by alterations both in the ν2 and ν10 bands; i.e., the ν2 bands occur at 1579 cm−1 and 1588 cm−1 and the ν 10 bands occur at 1628 cm−1 and 1640 cm−1.
The NosP heme is distorted.
The low-frequency rR spectra of ferric NosP proteins from the various sources are shown in Figure 4. In trace A, the assigned heme skeletal modes for the protein from P. aeruginosa are observed; ν7 (678cm−1), ν15 (754 cm−1) and ν8 (345 cm−1). A shoulder of ν7 appears at 693 cm−1, which can be attributed to γ20. According to previous work with many other heme proteins, including globins and cytochromes P450,52, 53 the bands observed between 365–380cm−1 are typically assigned to the bending modes of the heme propionate groups,54 though they are properly interpreted as heme deformation modes that involve significant contributions from the propionate bending coordinates as well as δ (Cβ-CH3) motions, as indicated by substantial shifts observed for samples containing -CD3 instead of –CH3 group.55 Likewise, bands appearing between 400–440 cm−1 are assigned to “vinyl bending” modes, which also contain Cβ-CH3 bending contributions.52, 53 It is noted that a mode occurring at 391 cm−1 is most reasonably attributed to CβCH3 bending motions.52 Other than an apparently small percentage of glycerol in samples from Lpg compared to Pa and Vc (415 and 485 cm−1), there are no significant differences in traces B and C compared to A.
Figure 4.

Low-frequency rR spectra of homologous ferric NosP proteins. Spectra were measured at room temperature with an excitation line at 406.7 nm. (A) NosP from P. aeruginosa (B) NosP from V. cholerae (C) NosP from L. pneumophila.
Significantly, all three NosP samples showed a high intensity feature at 693 cm−1 (γ20) in the low-frequency region, and the 5-coordinated high spin feature occurs at 1492 cm−1 in the high-frequency region, suggesting a highly distorted heme cofactor.56 The biological significance of distorted heme cofactors has been discussed for many other heme proteins;57–61 for example, heme ruffling distortion in cytochrome c is important for controlling the electron transport mechanism.62 The crystallographic structure of the H-NOX domain from Caldanaerobacter subterraneus (Cs H-NOX, formerly identified as Thermoanaerobacter tengcongensis, Tt H-NOX) contains a highly distorted heme.63 It is demonstrated that such distortion is maintained by a proline residue near the heme in the proximal pocket, and mutating this residue to alanine can eliminate the distortion, leading to a flattened heme, which lowered the redox potential of heme iron and caused notable conformational changes of the N-terminus of the protein.64 Significantly, this flattened heme effectively mimics the model of the activated NO bound form,65 suggesting that NO binding causes heme relaxation and induces the overall protein conformational changes which regulate signal transduction.
Ferrous NosP exists in equilibrium between 5-coordinate high spin and 6-coordinate low spin states.
As shown in Figure 5, all three ferrous proteins exhibit similar spectral patterns in both the low and high frequency regions. The high-frequency region exhibits the oxidation band (ν4) at 1358 cm−1, indicating the presence of ferrous iron. The spin state markers, v3 and v2, occur at 1494 cm−1 and 1588 cm−1 respectively, which indicate a 6-coordinate low spin ferrous heme, consistent with the split α/β observed in the absorbance spectrum. The presence of 6-coordinated low spin state could be attributed to coordination of water or an unidentified residue from the distal heme pocket. The ν(Fe-His) for ferrous histidyl-ligated heme is typically observed in the 200 to 230 cm−1 spectral region. 166, 67 The 213 cm−1 feature present in all three ferrous NosP samples suggests an iron histidine vibrational mode in this region.
Figure 5.

Low-frequency (left panel) and high-frequency (right panel) rR spectra of homologous ferrous NosP proteins (in the absence of glycerol). The inset shows bands in the low frequency region acquired with the 441.6 nm excitation line from a HeCd laser. (A) NosP protein- from V. cholerae (B) NosP protein- from P. aeruginosa (C) NosP protein- from L. pneumophila.
The suggestion that the 213 cm−1 band could be the ν(Fe-Nhis) stretching mode would require the presence of the ferrous high spin marker near 1470 cm−1, which can be difficult to confirm in the presence of glycerol, which exhibits a band at this energy. Thus, all ferrous NosP samples were depleted of glycerol by buffer exchange techniques. As shown in Figure 5, the glycerol-free spectra all exhibit a feature at 1470 cm−1, assignable to the ferrous high spin ν3 mode. It is also noted that the high spin population seems to vary among the proteins from various sources, being relatively weak in NosP from Pa, but relatively strong in NosP from Vc and Lpg. It is important to note that these intensity changes are consistent with the changing intensities of the low frequency 213 cm−1 band (Figure 5, left panel). Subsequent experiments were performed to confirm an, albeit small, H/D shift similar to that seen for myoglobin,68 but this shift was not observed. Despite failing to see the H/D isotope shift, the behavior in the high frequency region strongly supports the conclusion that the ferrous form is histidine ligated. This assignment is further supported in the spectrum obtained with 441.6 nm excitation line, from a He-Cd laser, where the enhancement of the 213 cm−1 band was observed to increase relative to the heme modes for all three samples, as shown in Figure 5, inset.69
CO binds to NosPs to form a 6-coordinate complex where histidine does not dissociate.
Heme proteins readily bind exogenous diatomic gaseous ligands (XY) such as CO, NO and O2 to trigger key biological processes.70 Interactions with surrounding amino acid residues affect the bond strength of the Fe-X and X-Y linkages, which is reflected in changes of the intensity and frequencies of vibrational modes detected by resonance Raman spectroscopy. Well-established backbonding correlations exist, resulting from electrons being donated from the Fe dπ orbitals to the ligand π* orbitals. The resulting negative linear correlations between the ν(Fe-X) and ν(X-Y) modes can provide useful information regarding the heme-protein interactions, such as H-bonding and electrostatic effects in the distal pocket and the trans axial ligand properties.31, 71 The CO adducts of heme proteins are particularly useful in probing the protein environment, as they are relatively chemically stable and there is a well-established spectra-structure correlation existing for these adducts.71, 72 The CO ligand has an empty π* orbital and thus forms a linear adduct for which dπ- π* overlaps in a perpendicular directions to maximize the backbonding interactions.73
The rR spectra of the ferrous-CO NosP complexes are shown in Figure 6. All three samples exhibit spectra corresponding to a 6-coordinated low spin species, with the ν4, ν3, and ν2 modes occurring at 1373, 1498 and 1590 cm−1, respectively, consistent with previously published data for other heme proteins.74, 75 No evidence of a band at 1358 cm−1 is detected, which is a marker band of unligated ferrous heme, demonstrating that the spectra are not contaminated with modes of photo-dissociated species. All three samples exhibit quite similar spectral patterns, with the ν(Fe-C) frequency observed at the range of 496 to 497 cm−1, with its correlated C-O stretching mode at 1955~1959 cm−1. The feature observed at 574 cm−1 is assigned to the δ(Fe-C-O) bending mode of Fe-C-O fragment. These assignments are within the typical range of well-documented frequencies of other heme proteins, which have generally been verified by 13CO isotope substitution.75–77
Figure 6.

rR spectra of ferrous CO NosP complexes. The left panel shows the low frequency region, the middle panel shows the high frequency region, and the right panel exhibits the region above 1900 cm−1 where the C-O stretching mode occurs. The 2049 cm−1 band is a combination of ν7 and ν4. Spectra were normalized to ν7 and ν4 in low-frequency and high-frequency regions, respectively. (A) NosP from P. aeruginosa (B) NosP from V. cholerae (C) NosP from L. pneumophila.
A plot of the inverse back-bonding correlation line between ν(Fe-C) and ν(C-O) frequencies for many hemoproteins is shown in Figure 7. Three distinct correlations are evident, each corresponding to the proteins bearing different axial ligands; i.e., the three lines corresponding to the histidine-ligated hemoproteins (L=His),31, 78, 79 the P450cam-type hemoproteins (L=thiolate),80–82 and nitric oxide synthase enzymes (L=thiolate, but H-bonded with a nearby Trp residue).78, 79 The points determined for the CO adducts of the NosP proteins fall between the line generated for the thiolate-ligated enzymes and that derived for proteins bearing a trans axial histidine ligand, these rR data strongly supporting the presence of a histidine proximal axial ligand for these NosP proteins.
Figure 7.
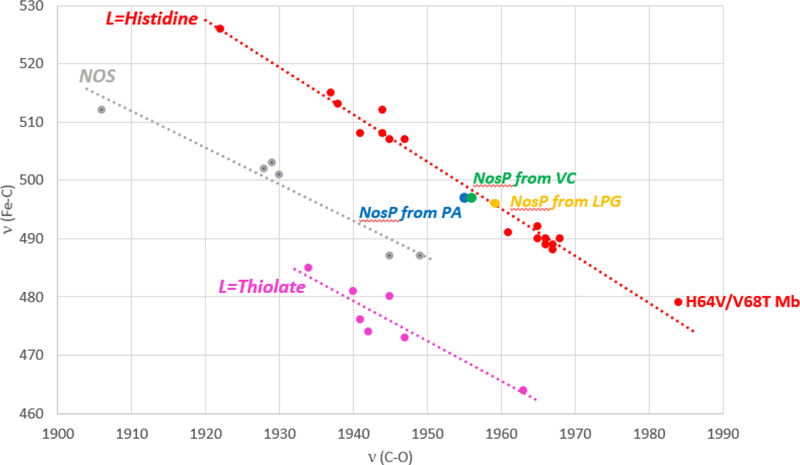
Diagrams showing an inverse correlation for cytochromes P450 (purple; all contain heme-thiolate linkages), nitric oxide synthases (grey; all contain a heme-histidine linkage where this His is H-bonded to a Trp), and myoglobins (red; heme-histidine linkages). The blue dot represents the NosP from P. aeruginosa, the green dot is the NosP from V. cholerae and the yellow dot is NosP from L. pneumophila.
Heme-CO vibrational modes have previously been used to characterize the protein environment of the H-NOX family, specifically for Cs H-NOX and its mutants.83 Interestingly, a quite high C-O stretching frequency was observed at 1987 cm−1 in wild-type Cs H-NOX, with a ν(Fe-C) mode at 492 cm−1. Similar behavior has also been observed in the H64V/V68T myoglobin mutant, which has a highly negatively charged polar environment in its distal heme pocket due to reorientation of residues upon mutation (i.e., ν(C-O) = 1984 cm−1).84, 85 Thus, it has been suggested that the high C-O frequency in wild-type Cs H-NOX is attributable a negatively charged polar environment, likely due to the interaction between the CO molecule and lone pair electrons on the –OH group of Tyr-140. As expected, mutation of Tyr140 in Cs H-NOX to the more hydrophobic phenylalanine residue lead to a diminished negative polarity and the C-O stretching mode lowered to 1950 cm−1. Given this result, we therefore conclude these three NosP proteins, which exhibit a C-O stretching mode between 1955–1959 cm−1, are likely exposed to a relatively nonpolar environment in the NosP distal pocket.
NO binds to ferrous NosPs, causing dissociation of the trans axial histidine and formation of a 5-coordinate complex.
As NosP proteins are predicted to function as receptors for gaseous NO, which is a key regulator of bacterial biofilm formation, characterization of the interaction between NosP and NO is essential to understanding how these proteins fulfill this important biological role. Similar to the ferrous CO adducts, the ferrous NO adducts have an Fe(II) to NO (π*) back-bonding interaction and a negative correlation between the ν(Fe-N) and ν(N-O) rR frequencies, which is dependent on interactions between the bound ligand and the protein environment, where an increased Fe-N bond strength leads to a weakened N-O bond. However, the NO molecule has a single electron in the π* orbital, which leads to an inherently bent geometry (the Fe-N-O angle is ~140°). The assigned 5- and 6-coordinate ferrous NO adducts of myoglobin exhibit the ν(Fe–N) stretch at 521 and 552 cm−1.86 In many ferrous nitrosyl complexes, however, NO binding promotes the ejection of the proximal ligand as NO exerts a strong trans effect on ferrous iron, promoting 5-coordinate NO complexes in many hemoproteins, such as sGC and some H-NOX proteins; this process is considered as essential in activating the function of these proteins.50 A good number of ν(Fe-N)/(N-O) frequencies have been collected for Fe(II)-NO adducts of heme proteins and model compounds in both 5-coordinate and 6-coordinate forms. While relatively low ν(Fe-N) modes are seen for 5-coordinate NO complexes, occurring near ~510–530 cm−1, with associated N-O frequencies near ~1660–1700 cm−1, 6-coordinate NO adducts exhibit higher Fe-N frequencies (in the range of ~550–580 cm−1) along with higher N-O frequencies ( ~1620–1650 cm−1).31, 87
The rR spectra of NosP from V. cholerae complexed with NO are shown in Figure 8, where the left panels show spectra for low frequency while the right panels are those for high frequency. Within each panel, the top and bottom traces correspond to the 14NO and 15NO complex, respectively, and the middle trace is the difference spectrum. In the high frequency region (Figure 8, right panel), the oxidation state marker band ν4 is observed at 1375 cm−1 and spin state markers ν3, ν2 and ν10 occur at 1507 cm−1, 1591 cm−1 and 1642 cm−1, respectively, which are consistent with values typically seen for a 5-coordinated low spin heme. Distinctive difference patterns for Fe(II)-14NO and Fe(II)-15NO adducts (Figure 8, middle traces) are seen both in the high frequency and low frequency regions. A clear difference pattern is seen at 1669/1635 cm−1, a pattern consistent with a 5-coordinate low spin complex. Though generally of lower quality, the low frequency spectra also produce a slightly less clear difference pattern with components at ~527/511 cm−1, also consistent with a 5-coordinate low spin complex, noting that the derived isotopic shifts on these two patterns are those expected. It is noted that the intensity of the ν(Fe-15N) is relatively higher than ν(Fe-14N); this is attributable to the fact that the Fe(II)-14NO spectrum was contaminated by the photo-dissociated species, as evidenced by the detected shoulder peak at 1358 cm−1, which is a marker band of ferrous heme. Thus, the frequencies occurring at 527 cm−1 and 1669 cm−1 are assigned as ν(Fe-N) and ν(N-O) stretching modes, respectively. These results provide further evidence that a 5-coordinated heme complex was formed upon NO binding.
Figure 8.

Resonance Raman spectra of nitrosyl complexes of NosP from V. cholerae. Left panel shows the low-frequency region while the right panel shows the high frequency region. Middle traces represent nitrosyl isotope (14NO–15NO) difference spectra.
In the case of NosP from P. aeruginosa, the resonance Raman spectrum in the region between 1300–1750 cm−1 (Figure 9, right panel) reveals the oxidation marker occurs at 1374 cm−1 and spin state marker bands ν3, ν2 and ν10 occur at 1508 cm−1, 1591 cm−1 and 1642 cm−1, respectively, which are typical of 5-coordinate low spin heme. The ν(Fe-N) frequency is identified at 525 cm−1 from its 15 cm−1 downshift with 15NO, while the isotope replacement reveals that the ν(N-O) vibration occurs at 1671 cm−1 with the expected 35 cm−1 isotope shift. Again, the spectrum of the 14N- isotopomer reveals evidence of photodissociation, as reflected by the appearance of the 1358 cm−1 ferrous photoproduct.
Figure 9.

Resonance Raman spectra of nitrosyl complexes of NosP from P. aeruginosa. Left panel shows the low-frequency region while the right panel shows the high frequency region. Middle traces represent nitrosyl isotope (14NO–15NO) difference spectra.
Turning attention to the NO adducts of NosP from L. pneumophila, it is first noted that during spectral acquisition for these samples, more extensive sample precipitation occurred. In the high frequency region (Figure 10, right panel), the ν4 oxidation state marker band is located at 1375 cm−1, while the spin state marker bands, the ν3 and ν2 modes, are seen at 1508 and at 1593 cm−1, respectively, spectra again characteristic of a low spin 5-coordinate NO adduct. The ν(N-O) bands appear at 1665 cm−1 for 14N-O and 1632 cm−1 for the 15N analogue, in close agreement with the shift expected for a diatomic harmonic oscillator. In the low frequency region the raw spectra show relatively high background (small S/N), with a difference trace exhibiting discernible positive and negative features. The difference feature revealing peaks at 530 cm−1 (14N) and 516 cm−1 (15N) yields the expected isotopic shift for a ν(Fe-N) mode. Two positive features, seen at 345, 675 and 754 cm−1, appear in the difference trace, owing to a slightly larger concentration (less precipitation) of the 14N isotopomer.
Figure 10.

Resonance Raman spectra of nitrosyl complexes of NosP from L. pneumophila. Left panel shows the low-frequency region while the right panel shows the high frequency region. Middle traces represent nitrosyl isotope (14NO–15NO) difference spectra. It is noted that during spectral acquisition for these samples, more extensive sample precipitation occurred.
Lpg NosP has the most electropositive heme environment relative to Vc and Pa NosP.
Figure 11 shows well-established inverse correlation plots for 5-coordinate NO proteins, which are useful for probing the environment of the distal pocket. All three of these NosP proteins exhibit frequencies close to the back-bonding line, within which the NosP from L. pneumophila shows higher frequencies (530 cm−1) than NosP from V. cholerae (527 cm−1) or P. aeruginosa (525 cm−1). It has been shown that H-bonding to ONO will strengthen back-bonding in ferrous nitrosyl proteins, yielding higher ν(Fe-N) and lower ν(N-O) frequencies.31 This would indicate that the NosP from L. pneumophila possibly forms stronger H-bonds to the surrounding protein residues than the NosPs from V. cholerae or P. aeruginosa. Alternatively, the NosP from L. pneumophila may have a relatively more positive electrostatic environment in the distal pocket than the other two proteins, a hypothesis that we tested as described below.
Figure 11.

The NO back-bonding correlation line of 5-coordinated NO proteins. The numbers represent proteins listed in Table 3.
We measured the reduction potentials for each NosP protein in this study. Heme redox potential were measured using the Efimov et al. adaptation40 of Massey’s method.39 Massey proposed that heme redox potentials could be determined using the oxidation of xanthine to uric acid as an electron donor in a solution with the heme protein and a dye with a known reduction potential. From the difference in percent reduction of the protein and of the dye in equilibrium, the difference in their reduction potentials is extrapolated. An ideal dye for this experiment has a reduction potential as close as possible to that of the heme, with the assay becoming less reliable at > 30 mV separation.
In order to determine which dye would be appropriate for NosP, we tested several dyes until we found one with a reduction potential closest to that of the NosPs, methylene blue. Methylene blue is a well characterized dye with reduction potentials characterized across the pH range.89 The reduction potential for Pa NosP at pH 7.0 is near the edge of the 30 mV boundary, so we also confirmed its reduction potential using 5,5’,7,7’-indigotetrasulphonate (reduction potential at pH 7.0 = −46,90 supplemental Figure 4). Reduction potentials of heme proteins shift with pH, as side chains and heme propionate groups change protonation states.91, 92 It has been suggested that effects of pH on reduction potential will be mitigated in proteins where the heme is deeply buried away from solvent effects.70
Using the reduction potentials for methylene blue, 11 and −20 mV for pH 7.0 and 8.0, respectively, we determined reduction potentials for NosP proteins. Figure 12 (panels A-C) illustrates characteristic plots of ln([Dyeox]/[Dyered]) against ln([NosPox]/[NosPred]) with a slope equal to 1, indicating the electron transfer is in equilibrium. At pH 7.0, the reduction potentials for Lpg, Vc and Pa NosPs were measured to be −1 ± 3, −9 ± 3 and −31 ± 7 mV, respectively, while at pH 8.0 they were −13 ± 2, −29 ± 10 and −59 ± 6 mV, respectively (Figure 12, panel D). This trend is consistent with what was observed in the Fe(II)-NO resonance Raman backbonding energies, where Lpg NosP has the strongest Fe-N bond (530 cm−1) and therefore the weakest N-O bond (1665 cm−1). Lpg NosP also showed the smallest change in reduction potential with the shift of one pH unit, which may indicate more protein-heme interactions are present, including a more deeply buried heme, more H-bonding to residues in the heme pocket, or a more hydrophobic heme binding pocket.
Figure 12.
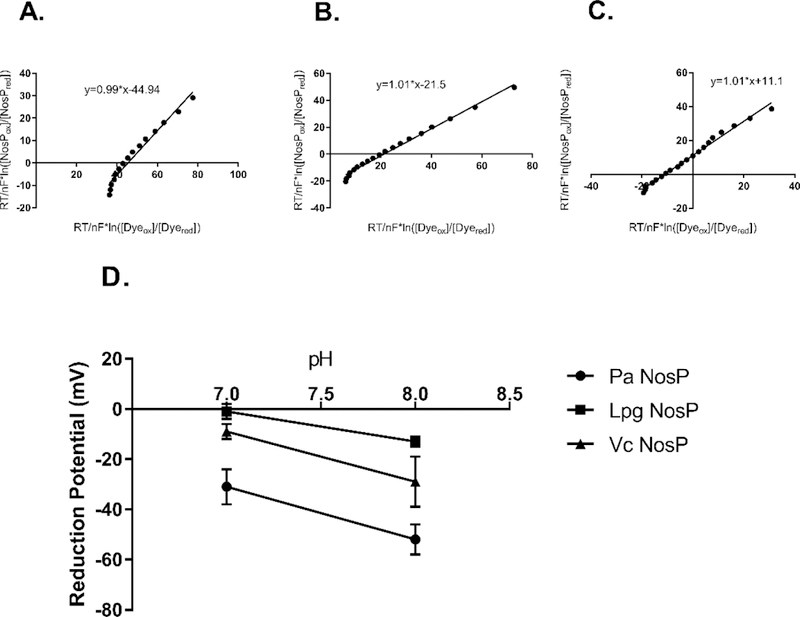
Linear plots of (A) Pa NosP (B) Vc NosP and (C) Lpg NosP during equilibrium reduction with methylene blue. Slopes of 1 indicate the equilibrium state and the y-intercept is the difference between the reduction potential of methylene blue and the reduction potential of the relevant NosP. (D) Summary of reduction potentials measured for NosPs at pH 7.0 and 8.0
In summary, it is proposed that upon binding NO, NosP proteins form a 5-coordinated heme with NO as the axial ligand, displacing a histidine ligand. This behavior is similar to NO sensing observed in sGC and H-NOX proteins.93–96 Finally, it has been widely reported that the nature of the iron histidine stretching mode ν(Fe-His) is closely correlated with ligand-induced dissociation of proximal histidine.97, 98 Native myoglobin, which forms a 6-coordinate NO adduct, exhibits a ν(Fe-N) structure mode at 220 cm−1.53 Conversely, sGC forms a 5-coordinate NO complex, which exhibits a low Fe-Nhis stretching mode that occurs at 204 cm−1. There are exceptions, however, H-NOX from V. cholerae has a high energy iron-histidine bond (ν(Fe-N) = 224 cm−1), but forms a 5-coordinate NO complex. The frequency of the Fe(II)-His stretching mode of NosP (213 cm−1) is between those of Mb and sGC, and NosP forms a 5-coordinate NO adduct. Collectively, these data suggest the correlation between the Fe-His bond strength and coordination number of the NO complex must also be influenced by different architectures in both the distal and proximal pockets, such as H-bonding interactions or steric effects on the Fe-His bond, as well as interactions of the heme peripheral groups with heme pocket protein residues that cause out-of-plane heme distortions.49, 60, 65
Supplementary Material
Table 3.
RR frequencies of 5-coordinate NO hemoproteins.88
| Protein | v(N-O) cm−1 | v(Fe-N) cm−1 |
|---|---|---|
| Alcaligenes xylosoxidans Cytochrome c’ (AXCP) | 1664 | 531 |
| Cytochrome c’ R124K | 1657 | 533 |
| Cytochrome c’ R124F | 1662 | 529 |
| Cytochrome c’ R124Q | 1662 | 532 |
| Cytochrome c’ R124E | 1661 | 533 |
| FixL | 1675 | 525 |
| H93YMb | 1672 | 524 |
| CooA | 1672 | 523 |
| sGC | 1680 | 522 |
| NosP from Vc | 1669 | 527 |
| NosP from Pa | 1671 | 525 |
| NosP from Lpg | 1665 | 530 |
Acknowledgements
We thank S. Hossain for providing NosP gene clones. We thank R. Johnson and the Boon Group for helpful discussions and P. Mak, formerly of Marquette University and currently at Saint Louis University, for initial planning of Raman experiments and helpful discussions.
Funding Sources
This work was supported by the National Science Foundation (grant CHE-1607532 to E.M.B.) and the National Institutes of Health (grant GM118894–01A1 to E.M.B.).
Footnotes
The abbreviations used are: NosP, nitric oxide sensing protein; Pa, Pseudomonas aeruginosa; Vc, Vibrio cholerae; Lpg, Legionella pneumophila; NO, nitric oxide; CO, carbon monoxide; CN, cyanide; rR, resonance Raman; His, histidine; NOS, nitric oxide synthase; sGC, soluble guanylate cyclase; H-NOX, heme nitric-oxide binding domain; cyclic-di-GMP, bis-(3’−5’)-cyclic dimeric guanosine monophosphate; 5c or 6c, 5 coordinate or 6 coordinate (referring to the coordination number of the heme iron); OD, optical density; IPTG, isopropyl β-D-1-thiogalactopyranoside; PMSF, phenylmethanesulfonyl fluoride; FPLC, fast protein liquid chromatography; LC/UV/MS or LC/MS/DAD, liquid chromatography mass spectrometry with UV/visible diode array absorbance spectrometer, DEA-NONOate, diethylamine NONOate (a NO donor molecule); nm, nanometers; m/z, mass/charge number; HS or LS, high-spin or low-spin; mV, millivolts.
Supporting Information
NosP sequence alignment; NosP mass spec. demonstrating that NosP has non-covalent bound heme B; Pa NosP reduction potential determined by co-reduction with 5,5’,7,7’ indigo tetrasulphonate. This material is available free of charge via http://pubs.acs.org.
Accession Codes
References
- [1].Ignarro LJ, Cirino G, Casini A, and Napoli C (1999) Nitric oxide as a signaling molecule in the vascular system: An overview, J Cardiovasc Pharm 34, 879–886. [DOI] [PubMed] [Google Scholar]
- [2].Davidson SK, Koropatnick TA, Kossmehl R, Sycuro L, and McFall-Ngai MJ (2004) NO means ‘yes’ in the squid-vibrio symbiosis: nitric oxide (NO) during the initial stages of a beneficial association, Cell Microbiol 6, 1139–1151. [DOI] [PubMed] [Google Scholar]
- [3].Knowles RG, and Moncada S (1994) Nitric-Oxide Synthases in Mammals, Biochem J 298, 249–258. [DOI] [PMC free article] [PubMed] [Google Scholar]
- [4].Denninger JW, and Marletta MA (1999) Guanylate cyclase and the .NO/cGMP signaling pathway, Biochim Biophys Acta 1411, 334–350. [DOI] [PubMed] [Google Scholar]
- [5].Martin E, Berka V, Tsai AL, and Murad F (2005) Soluble guanylyl cyclase: The nitric oxide receptor, Method Enzymol 396, 478–492. [DOI] [PubMed] [Google Scholar]
- [6].Garthwaite J (2008) Concepts of neural nitric oxide-mediated transmission, Eur J Neurosci 27, 2783–2802. [DOI] [PMC free article] [PubMed] [Google Scholar]
- [7].Iyer LM, Anantharaman V, and Aravind L (2003) Ancient conserved domains shared by animal soluble guanylyl cyclases and bacterial signaling proteins, BMC Genomics 4, 5. [DOI] [PMC free article] [PubMed] [Google Scholar]
- [8].Nisbett LM, and Boon EM (2016) Nitric Oxide Regulation of H-NOX Signaling Pathways in Bacteria, Biochemistry-Us 55, 4873–4884. [DOI] [PMC free article] [PubMed] [Google Scholar]
- [9].Williams DE, Nisbett LM, Bacon B, and Boon E (2017) Bacterial Heme-Based Sensors of Nitric Oxide, Antioxid Redox Signal [DOI] [PMC free article] [PubMed] [Google Scholar]
- [10].Bacon B, Nisbett LM, and Boon E (2017) Bacterial Haemoprotein Sensors of NO: H-NOX and NosP, Adv Microb Physiol 70, 1–36. [DOI] [PMC free article] [PubMed] [Google Scholar]
- [11].Hossain S, and Boon EM (2017) Discovery of a Novel Nitric Oxide Binding Protein and Nitric-Oxide-Responsive Signaling Pathway in Pseudomonas aeruginosa, ACS Infect Dis 3, 454–461. [DOI] [PMC free article] [PubMed] [Google Scholar]
- [12].Hossain S, Nisbett LM, and Boon EM (2017) Discovery of Two Bacterial Nitric Oxide-Responsive Proteins and Their Roles in Bacterial Biofilm Regulation, Accounts Chem Res 50, 1633–1639. [DOI] [PMC free article] [PubMed] [Google Scholar]
- [13].Hoiby N, Bjarnsholt T, Givskov M, Molin S, and Ciofu O (2010) Antibiotic resistance of bacterial biofilms, Int J Antimicrob Ag 35, 322–332. [DOI] [PubMed] [Google Scholar]
- [14].Costerton JW, Stewart PS, and Greenberg EP (1999) Bacterial biofilms: a common cause of persistent infections, Science 284, 1318–1322. [DOI] [PubMed] [Google Scholar]
- [15].Stewart PS, and Costerton JW (2001) Antibiotic resistance of bacteria in biofilms, Lancet 358, 135–138. [DOI] [PubMed] [Google Scholar]
- [16].Lindsay D, and von Holy A (2006) Bacterial biofilms within the clinical setting: what healthcare professionals should know, J Hosp Infect 64, 313–325. [DOI] [PubMed] [Google Scholar]
- [17].Wenzel RP (2007) Health care-associated infections: major issues in the early years of the 21st century, Clin Infect Dis 45 Suppl 1, S85–88. [DOI] [PubMed] [Google Scholar]
- [18].Hossain S, Heckler I, and Boon EM (2018) Discovery of a Nitric Oxide Responsive Quorum Sensing Circuit in Vibrio cholerae, ACS Chem Biol 13, 1964–1969. [DOI] [PMC free article] [PubMed] [Google Scholar]
- [19].Tamayo R, Schild S, Pratt JT, and Camilli A (2008) Role of cyclic Di-GMP during el tor biotype Vibrio cholerae infection: characterization of the in vivo-induced cyclic Di-GMP phosphodiesterase CdpA, Infect Immun 76, 1617–1627. [DOI] [PMC free article] [PubMed] [Google Scholar]
- [20].Shikuma NJ, Fong JC, Odell LS, Perchuk BS, Laub MT, and Yildiz FH (2009) Overexpression of VpsS, a hybrid sensor kinase, enhances biofilm formation in Vibrio cholerae, J Bacteriol 191, 5147–5158. [DOI] [PMC free article] [PubMed] [Google Scholar]
- [21].Jung SA, Chapman CA, and Ng WL (2015) Quadruple quorum-sensing inputs control Vibrio cholerae virulence and maintain system robustness, PLoS Pathog 11, e1004837. [DOI] [PMC free article] [PubMed] [Google Scholar]
- [22].Pecastaings S, Allombert J, Lajoie B, Doublet P, Roques C, and Vianney A (2016) New insights into Legionella pneumophila biofilm regulation by c-di-GMP signaling, Biofouling 32, 935–948. [DOI] [PubMed] [Google Scholar]
- [23].Spiro TG (1974) Resonance Raman Spectroscopy: a New Structure Probe for Biological Chromophores, Resonance Raman Spectroscopy 7, 6. [Google Scholar]
- [24].Li XY, Czernuszewicz RS, Kincaid JR, Su YO, and Spiro TG (1990) Consistent Porphyrin Force-Field .1. Normal-Mode Analysis for Nickel Porphine and Nickel Tetraphenylporphine from Resonance Raman and Infrared-Spectra and Isotope Shifts, J Phys Chem-Us 94, 31–47. [Google Scholar]
- [25].Spiro TG (1988) Biological Application of Raman Spectroscopy, Vol. 3, Wiley, New York. [Google Scholar]
- [26].Kitagawa T, and Mizutani Y (1994) Resonance Raman-Spectra of Highly Oxidized Metalloporphyrins and Heme-Proteins, Coordin Chem Rev 135, 685–735. [Google Scholar]
- [27].Lee KB, Jun ES, Lamar GN, Rezzano IN, Pandey RK, Smith KM, Walker FA, and Buttlaire DH (1991) Influence of Heme Vinyl-Protein and Carboxylate Protein Contacts on Structure and Redox Properties of Bovine Cytochrome-B5, J Am Chem Soc 113, 3576–3583. [Google Scholar]
- [28].Funk WD, Lo TP, Mauk MR, Brayer GD, MacGillivray RT, and Mauk AG (1990) Mutagenic, electrochemical, and crystallographic investigation of the cytochrome b5 oxidation-reduction equilibrium: involvement of asparagine-57, serine-64, and heme propionate-7, Biochemistry-Us 29, 5500–5508. [DOI] [PubMed] [Google Scholar]
- [29].Reid LS, Mauk MR, and Mauk AG (1984) Role of Heme Propionate Groups in Cytochrome-B5 Electron-Transfer, J Am Chem Soc 106, 2182–2185. [Google Scholar]
- [30].Reid LS, Lim AR, and Mauk AG (1986) Role of Heme Vinyl Groups in Cytochrome-B5 Electron-Transfer, J Am Chem Soc 108, 8197–8201. [Google Scholar]
- [31].Spiro TG, Soldatova AV, and Balakrishnan G (2013) CO, NO and O-2 as vibrational probes of heme protein interactions, Coordin Chem Rev 257, 511–527. [DOI] [PMC free article] [PubMed] [Google Scholar]
- [32].Boon EM, Huang SH, and Marletta MA (2005) A molecular basis for NO selectivity in soluble guanylate cyclase, Nat Chem Biol 1, 53–59. [DOI] [PubMed] [Google Scholar]
- [33].Liu N, Xu Y, Hossain S, Huang N, Coursolle D, Gralnick JA, and Boon EM (2012) Nitric oxide regulation of cyclic di-GMP synthesis and hydrolysis in Shewanella woodyi, Biochemistry-Us 51, 2087–2099. [DOI] [PubMed] [Google Scholar]
- [34].Kharitonov VG, Sharma VS, Magde D, and Koesling D (1997) Kinetics of nitric oxide dissociation from five- and six-coordinate nitrosyl hemes and heme proteins, including soluble guanylate cyclase, Biochemistry-Us 36, 6814–6818. [DOI] [PubMed] [Google Scholar]
- [35].Dixon M (1971) The acceptor specificity of flavins and flavoproteins. I. Techniques for anaerobic spectrophotometry, Biochim Biophys Acta 226, 241–258. [DOI] [PubMed] [Google Scholar]
- [36].Deng TJ, Proniewicz LM, Kincaid JR, Yeom H, Macdonald IDG, and Sligar SG (1999) Resonance Raman studies of cytochrome P450BM3 and its complexes with exogenous ligands, Biochemistry-Us 38, 13699–13706. [DOI] [PubMed] [Google Scholar]
- [37].Hu S, and Kincaid JR (1991) Resonance Raman spectra of the nitric oxide adducts of ferrous cytochrome P450cam in the presence of various substrates, J Am Chem Soc 113, 9760–9766. [Google Scholar]
- [38].Martin E, Berka V, Sharina I, and Tsai AL (2012) Mechanism of binding of NO to soluble guanylyl cyclase: implication for the second NO binding to the heme proximal site, Biochemistry-Us 51, 2737–2746. [DOI] [PMC free article] [PubMed] [Google Scholar]
- [39].Massey VA (1991) A Simple Method for the Determination of Redox Potentials, In Flavins and flavoproteins 1990: Proceedings of the tenth international symposium, Como, Italy, July 15–20, 1990 (Curti B, Rochi S, Zanetti G, Ed.), pp 59–66, Walter DeGruyter & Co., Berlin, Germany. [Google Scholar]
- [40].Efimov I, Parkin G, Millett ES, Glenday J, Chan CK, Weedon H, Randhawa H, Basran J, and Raven EL (2014) A simple method for the determination of reduction potentials in heme proteins, FEBS Lett 588, 701–704. [DOI] [PMC free article] [PubMed] [Google Scholar]
- [41].Stone JR, and Marletta MA (1994) Soluble guanylate cyclase from bovine lung: activation with nitric oxide and carbon monoxide and spectral characterization of the ferrous and ferric states, Biochemistry-Us 33, 5636–5640. [DOI] [PubMed] [Google Scholar]
- [42].Aono S, Nakajima H, Saito K, and Okada M (1996) A novel heme protein that acts as a carbon monoxide-dependent transcriptional activator in Rhodospirillum rubrum, Biochem Biophys Res Commun 228, 752–756. [DOI] [PubMed] [Google Scholar]
- [43].Shelver D, Kerby RL, He Y, and Roberts GP (1997) CooA, a CO-sensing transcription factor from Rhodospirillum rubrum, is a CO-binding heme protein, Proc Natl Acad Sci U S A 94, 11216–11220. [DOI] [PMC free article] [PubMed] [Google Scholar]
- [44].Michel H, Behr J, Harrenga A, and Kannt A (1998) Cytochrome c oxidase: structure and spectroscopy, Annu Rev Biophys Biomol Struct 27, 329–356. [DOI] [PubMed] [Google Scholar]
- [45].Rice SL, Preimesberger MR, Johnson EA, and Lecomte JTJ (2014) Introduction of a covalent histidine-heme linkage in a hemoglobin: a promising tool for heme protein engineering, J Inorg Biochem 141, 198–207. [DOI] [PMC free article] [PubMed] [Google Scholar]
- [46].Stone JR, Sands RH, Dunham WR, and Marletta MA (1996) Spectral and ligand-binding properties of an unusual hemoprotein, the ferric form of soluble guanylate cyclase, Biochemistry-Us 35, 3258–3262. [DOI] [PubMed] [Google Scholar]
- [47].Boon EM, Davis JH, Tran R, Karow DS, Huang SH, Pan D, Miazgowicz MM, Mathies RA, and Marletta MA (2006) Nitric oxide binding to prokaryotic homologs of the soluble guanylate cyclase beta1 H-NOX domain, J Biol Chem 281, 21892–21902. [DOI] [PubMed] [Google Scholar]
- [48].George SJ, Andrew CR, Lawson DM, Thorneley RN, and Eady RR (2001) Stopped-flow infrared spectroscopy reveals a six-coordinate intermediate in the formation of the proximally bound five-coordinate NO adduct of cytochrome c’, J Am Chem Soc 123, 9683–9684. [DOI] [PubMed] [Google Scholar]
- [49].Herzik MA Jr., Jonnalagadda R, Kuriyan J, and Marletta MA (2014) Structural insights into the role of iron-histidine bond cleavage in nitric oxide-induced activation of H-NOX gas sensor proteins, Proc Natl Acad Sci U S A 111, E4156–4164. [DOI] [PMC free article] [PubMed] [Google Scholar]
- [50].Tsai AL, Martin E, Berka V, and Olson JS (2012) How do heme-protein sensors exclude oxygen? Lessons learned from cytochrome c’, Nostoc puntiforme heme nitric oxide/oxygen-binding domain, and soluble guanylyl cyclase, Antioxid Redox Signal 17, 1246–1263. [DOI] [PMC free article] [PubMed] [Google Scholar]
- [51].Champion PM, Gunsalus IC, and Wagner GC (1978) Resonance Raman Investigations of Cytochrome P450cam from Pseudomonas-Putida, J Am Chem Soc 100, 3743–3751. [Google Scholar]
- [52].Hu SZ, Morris IK, Singh JP, Smith KM, and Spiro TG (1993) Complete Assignment of Cytochrome-C Resonance Raman-Spectra Via Enzymatic Reconstitution with Isotopically Labeled Hemes, J Am Chem Soc 115, 12446–12458. [Google Scholar]
- [53].Hu SZ, Smith KM, and Spiro TG (1996) Assignment of protoheme Resonance Raman spectrum by heme labeling in myoglobin, J Am Chem Soc 118, 12638–12646. [Google Scholar]
- [54].Mak PJ, Kaluka D, Manyumwa ME, Zhang HQ, Deng TJ, and Kincaid JR (2008) Defining resonance Raman spectral responses to substrate binding by cytochrome P450 from Pseudomonas putida, Biopolymers 89, 1045–1053. [DOI] [PMC free article] [PubMed] [Google Scholar]
- [55].Mak PJ, Podstawka E, Kincaid JR, and Proniewicz LM (2004) Effects of systematic peripheral group deuteration on the low-frequency resonance Raman spectra of myoglobin derivatives, Biopolymers 75, 217–228. [DOI] [PubMed] [Google Scholar]
- [56].Zbylut SD, and Kincaid JR (2002) Resonance Raman evidence for protein-induced out-of-plane distortion of the heme prosthetic group of mammalian lactoperoxidase, J Am Chem Soc 124, 6751–6758. [DOI] [PubMed] [Google Scholar]
- [57].Uchida T, and Kitagawa T (2005) Mechanism for transduction of the ligand-binding signal in heme-based gas sensory proteins revealed by resonance Raman spectroscopy, Acc Chem Res 38, 662–670. [DOI] [PubMed] [Google Scholar]
- [58].Laberge M, Yonetani T, and Fidy J (2003) Normal coordinate structural decomposition of the heme distortions of hemoglobin in various quaternary states and bound to allosteric effectors, Mol Divers 7, 15–23. [DOI] [PubMed] [Google Scholar]
- [59].Chan MK (2001) Recent advances in heme-protein sensors, Curr Opin Chem Biol 5, 216–222. [DOI] [PubMed] [Google Scholar]
- [60].Olea C, Boon EM, Pellicena P, Kuriyan J, and Marletta MA (2008) Probing the function of heme distortion in the H-NOX family, ACS Chem Biol 3, 703–710. [DOI] [PMC free article] [PubMed] [Google Scholar]
- [61].Shelnutt JA, Song XZ, Ma JG, Jia SL, Jentzen W, and Medforth CJ (1998) Nonplanar porphyrins and their significance in proteins, Chem Soc Rev 27, 31–41. [Google Scholar]
- [62].Sun YH, Benabbas A, Zeng WQ, Kleingardner JG, Bren KL, and Champion PM (2014) Investigations of heme distortion, low-frequency vibrational excitations, and electron transfer in cytochrome c, P Natl Acad Sci USA 111, 6570–6575. [DOI] [PMC free article] [PubMed] [Google Scholar]
- [63].Pellicena P, Karow DS, Boon EM, Marletta MA, and Kuriyan J (2004) Crystal structure of an oxygen-binding heme domain related to soluble guanylate cyclases, P Natl Acad Sci USA 101, 12854–12859. [DOI] [PMC free article] [PubMed] [Google Scholar]
- [64].Olea C, Boon EM, Pellicena P, Kuriyan J, and Marletta MA (2008) Probing the Function of Heme Distortion in the H-NOX Family, Acs Chem Biol 3, 703–710. [DOI] [PMC free article] [PubMed] [Google Scholar]
- [65].Muralidharan S, and Boon EM (2012) Heme flattening is sufficient for signal transduction in the H-NOX family, J Am Chem Soc 134, 2044–2046. [DOI] [PubMed] [Google Scholar]
- [66].Pal B, and Kitagawa T (2005) Interactions of soluble guanylate cyclase with diatomics as probed by resonance Raman spectroscopy, Journal of Inorganic Biochemistry 99, 267–279. [DOI] [PubMed] [Google Scholar]
- [67].Martin E, Czarnecki K, Jayaraman V, Murad F, and Kincaid J (2005) Resonance Raman and infrared spectroscopic studies of high-output forms of human soluble guanylyl cyclase, J Am Chem Soc 127, 4625–4631. [DOI] [PubMed] [Google Scholar]
- [68].Argade PV, Sassaroli M, Rousseau DL, Inubushi T, Ikedasaito M, and Lapidot A (1984) Confirmation of the Assignment of the Iron Histidine Stretching Mode in Myoglobin, J Am Chem Soc 106, 6593–6596. [Google Scholar]
- [69].Wells AV, Sage JT, Morikis D, Champion PM, Chiu ML, and Sligar SG (1991) The Iron Histidine Mode of Myoglobin Revisited - Resonance Raman Studies of Isotopically Labeled Escherichia-Coli Expressed Myoglobin, J Am Chem Soc 113, 9655–9660. [Google Scholar]
- [70].Antonini E, and Brunori M (1971) Hemoglobin and myoglobin in their reactions with ligands, North-Holland Pub. Co., Amsterdam,. [Google Scholar]
- [71].Vogel KM, Kozlowski PM, Zgierski MZ, and Spiro TG (2000) Role of the axial ligand in heme-CO backbonding; DFT analysis of vibrational data, Inorg Chim Acta 297, 11–17. [Google Scholar]
- [72].Spiro TG, and Wasbotten IH (2005) CO as a vibrational probe of heme protein active sites, Journal of Inorganic Biochemistry 99, 34–44. [DOI] [PubMed] [Google Scholar]
- [73].Li XY, and Spiro TG (1988) Is Bound Co Linear or Bent in Heme-Proteins - Evidence from Resonance Raman and Infrared Spectroscopic Data, J Am Chem Soc 110, 6024–6033. [DOI] [PubMed] [Google Scholar]
- [74].Mak PJ, Im SC, Zhang HM, Waskell LA, and Kincaid JR (2008) Resonance Raman studies of cytochrome P4502B4 in its interactions with substrates and redox partners, Biochemistry-Us 47, 3950–3963. [DOI] [PubMed] [Google Scholar]
- [75].Mak PJ, Gregory MC, Sligar SG, and Kincaid JR (2014) Resonance Raman Spectroscopy Reveals That Substrate Structure Selectively Impacts the Heme-Bound Diatomic Ligands of CYP17, Biochemistry-Us 53, 90–100. [DOI] [PMC free article] [PubMed] [Google Scholar]
- [76].Girvan HM, Bradley JM, Cheesman MR, Kincaid JR, Liu Y, Czarnecki K, Fisher K, Leys D, Rigby SE, and Munro AW (2016) Analysis of Heme Iron Coordination in DGCR8: The Heme-Binding Component of the Microprocessor Complex, Biochemistry-Us 55, 5073–5083. [DOI] [PubMed] [Google Scholar]
- [77].Liu YL, McLean KJ, Munro AW, and Kincaid JR (2018) Resonance Raman studies of Bacillus megaterium cytochrome P450 BM3 and biotechnologically important mutants, J Raman Spectrosc 49, 287–297. [Google Scholar]
- [78].Fan BC, Wang JL, Stuehr DJ, and Rousseau DL (1997) NO synthase isozymes have distinct substrate binding sites, Biochemistry-Us 36, 12660–12665. [DOI] [PubMed] [Google Scholar]
- [79].Wang JL, Stuehr DJ, and Rousseau DL (1997) Interactions between substrate analogues and heme ligands in nitric oxide synthase, Biochemistry-Us 36, 4595–4606. [DOI] [PubMed] [Google Scholar]
- [80].Jung C, Hoa GHB, Schroder KL, Simon M, and Doucet JP (1992) Substrate-Analog Induced Changes of the Co-Stretching Mode in the Cytochrome-P450cam-Carbon Monoxide Complex, Biochemistry-Us 31, 12855–12862. [DOI] [PubMed] [Google Scholar]
- [81].Uno T, Nishimura Y, Makino R, Iizuka T, Ishimura Y, and Tsuboi M (1985) The Resonance Raman Frequencies of the Fe-Co Stretching and Bending Modes in the Co Complex of Cytochrome P-450cam, Journal of Biological Chemistry 260, 2023–2026. [PubMed] [Google Scholar]
- [82].Nagano S, Shimada H, Tarumi A, Hishiki T, Kimata-Ariga Y, Egawa T, Suematsu M, Park SY, Adachi S, Shiro Y, and Ishimura Y (2003) Infrared spectroscopic and mutational studies on putidaredoxin-induced conformational changes in ferrous CO-P450cam, Biochemistry-Us 42, 14507–14514. [DOI] [PubMed] [Google Scholar]
- [83].Tran R, Weinert EE, Boon EM, Mathies RA, and Marletta MA (2011) Determinants of the Heme-CO Vibrational Modes in the H-NOX Family, Biochemistry-Us 50, 6519–6530. [DOI] [PMC free article] [PubMed] [Google Scholar]
- [84].Phillips GN, Teodoro ML, Li TS, Smith B, and Olson JS (1999) Bound CO is a molecular probe of electrostatic potential in the distal pocket of myoglobin, J Phys Chem B 103, 8817–8829. [Google Scholar]
- [85].Cameron AD, Smerdon SJ, Wilkinson AJ, Habash J, Helliwell JR, Li TS, and Olson JS (1993) Distal Pocket Polarity in Ligand-Binding to Myoglobin - Deoxy and Carbonmonoxy Forms of a Threonine(68)(E11) Mutant Investigated by X-Ray Crystallography and Infrared-Spectroscopy, Biochemistry-Us 32, 13061–13070. [DOI] [PubMed] [Google Scholar]
- [86].Tomita T, Hirota S, Ogura T, Olson JS, and Kitagawa T (1999) Resonance Raman investigation of Fe-N-O structure of nitrosylheme in myoglobin and its mutants, J Phys Chem B 103, 7044–7054. [Google Scholar]
- [87].Spiro TG, Ibrahim M, and Wasbotten I (2008) Chapter 4. CO, NO, and O2 as vbrational probes of heme protein active sites, In The Smallest Biomolecules: Diatomics and their Interactions with Heme Proteins (Ghosh A, Ed.), p 95, Elsevier. [Google Scholar]
- [88].Servid AE, McKay AL, Davis CA, Garton EM, Manole A, Dobbin PS, Hough MA, and Andrew CR (2015) Resonance Raman Spectra of Five-Coordinate Heme-Nitrosyl Cytochromes c ‘: Effect of the Proximal Heme-NO Environment, Biochemistry-Us 54, 3320–3327. [DOI] [PubMed] [Google Scholar]
- [89].Clark WM, Cohen B, and Gibbs HD (1925) Studies on Oxidation-Reduction: VIII. Methylene Blue, Public Health Reports (1896–1970) 40, 1131–1201. [Google Scholar]
- [90].Sullivan MX, Cohen B, and Clark WM (1923) Studies on Oxidation-Reduction. IV. Electrode Potentials of Indigo Sulphonates, Each in Equilibrium with Its Reduction Product, Public Health Reports (1896–1970) 38, 1669–1718. [Google Scholar]
- [91].Hauser K, Mao J, and Gunner MR (2004) pH dependence of heme electrochemistry in cytochromes investigated by multiconformation continuum electrostatic calculations, Biopolymers 74, 51–54. [DOI] [PubMed] [Google Scholar]
- [92].Zheng Z, and Gunner MR (2009) Analysis of the electrochemistry of hemes with E(m)s spanning 800 mV, Proteins 75, 719–734. [DOI] [PMC free article] [PubMed] [Google Scholar]
- [93].Stone JR, and Marletta MA (1996) Spectral and kinetic studies on the activation of soluble guanylate cyclase by nitric oxide, Biochemistry-Us 35, 1093–1099. [DOI] [PubMed] [Google Scholar]
- [94].Olea C Jr., Herzik MA Jr., Kuriyan J, and Marletta MA (2010) Structural insights into the molecular mechanism of H-NOX activation, Protein Sci 19, 881–887. [DOI] [PMC free article] [PubMed] [Google Scholar]
- [95].Dai Z, Farquhar ER, Arora DP, and Boon EM (2012) Is histidine dissociation a critical component of the NO/H-NOX signaling mechanism? Insights from X-ray absorption spectroscopy, Dalton Trans 41, 7984–7993. [DOI] [PMC free article] [PubMed] [Google Scholar]
- [96].Zhao Y, Brandish PE, Ballou DP, and Marletta MA (1999) A molecular basis for nitric oxide sensing by soluble guanylate cyclase, Proc Natl Acad Sci U S A 96, 14753–14758. [DOI] [PMC free article] [PubMed] [Google Scholar]
- [97].Traylor TG, Duprat AF, and Sharma VS (1993) Nitric oxide-triggered heme-mediated hydrolysis: a possible model for biological reactions of NO, J Am Chem Soc 115, 810–811. [Google Scholar]
- [98].Decatur SM, Franzen S, DePillis GD, Dyer RB, Woodruff WH, and Boxer SG (1996) Trans effects in nitric oxide binding to myoglobin cavity mutant H93G, Biochemistry-Us 35, 4939–4944 [DOI] [PubMed] [Google Scholar]
Associated Data
This section collects any data citations, data availability statements, or supplementary materials included in this article.