Abstract
Mass spectrometry (MS) has longstanding applications in radiochemistry laboratories, stemming from carbon-dating. However, research on the development of radiotracers for molecular imaging with either positron emission tomography (PET) or single photon emission computed tomography has yet to take full advantage of MS. This inertia has been attributed to the relatively low concentrations of radiopharmaceutical formulations and lack of access to the required MS equipment due to the high costs for purchase and maintenance of specialized MS systems. To date, single quadrupole (SQ)-MS coupled to liquid chromatography (LC) systems is the main form of MS that has been used in radiochemistry laboratories. These LC/MS systems are primarily used for assessing the chemical purity of radiolabeling precursor or standard molecules but also have applications in the determination of metabolites. Herein, we highlight personal experiences using a compact SQ-MS in our PET radiochemistry laboratories, to monitor the small amounts of carrier observed in most radiotracer preparations, even at high molar activities. The use of a SQ-MS in the observation of the low mass associated with non-radioactive species which are formed along with the radiotracer from the trace amounts of carrier found is demonstrated. Herein, we describe a pre-concentration system to detect dilute radiopharmaceutical formulations and metabolite analyses by SQ-MS. Selected examples where SQ-MS was critical for optimization of radiochemical reactions and for unequivocal characterization of radiotracers are showcased. We also illustrate examples where SQ-MS can be applied in identification of radiometal complexes and development of a new purification methodology for Pd-catalyzed radiofluorination reactions, shedding light on the identity of metal complexes present in the labelling solution.
2. Introduction
Mass spectrometry (MS) is among the most well-established structural characterization methods used in the field of chemistry.[1–6] MS has an established role in radiochemistry, particularly in radiocarbon dating.[7] For instance, the introduction of accelerator mass spectrometry (AMS) technology as a means of measuring natural levels of 14C has been described as the "Third Radiocarbon Revolution."[8] Elsewhere in radiochemistry, single quadrupole (SQ)-MS has become the most widely used MS method. In combination with liquid chromatography (LC) systems, LC/MS has become commonplace for standard quality control analysis of radioactive precursors and standards. LC/MS is also used increasingly for detection of metabolites/radiometabolites to assess radiochemical stability in vitro and ex vivo, as well as to identify potential radiotracers for neuroimaging.[9–12] Whereas radiochemistry with 3H and 14C have benefitted from the advances of MS, radiochemistry for molecular imaging by positron emission tomography (PET) or single photon emission computed tomography (SPECT) has yet to take full advantage of MS technology. The historically high cost of MS purchase, maintenance and operation of this specialized instrumentation are likely key factors which have held back MS from more widespread use in PET or SPECT radiochemistry laboratories. Furthermore, the relatively low concentrations (vide infra) of radiopharmaceutical formulations, and the regulatory restrictions around radioactivity in a central core MS laboratory, have also impeded access of this technology to PET and SPECT chemists.
Our radiopharmaceutical programs focus on the development of novel radiochemical reactions and on the characterization of new PET radiotracers for medical imaging in drug discovery and clinical research.[13] The majority of our clinical research employs two radionuclides: carbon-11 (11C; t1/2 = 20.4 min) or fluorine-18 (18F; t1/2 = 109.7 min). Unfortunately, the sensitivity of SQ-MS is not sufficient to detect the radiolabelled species themselves in typical clinical-grade radiopharmaceutical formulations. For example, clinical-grade 18F-labelled PET radiotracers have typical specific activities around 5 Ci/μmol with administered radioactive doses in humans around 10 to 20 mCi.[14] For an average human male (~75 kg) this administered dose of radiotracer equates to around ~2 to 4 nmol (ca. 25 to 50 pmol/kg body weight). Given the theoretical maximum specific activity of fluorine-18 (1712.9 Ci/μmol), typical 18F-radiotracers have an isotopic dilution factor of around ~350 (equivalent to approximately one radioactive atom for every 350 non-radioactive 19F atoms; ~0.3%). Hence, the number of moles of radioactive species present in a standard human injection is around 6 to 12 pmol. For carbon-11 radiotracers, even smaller quantities of radiolabelled material are produced in clinical productions. For example, the number of atoms contained in 10 mCi of 11C is ~6.5 × 10¹¹ atoms, equivalent to 1.08 × 10⁻¹² moles.[15] Using a typical radioactive concentration of 10 mCi/mL, a 5 μL injection used for standard LC/MS analysis represents only ~5 femtomoles of the 11C-labeled radiotracer. These calculations illustrate that the vast majority of PET radiotracers observe the tracer principle,[16] wherein the chemical dose of administered PET radiotracers is so small that the agents have no effect on biochemical processes in vivo. Although a SQ-MS cannot determine the amount of radioisotope in a sample, MS has found applications in PET radiochemistry,[17–19] specifically for radiometabolite analysis.[20]
Herein, we showcase applications of a compact SQ-MS in our laboratories. Specifically, we describe the use of SQ-MS for: 1) coupling with a novel pre-concentration system to detect dilute radiopharmaceutical formulations and application of this system in metabolite analyses; 2) optimization of radiochemical reactions and simultaneous characterization of 11C- and 18F-labeled radiotracers; 3) purification and identification of radiometal complexes with 89Zr and Pd-catalyzed radiofluorination reactions.
3. Integration of a Pre-concentration System to a SQ-MS
For practical applications of SQ-MS in PET radiochemistry, it is necessary to increase the sample concentration. The major benefit of a pre-concentration step in PET radiotracer analysis is the ability to concentrate the non-radioactive (cold) mass associated with the radioactive species. Concentrating the sample also helps to eliminate (or significantly reduce) interferences, such as salts (trifluoroacetic acid, phosphate etc.) or high concentrations of solvents such as dimethyl sulfoxide (DMSO), acetonitrile or other organic solvents that may affect the chromatography directly or cause suppression of the mass spectrometry signal. Pre-concentration systems have been used in the determination of metals and ions since the late 1970’s.[21] Initially these systems found their major use in groundwater analysis and generally consist of an injector system where the injection loop has been replaced by an adsorbent.[2, 22–24] However, other modifications including the replacement of the injection loop with an electrochemical cell for the pre-concentration of divalent metals[25] were reported. The basic trapping system replaces the injection loop with a trapping cartridge and the rest of the system remains as standard for the chromatography system. The sample may require dilution using water to allow the desired materials to be trapped and can be washed with water or a suitable eluting solvent to remove salts, ion pairs etc. that may interfere with the chromatography or to eliminate/reduce materials that are not well retained but are present in high concentration. From a radiochemical perspective, these pre-concentration systems are analogous to solid-phase strong cation exchange methods that are used to trap 68Ga3+ ions and purify the radionuclide from non-radioactive impurities (Zn2+, Fe3+ etc.) and radioactive materials (68Ge) that are leached during standard 68Ga-generator elution protocols.
An example of the utility of the pre-concentration system is shown in Figure 2, where for comparison approximately 0.8 pmol (5 μL of a 0.16 nmol/mL solution) of the Kallikrein inhibitor peptide (Ac-Pro-Phe-Arg-Ser-Val-Gln-NH2) was injected onto the LC/MS system. The protonated molecular ion peak, [M+H]+, can be observed in the mass spectrum at an m/z 774.6 (monoisotopic MW = 773.4); however, there is considerable noise in the spectrum. The additional noise in the mass spectra makes it difficult to determine which of the peaks are attributed to the desired compound. It is possible to concentrate the sample by evaporation, assuming the sample is stable to the process.
Figure 2.
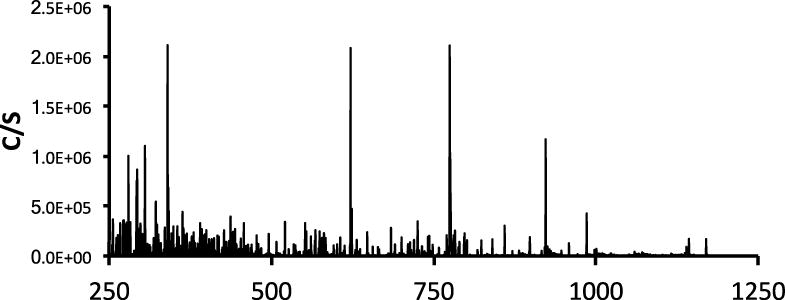
Mass spectrum obtained from a 5 μL injection of the Kallikrein inhibitor peptide (Ac-Pro-Phe-Arg-Ser-Val-Gln-NH2) solution (0.16 nmol/mL) on to the LC/MS system. The intensity of the [M+H]+ peak is similar to the other noise peaks.
The use of the pre-concentration system allows the user to increase the amount of mass injected on to the LC-SQ-MS system with minimal manipulations and with minimal losses. Figure 3 shows the effect of concentrating a 1 mL sample of the 0.16 nmol/mL solution of the same Kallikrein Inhibitor peptide (Ac-Pro-Phe-Arg-Ser-Val-Gln-NH2) observed in Figure 2. In this case, concentrating the sample increased the amount of peptide to be injected on to the LC/MS system to ~160 pmol. The ability to wash the trapping cartridge, after the trapping of the compound of interest, reduces the salts and solvent present while not increasing the volume of the sample injected to the analytical column. The mass spectrum observed in Figure 3 is absent of other interfering peaks and the signal to noise is extremely high. Thus, pre-concentration greatly improved the signal-to-noise ratio and overall quality of the spectrum obtained.
Figure 3.

Mass spectrum obtained from 1 mL of the Kallikrein Inhibitor peptide (Ac-Pro-Phe-Arg-Ser-Val-Gln-NH2) solution (0.16 nmol/mL), concentrated on the trapping cartridge containing a hydrophilic modified styrene polymer solid phase extraction material (HLB). The cartridge was then washed with water (5 mL, LC/MS grade) to remove contaminants such as saline and was then injected on to the LC/MS system. The protonated molecular ion, [M+H]+, is the only peak seen in the mass spectrum.
4.0 Metabolite Analysis
Given the importance of assessing the metabolism of a radiopharmaceutical in vivo for quantitative analysis it is not surprising that LC/MS has found applications in PET imaging studies.[20] A basic outline of the methodology for LC/MS based metabolomics was described by Zhou et al.[26] With access to a high sensitivity triple quadrupole MS, Shetty et al[27] determined that it is possible to observe 11C-labeled species and their respective 12C ([M+1]) isotopologues/carriers for four PET radiotracers. While the sensitivity of the SQ cannot observe the radioisotopically labelled species, it is still possible to obtain data by observing the small amount of “carrier” material or metabolites when present. Typically, when performing metabolite analysis on a new radiotracer, the most common types of information obtained are simply to what extent metabolites are observed and whether these metabolites are more or less lipophilic that the parent radiotracer. Detailed knowledge of the chemical composition and structure of radiometabolites is often lacking. A common method for the analysis of metabolites is a column-switching approach reported by Hilton et al.[28] Column-switching HPLC has been used extensively in the analysis of drugs and their metabolites in plasma.[29, 30] The materials trapped on the capture column are then eluted directly onto an analytical chromatographic column, without loss of materials during the transfer. In the paper by Hilton sample sizes of up to 4 mL of plasma were used. Recently, we reported an automated version of this column-switching HPLC system.[31, 32]
An alternative pre-concentration methodology for dilute radiotracer samples, including plasma, takes advantage of thin layer chromatography (TLC) to separate the intact radiotracer[33, 34] from metabolites. The benefit of using TLC is two-fold: first, larger amounts of material can be spotted on to the TLC plate (up to 250 μL of plasma) without the need to remove all proteins from the sample; second, by extending the time that the TLC plate is exposed to the phosphorimager plate of a Cyclone Plus Storage Phosphor System (PerkinElmer, Inc., Waltham, MA USA) or using an AR-2000 (Eckert & Ziegler Radiopharma Inc., Hopkinton MA, USA) the entire TLC lane can be imaged over a set period of time or can be set to continue to collect data until a sufficient number of counts are detected.
Figure 4 shows the radiochemical methylation reaction of the phenolic precursor to form the GSK-3 radiotracer [11C]PF-367. TLC metabolite analysis was performed on a 1 mL plasma sample obtained at various times post-injection of the glycogen synthase kinase 3 (GSK-3) radiotracer, [11C]PF-367 (Figure 4, monoisotopic molecular weight 361.1) to which 135μg/kg of “cold” PF-367 had been administered.[35] Analysis of the TLC plate by MS-SQ was performed by automatically extracting the soluble materials from the TLC plate at a spacing interval of ~4 mm, and thirty to thirty-five separate spots on each TLC plate were analyzed (Figure 5).
Figure 4.

Radiochemical synthesis of the glycogen synthase kinase 3 (GSK-3) radiotracer, [11C]PF-367
Figure 5.

TLC/MS of the plasma sample, [11C]PF-367. The arrows indicate the positions that were sampled by the TLC/MS system. The silica is sometimes removed during the process and this is indicated by the dark oval. For the 1 minute post injection plasma sample, the blue arrows indicate the position where the proteins, di and tri-glycerides were observed. The green arrow indicates the position where the parent compound, [11C]PF-367 was observed.
In the case of PF-367, the most intense peaks, observed were for the [M+Na]+, and were seen at m/z 384.1 for the parent compound + sodium ion and m/z 370.1 for the precursor + sodium ion (Figure 6).
Figure 6.
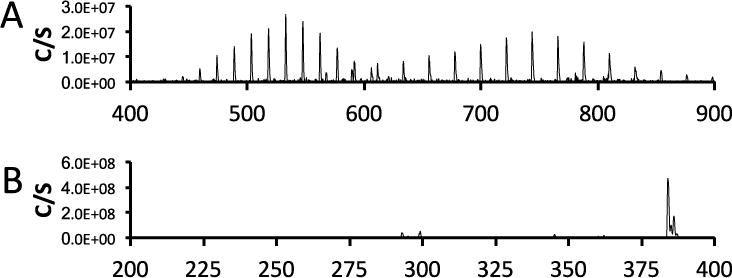
Mass spectra of compounds identified in the TLC analysis of the plasma sample obtained at 1 minute post injection A: Spectrum obtained from material at an Rf of 0 - 0.1 (Blue arrows in Figure 5) and indicates the presence of proteins, triglycerides and diglycerides. C: Spectrum from peak at Rf = 0.9 (Green arrow in Figure 5) indicates the presence of the intact PF-367.
To highlight the use of the trapping system method (vide supra) for the determination of metabolites, the plasma sample obtained at 10 minutes post-injection of the glycogen synthase kinase 3 (GSK-3) radiotracer, [11C]PF-367 (Figure 4) to which 135μg/kg of “cold” PF-367 had been administered.[35] In this case, ~100 μL of plasma was injected onto the trapping cartridge followed by washing with 5 mL of 1% acetonitrile/water to remove salts. The material trapped was analyzed by LC/MS and the resulting total ion chromatogram (TIC) is shown in Figure 7. The chromatogram was then extracted to obtain the intensity of the protonated parent compound ([M+H]+ = 362.1) and the protonated precursor ([M+H]+ = 348.1). The XIC is a means of obtaining a chromatogram without the other masses which are not related to the ions being investigated. The metabolism of a compound may be predicted by using the MetaPrint2D-React metabolic product predictor, which can be found on the Center for Molecular Informatics website (University of Cambridge, http://www-metaprint2d.ch.cam.ac.uk/metaprint2d-react/). In the case of PF-367, the major predicted metabolite coincides with the observed demethylated phenol, production of which is attributed to metabolism by P-450 enzymes in vivo.[36]
Figure 7.
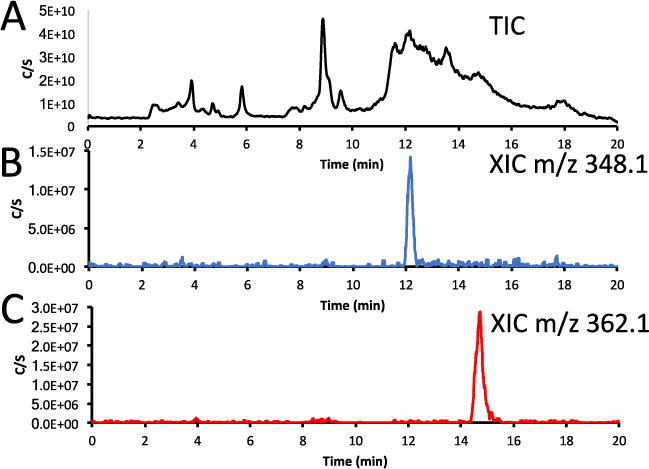
Plasma metabolite sample 10 minutes post-injection of the glycogen synthase kinase 3 (GSK-3) radiotracer, [11C]PF-367 (Figure 4) to which 135μg/kg of “cold” PF-367 had been administered. A: Total ion chromatogram of PF-367 plasma sample. B: Extracted ion chromatogram (XIC) of the protonated primary expected metabolite m/z 348.1 (demethylated phenol). C: Extracted ion chromatogram (XIC) of the protonated parent compound of [M+H]+ m/z 362.1.
5. Analysis of PET reactions to optimize reaction conditions
The many advantages of using MS during the optimization process for producing radiotracers are illustrated by our [18F]fluoride displacement and [11C]CO2 fixation reactions. During our radiochemical development phase, we obtain mass spectra on the major ions, and especially the chemical impurities formed from the non-radioactive reagents to allow for the optimization of the reaction and the minimization of potential co-eluting impurities, thereby facilitating our purification steps. For example, mass spectrometry was critical in our two-step microfluidic radiosynthesis of the high affinity partial agonist of the serotonin 1A receptor, [18F]FEMPT (pKi = 9. 79; Ki = 0.16 nM).[37]
As depicted in Figure 8, initially, high concentrations of the diethyl tosylate resulted in low radiochemical incorporation yields of the radiofluorinated product, however the formation of the intermediate [18F]fluoroethyltosylate was high (~55-60%). The LC/MS of this reaction mixture showed large amounts of the tosylate, hydroxyl and the elimination product in the reaction mixture. By reducing the concentration of ethyl ditosylate and hence; reducing the competition of the precursor for either [18F]fluoroethyltosylate or diethyltosyltate, the radiochemical incorporation yield was increased and the chemical impurities were reduced. This allowed for significantly simpler separation conditions to be used and allowed for higher chemical and radiochemical purity.
Figure 8.

Radiosynthesis of [18F]FEMPT. In the first microfluidic reactor two products are found at the output of the first reactor, The desired [18F]fluoroethyltosylate and the starting reagent ethylditosylate. The output of the first reactor is directly fed into the second reactor. Using high concentrations of the ethylditosylate in the first reactor, the major product was the TosylEMPT and hydroxylEMPT. However by minimizing the diethyltosylate in the first reactor, the major products were the desired [18F]FEMPT, and small amounts of the hydroxylEMPT, tosylEMPT and ethyleneMPT.
To determine the products being formed during the radiosynthesis the final formulation were analyzed by LC/MS using 1 mL of the final product solution trapped on the concentration system as described in section 3 (vide supra). The direct HPLC injection of 5 μL of reaction mixture revealed no observable UV signal. However, when 1 mL of the solution of the purified radiotracer was injected via the trapping system, the UV traces indicates the presence of a number of species with retention times close to the desired product (Figure 8).
A number of the observed impurities were able to be identified using LC/MS and the major impurities observed were the expected elimination product and the hydroxyl product. However, all of these materials were below the mass seen for the desired FEMPT and the combined signals were used in the molar activity calculation. Overall, [18F]FEMPT was obtained in ~7% isolated radiochemical yield and in >98% radiochemical and chemical purity. The molar activity of the final product was determined to be >148 GBq/μmol (>4 Ci/μmol).
A large number of [11C]CO2 fixation reactions,[38–42] which can now be performed “in-loop” to form 11C-labelled carbamates, oxazolidinones and ureas (Figure 10) were studied using LC/MS to determine the products formed during the reaction by monitoring the small mass of non-radioactive species formed.[43] Sufficient non-radiolabeled mass of material is produced even at high molar activities (≥1 Ci/μmol) to obtain MS data on the species formed during the radiosynthesis. It is noteworthy that for these reactions, the intermediates and products formed during the reactions are readily ionized using an electrospray ionization (ESI) source yielding high signal-to-noise ratios.
Figure 10.

A: Radiosynthesis of the desired product, methyl N-benzylcarbamate using [11C]CO2 fixation methodology to form the intermediate [11C]isocyanate, which then reacts with methanol to produce the carbamate. B: By-product of the radiosynthesis where the symmetrical urea, 1,3-dibenzylurea, is formed by reaction of the intermediate [11C]isocyanate reacts with another molecule of benzylamine.
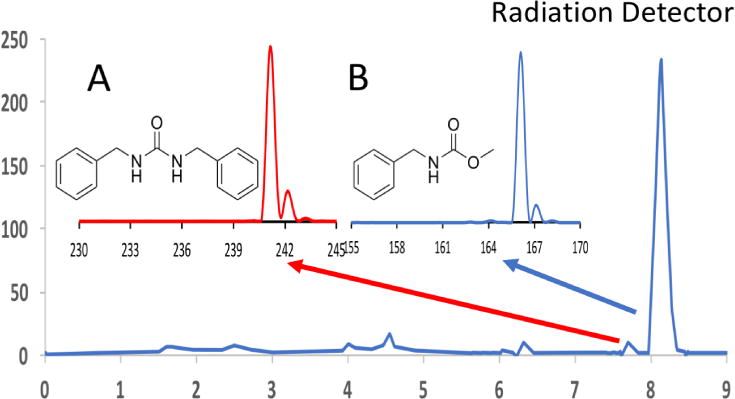
Interestingly, the major 11C-labelled product that was obtained had a different retention time than the standard molecule, methyl N-benzylcarbamate. The results of the radioactive-LC/MS analysis are shown in Figure 11. It should be noted that the radioactive species, observed at retention times of ~7.8 and 8.1 minutes were not observed using SQ-MS, but the small amount of non-radioactive mass (always present during the radiosynthesis) was seen. The mass spectrum of the major peak at a retention time of ~7.8 min had a major ion at m/z 241.1, which did is not the desired carbamate, but corresponds to the protonated molecular ion, [M+H]+ of the symmetrical urea, N,N′-dibenzylurea (Figure 11, inset A). The minor radioactive peak, at the retention time of ~8.1 min, had a major ion that did correspond to the protonated molecular ion [M+H]+ ion of the desired carbamate, methyl N-benzylcarbamate (Figure 11, inset B)
Figure 11.
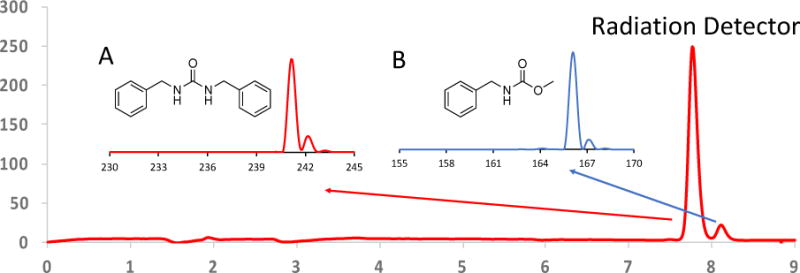
Radio-HPLC showing the radiation detector output for products of the [11C]CO2 fixation with benzylamine and methanol. Inset A: Mass spectrum obtained from the major radiation peak, (Red arrow) which does not correspond to the desired methyl N-benzylcarbamate, but to the [M+H]+ of N,N’-dibenzylurea, m/z 241.1. Inset B: Mass spectrum obtained from the minor radioactive peak at a retention time of ~8.1′ (Blue arrow), which has the correct [M+H]+ ion for the desired carbamate, m/z 166.1
By knowing the identity of the major impurity (N,N′-dibenzylurea) observed in the radio-HPLC of the initial reaction attempted, it was possible to modify the reaction conditions to minimize the formation of the symmetrical urea (Figure 12). Judicious control of the reaction conditions allowed chemoselective synthesis of the desired 11C-carbamate as the major product.[43]
Figure 12.
With insight from MS, the reaction conditions were altered to synthesize the desired carbamate as the major product, and the symmetrical urea was significantly suppressed.
In the past, to obtain positive and negative ion scans it was necessary to perform two different analyses. With improvements in electronics and mass spectrometer design, most commercial SQ-MS systems now can rapidly change the parameters of the ion source and mass spectrometer. The typical use of this switching ability is to obtain both positive and negative ions at the same time. However, it is also possible to use the same polarity but to alter the ion source characteristics, such as source voltage, etc. This can be used to either induce or to minimize fragmentation during the analysis, which effectively occurs simultaneously, and both molecular ion and fragmentation data can be obtained in the same analysis. An example of this is illustrated in Figure 13, where the standard ion source settings and ion source settings with the source voltage raised 30V above the standard settings. With the standard ion source settings, only the protonated molecular ion is observed for the Kallikrein Inhibitor peptide (Ac-Pro-Phe-Arg-Ser-Val-Gln-NH2). The mass spectrum obtained using the ion source setting with the higher source voltage, it can easily be seen that there has been increased fragmentation and this information can be used to determine additional structural information.
Figure 13.
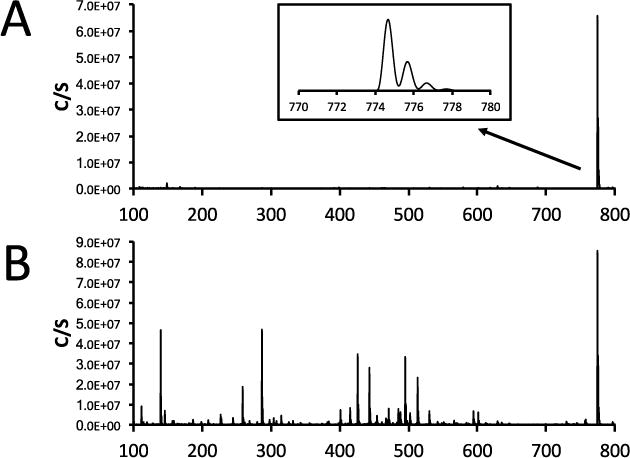
A: Mass spectrum which shows only the protonated molecular ion obtained during LC-SQ-MS run using the standard ion source parameter which minimize fragmentation, Inset: Expanded plot showing molecular ion region; B: During the same run as above, the ion source voltage was increase by 30V to induce fragmentation and as observed in the mass spectrum, there is further information which can aid in the elucidation of structure.
6. Purification and identification of metal complexes
The development of radiotracers based on radioactive metal ion complexes is becoming increasingly important for both nuclear imaging and molecularly targeted radiotherapy. Often, coordination chemistry is employed to attach radiometal ions to biological targeting vectors such as peptides, proteins, antibodies, and more elaborate systems based on nanoparticles.[44, 45] Coordination of the metal ion relies on derivatizing the vector with a bifunctional chelate (BFC). The BFC is chosen to present an optimum set of donor atoms to facilitate stable and selective metal ion complexation, as well as offer a reactive handle to allow covalent functionalization of the vector molecule. Ideally, the metal ion complex should be thermodynamically, kinetically and metabolically stable to prevent unwanted escape of the metal ion in vivo. In addition, the conjugation chemistry is often chosen to minimize the rate of degradation or loss of the metal ion complex from the vector. Nevertheless, for most metal ion BFC systems, a certain degree of degradation or loss of the radiometal ion is commonly observed. For example, Cu2+ ions can be coordinated by various chelates including the macrocycles DOTA, NOTA, NODGA and CB-TE2A.[46] Dramatic differences in the biodistribution profiles have been observed for systems that employ these different chelates with high liver uptake often attributed to demetallation of the Cu2+ ion in vivo. Understanding the nature of the metal ion complexes, and potential degradation products is crucial for future design of new metal ion chelates.
Increasing interest in the use of 89Zr-radiolabeled antibodies for immuno-PET imaging provides a suitable case-study. Zirconium-89 is a positron-emitting radionuclide with a has a half-life of 78.4 hours and exists as the Zr4+ ion, and is readily coordinated by the hexadentate, tris-hydroxamate ligand, desferrioxamine B. Density functional theory (DFO) calculations have predicted that, due to the increased size of the first coordination sphere, Zr4+ ions coordinated by DFO have the potential to increase their coordination number from between 6 and 8 donor atoms.[47] No crystal structures of the predicted [Zr(DFO)(H2O)2]+ are available but MS data confirm the DFT predictions which suggest that the water molecules are loosely bound and kinetically labile (Figure 12).
While most human applications of 89Zr-radiolabeled antibodies have found that the 89Zr-DFO complex remains stable in vivo, concern still exists about the potential loss of 89Zr ions from the chelate and associated problems for radiation dosimetry. In mouse models 89Zr-labeled antibodies typically show accumulation of the radioactivity in bone that reaches ca. 5 – 10% ID/g of administered dose.[47, 48] Interestingly, bone accumulation of 89Zr is typically found to be higher in animal models that have tumour models which are positive for the target antigen which points toward specific intratumoral metabolism as the source of the bone seeking 89Zr-species. Metabolic degradation of the bifunctional linker and potential demetallation are two possible explanations for the bone tropism. However, at present no studies have confirmed the chemical nature of the 89Zr-species that is released from the 89Zr-DFO-antibody constructs. Studies have shown that 89Zr ions administered as either the tetraoxalate complex, [89Zr(C2O4)4]4− or as the ZrCl4 species dissolved in a phosphate buffer show high accumulation of radioactivity in the bone.[49] It is likely that detailed MS studies will be required to solve these outstanding questions about zirconium metabolism.
A further example is the development of a new purification method for a palladium(IV) fluoride complex. Hooker & Ritter et al. disclosed the radiosynthesis and utility of a novel Pd(IV)18F complex that was able to undergo fluorination reactions with palladium aryl complexes to yield 18F-aryl fluorides.[50] This discovery was important to the field of PET radiochemistry with [18F]fluoride, as now the ability to carry out “pseudo-electrophilic” fluorination reactions without the need for [18F]F2 gas and its derivatives (e.g. [18F]Selectfluor™) meant that readily available and high specific activity [18F]fluoride could be used for 18F-labelling of non-activated aromatic rings. The purification of [18F]Pd(IV)F requires the use of a polypyridine resin (JandaJel™-polypyridine)(Figure 15). However, this resin is no longer commercially available and a new method was needed to purify the complex.
Figure 15.
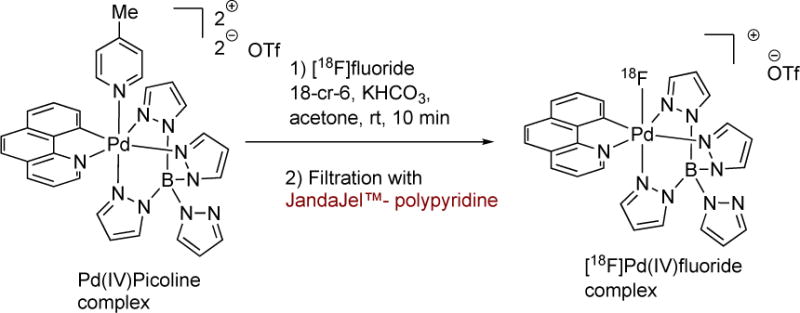
Radiosynthesis of [18F]Pd(IV)F using JandaJel™-polypyridine for purification of the Pd(IV)F complex from the Pd(IVpicoline precursor.
Since the fluorinated species was the desired product to be isolated from the reaction mixture, we postulated that the Pd(IV)F complex could be purified using HPLC, however the stability of this complex towards HPLC conditions was unknown. We used LC/MS to test the viability of HPLC purification (Figure 16). The complex was initially injected onto the LC/MS using acetonitrile and formic acid as the eluent. Data from the MS showed that under these conditions the Pd(IV)F complex was not stable as the loss of a pyrazole from the tetrpyrazolborate ligand was observed Figure 14. This result suggested that acids should be avoided in the purification step and that the ideal HPLC solvent system should be carried out at neutral or near neutral pH. When the HPLC purification was repeated using acetonitrile and potassium triflate (0.1M) the MS showed that the major product was indeed the Pd(IV)F complex.
Figure 16.
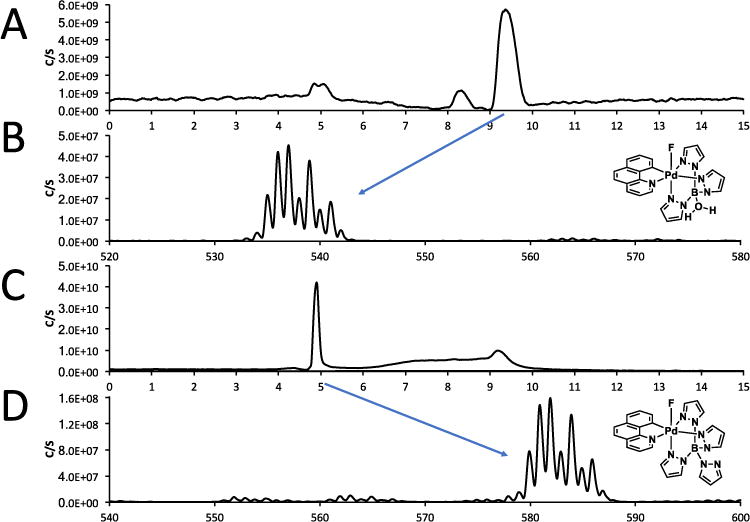
Upper two traces: initial purification methodology tested and resulted in the loss of one of the pyrazole groups. Lower 2 traces: Final purification methodology which resulted in the major product formed during the purification as the desired complex.
Figure 14.
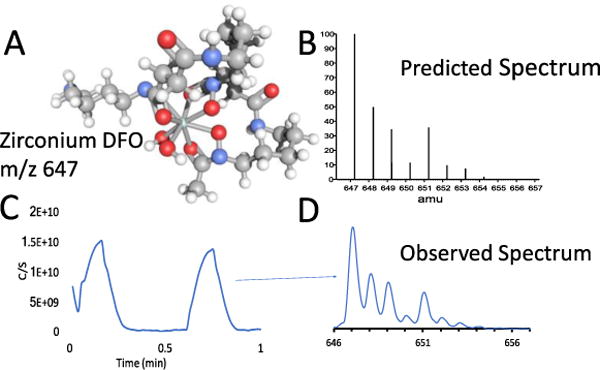
A: Structure of the zirconium desferrioxamine complex. Note: loosely associated solvent water molecules are not observed in the MS. The monoisotopic molecular weight of [Zr(DFO)]+, C25H45N6O8Zr, is 647.2; B: the predicted spectrum of [Zr(DFO)]+; C: total ion chromatogram from the flow injection analysis (FIA) of the [Zr(DFO)]+complex. D: the spectrum obtained by FIA matches the predicted intensities based on isotopic abundance.
Isolation of the complex from the HPLC and subsequent analysis by MS demonstrated that HPLC purification was a viable method to purify Pd(IV)F. Further investigation of the observed isotope pattern of the MS showed that it matched well with the predicted isotope pattern of the complex (Figure 17).
Figure 17.
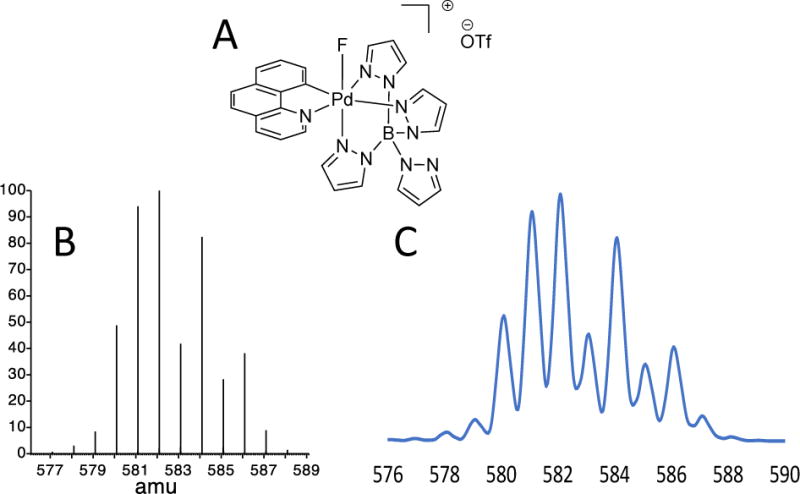
A: Pd(IV)F complex; B: the predicted isotope patterns and C: the pattern observed in the mass spectrometer.
7. Conclusion
Herein we have described a pre-concentration system integrated to an SQ-MS to detect dilute radiopharmaceutical formulations and metabolites. We also show examples of how SQ-MS was used for optimization of radiochemical reactions, identification of radiometal complexes and development of a new purification methodology for radiofluorination reactions. The examples of SQ-MS in our PET radiochemistry laboratories presented herein hopes to inspire the radiochemistry community as well as researchers involved in organic synthesis, organofluorine chemistry, organometallic chemistry, preclinical and clinical translation to make more use of this readily available instrumentation in both basic and applied science.
Figure 1.

A: In this position the trapping cartridge is cleaned for trapping by washing with ethanol and then water. The sample is then applied to the trapping cartridge to perform the concentration of the materials. If necessary, the sample may require dilution or adjustment of the pH to affect the retention of the material on the trapping cartridge. The trapping cartridge is then washed with water or other solution to remove interfering materials. At the same time, the analytical system is equilibrated to minimize the analysis time. B: In this position, the trapping cartridge is moved into the flow path with the analytical column to perform the analytical analysis. C: The trapping cartridge (Valco Instruments Co. Inc, Houston, TX, Finger-tight cartridge assembly #SFECH412) can be packed by the user with any standard solid phase extraction or resin packing.
Figure 9.
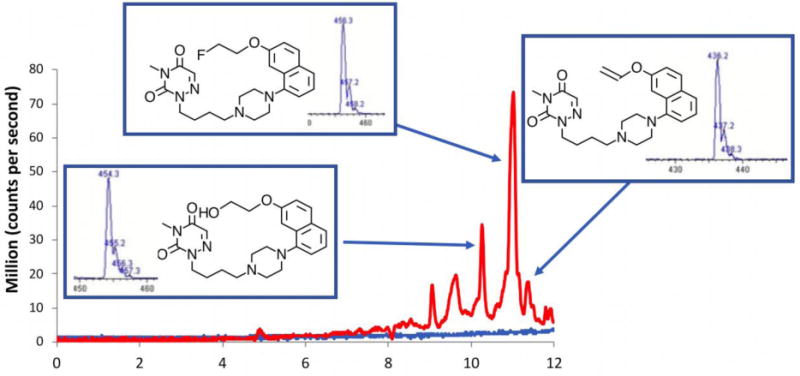
Analysis of the final formulated product by LC/MS, using direct injection of 5 μL (blue line) and using the trapping system to improve the sensitivity (Red line). Displayed is the UV spectrum observed at 254 nm for both methodologies. Column: 3 μm, 4.6 × 150 mm C18, Phenomenex, Luna. Solvent CH3CN : 0.1% formic acid, Flow rate= 1mL/min, Gradient from 20% CH3CN to 95% CH3CN at 10 minutes, hold for 2 minutes at 95% CH3CN. Insets are the structures identified using the MS data. Mass spectra obtained using an Expression-L Compact Mass Spectrometer (Advion Inc., USA), APCI ion source operating in positive ion mode and corona discharge of 5 μA, m/z scan range: 200-500.
Acknowledgments
We thank Ellen Osborn and Asia Knight for their contributions to our early mass spectrometry studies. JPH thanks the University of Zurich, the Swiss National Science Foundation (SNSF Professorship PP00P2_163683), and the European Research Council (ERC-StG-2015, NanoSCAN – 676904) for financial support. N.V. thanks Advion, the US Department of Energy for an R&D Isotope Program Project grant (DE-SC0015556), and the National Institute on Ageing of the NIH (R01AG054473) for funding. S.H.L. is a recipient of an NIH career development award (DA038000) and an Early Career Award in Chemistry of Drug Abuse and Addiction (ECHEM, DA043507) from the National Institute on Drug Abuse.
References
- 1.Hoffmann Ed, Stroobant V. Mass spectrometry: principles and applications. 3rd. J. Wiley; Chichester, West Sussex, England; Hoboken, NJ: 2007. [Google Scholar]
- 2.Watson JT. Introduction to mass spectrometry: biomedical, environmental, and forensic applications. Raven Press; New York: 1976. [Google Scholar]
- 3.Watson JT. Introduction to mass spectrometry. 3rd. Lippincott-Raven; Philadelphia: 1997. [Google Scholar]
- 4.Watson JT, Sparkman OD. Introduction to mass spectrometry: instrumentation, applications and strategies for data interpretation. 4th. John Wiley & Sons; Chichester, England; Hoboken, NJ: 2007. [Google Scholar]
- 5.McLafferty FW, Tureček Fe. Interpretation of mass spectra. 4th. University Science Books; Mill Valley, Calif: 1993. [Google Scholar]
- 6.Greaves J, Roboz J. Mass spectrometry for the novice, CRC Press, is an imprint of the Taylor & Francis Group. Boca Raton: 2014. [Google Scholar]
- 7.Vogel JS, Turteltaub KW, Finkel R, Nelson DE. Accelerator Mass Spectrometry. Analytical Chemistry. 1995;67(11):353A–359A. doi: 10.1021/ac00107a001. [DOI] [PubMed] [Google Scholar]
- 8.Taylor RE, Bar-Yosef O. Radiocarbon dating: an archaeological perspective. Second. Left Coast Press, Inc.; Walnut Creek, California: 2014. [Google Scholar]
- 9.Need AB, McKinzie JH, Mitch CH, Statnick MA, Phebus LA. In vivo rat brain opioid receptor binding of LY255582 assessed with a novel method using LC/MS/MS and the administration of three tracers simultaneously. Life Sci. 2007;81(17–18):1389–96. doi: 10.1016/j.lfs.2007.09.005. [DOI] [PubMed] [Google Scholar]
- 10.Joshi EM, Need A, Schaus J, Chen Z, Benesh D, Mitch C, Morton S, Raub TJ, Phebus L, Barth V. Efficiency Gains in Tracer Identification for Nuclear Imaging: Can In Vivo LC-MS/MS Evaluation of Small Molecules Screen for Successful PET Tracers? ACS Chemical Neuroscience. 2014;5(12):1154–1163. doi: 10.1021/cn500073j. [DOI] [PubMed] [Google Scholar]
- 11.Chernet E, Martin LJ, Li D, Need AB, Barth VN, Rash KS, Phebus LA. Use of LC/MS to assess brain tracer distribution in preclinical, in vivo receptor occupancy studies: dopamine D2, serotonin 2A and NK-1 receptors as examples. Life Sci. 2005;78(4):340–6. doi: 10.1016/j.lfs.2005.04.075. [DOI] [PubMed] [Google Scholar]
- 12.Barth V, Need A. Identifying Novel Radiotracers for PET Imaging of the Brain: Application of LC-MS/MS to Tracer Identification. ACS Chemical Neuroscience. 2014;5(12):1148–1153. doi: 10.1021/cn500072r. [DOI] [PubMed] [Google Scholar]
- 13.Bernard-Gauthier V, Collier TL, Liang SH, Vasdev N. Discovery of PET Radiopharmaceuticals at the Academia-Industry Interface. Drug Discovery Today: Technologies. 2017 doi: 10.1016/j.ddtec.2017.09.001. [DOI] [PubMed] [Google Scholar]
- 14.Lapi SE, Welch MJ. A historical perspective on the specific activity of radiopharmaceuticals: what have we learned in the 35 years of the ISRC? Nucl Med Biol. 2012;39(5):601–8. doi: 10.1016/j.nucmedbio.2011.11.005. [DOI] [PubMed] [Google Scholar]
- 15.Cyclotron Produced Radionuclides: Principles and Practice. INTERNATIONAL ATOMIC ENERGY AGENCY; Vienna: 2008. [Google Scholar]
- 16.Paneth F, Hevesy Gv. Mitteilungen aus dem Institut für Radiumforschung. Monatshefte für Chemie und verwandte Teile anderer Wissenschaften. 1913;34(9):1401–1407. [Google Scholar]
- 17.Durkan K, Jiang Z, Rold TL, Sieckman GL, Hoffman TJ, Bandari RP, Szczodroski AF, Liu L, Miao Y, Reynolds TS, Smith CJ. A heterodimeric [RGD-Glu-[(64)Cu-NO2A]-6-Ahx-RM2] alphavbeta3/GRPr-targeting antagonist radiotracer for PET imaging of prostate tumors. Nucl Med Biol. 2014;41(2):133–9. doi: 10.1016/j.nucmedbio.2013.11.006. [DOI] [PMC free article] [PubMed] [Google Scholar]
- 18.Bandari RP, Jiang Z, Reynolds TS, Bernskoetter NE, Szczodroski AF, Bassuner KJ, Kirkpatrick DL, Rold TL, Sieckman GL, Hoffman TJ, Connors JP, Smith CJ. Synthesis and biological evaluation of copper-64 radiolabeled [DUPA-6-Ahx-(NODAGA)-5-Ava-BBN(7-14)NH2], a novel bivalent targeting vector having affinity for two distinct biomarkers (GRPr/PSMA) of prostate cancer. Nucl Med Biol. 2014;41(4):355–63. doi: 10.1016/j.nucmedbio.2014.01.001. [DOI] [PMC free article] [PubMed] [Google Scholar]
- 19.Tieu W, Lifa T, Katsifis A, Codd R. Octadentate Zirconium(IV)-Loaded Macrocycles with Varied Stoichiometry Assembled From Hydroxamic Acid Monomers using Metal-Templated Synthesis. Inorganic Chemistry. 2017;56(6):3719–3728. doi: 10.1021/acs.inorgchem.7b00362. [DOI] [PubMed] [Google Scholar]
- 20.Ma Y, Kiesewetter DO, Lang L, Gu D, Chen X. Applications of LC-MS in PET radioligand development and metabolic elucidation. Curr Drug Metab. 2010;11(6):483–93. doi: 10.2174/138920010791636167. [DOI] [PMC free article] [PubMed] [Google Scholar]
- 21.Cassidy RM, Elchuk S, McHugh JO. Determination of metals in groundwaters by trace enrichment and liquid chromatography. Analytical Chemistry. 1982;54(4):727–731. [Google Scholar]
- 22.Topping JJ, MacCrehan WA. Preconcentration and determination of cadmium in water by reversed-phase column chromatography and atomic absorption. Talanta. 1974;21(12):1281–6. doi: 10.1016/0039-9140(74)80149-9. [DOI] [PubMed] [Google Scholar]
- 23.Farjam A, Vreuls JJ, Cuppen WJ, Brinkman UA, de Jong GJ. Direct introduction of large-volume urine samples into an on-line immunoaffinity sample pretreatment-capillary gas chromatography system. Anal Chem. 1991;63(21):2481–7. doi: 10.1021/ac00021a017. [DOI] [PubMed] [Google Scholar]
- 24.Bin Abas MR, Takruni IA, Abdullah Z, Tahir NM. On-line preconcentration and determination of trace metals using a flow injection system coupled to ion chromatography. Talanta. 2002;58(5):883–90. [PubMed] [Google Scholar]
- 25.Hissner F, Mattusch J, Werner G. Determination of metal ions by ion chromatography with precolumn electrochemical preconcentration. Anal Bioanal Chem. 1996;354(5–6):718–21. doi: 10.1007/s0021663540718. [DOI] [PubMed] [Google Scholar]
- 26.Zhou B, Xiao JF, Tuli L, Ressom HW. LC-MS-based metabolomics. Mol Biosyst. 2012;8(2):470–81. doi: 10.1039/c1mb05350g. [DOI] [PMC free article] [PubMed] [Google Scholar]
- 27.Shetty HU, Morse CL, Zhang Y, Pike VW. Characterization of fast-decaying PET radiotracers solely through LC-MS/MS of constituent radioactive and carrier isotopologues. EJNMMI Res. 2013;3(1):3. doi: 10.1186/2191-219X-3-3. [DOI] [PMC free article] [PubMed] [Google Scholar]
- 28.Hilton J, Yokoi F, Dannals RF, Ravert HT, Szabo Z, Wong DF. Column-switching HPLC for the analysis of plasma in PET imaging studies. Nucl Med Biol. 2000;27(6):627–30. doi: 10.1016/s0969-8051(00)00125-6. [DOI] [PubMed] [Google Scholar]
- 29.Werkhoven-Goewie CE, de Ruiter C, Brinkman UA, Frei RW, de Jong GJ, Little CJ, Stahel O. Automated determination of drugs in blood samples after enzymatic hydrolysis using precolumn switching and post-column reaction detection. J Chromatogr. 1983;255:79–90. doi: 10.1016/s0021-9673(01)88275-3. [DOI] [PubMed] [Google Scholar]
- 30.Yu Z, Westerlund D, Boos KS. Determination of methotrexate and its metabolite 7-hydroxymethotrexate by direct injection of human plasma into a column-switching liquid chromatographic system using post-column photochemical reaction with fluorimetric detection. J Chromatogr B Biomed Sci Appl. 1997;689(2):379–86. doi: 10.1016/s0378-4347(96)00357-x. [DOI] [PubMed] [Google Scholar]
- 31.Vasdev N, Collier TL. Design and Prototype of an Automated Column-Switching HPLC System for Radiometabolite Analysis. Pharmaceuticals (Basel) 2016;9(3) doi: 10.3390/ph9030051. [DOI] [PMC free article] [PubMed] [Google Scholar]
- 32.VASDEV N, Collier TL. Automated analysis systems. Google Patents. 2014 [Google Scholar]
- 33.Shalgunov V, van Wieringen JP, Janssen HM, Fransen PM, Dierckx RA, Michel MC, Booij J, Elsinga PH. Synthesis and evaluation in rats of the dopamine D2/3 receptor agonist 18F-AMC20 as a potential radioligand for PET. J Nucl Med. 2015;56(1):133–9. doi: 10.2967/jnumed.114.145466. [DOI] [PubMed] [Google Scholar]
- 34.Keller T, Krzyczmonik A, Forsback S, Picon FR, Kirjavainen AK, Takkinen J, Rajander J, Cacheux F, Damont A, Dolle F, Rinne JO, Haaparanta-Solin M, Solin O. Radiosynthesis and Preclinical Evaluation of [18F]F-DPA, A Novel Pyrazolo[1,5a]pyrimidine Acetamide TSPO Radioligand, in Healthy Sprague Dawley Rats. Mol Imaging Biol. 2017 doi: 10.1007/s11307-016-1040-z. [DOI] [PMC free article] [PubMed] [Google Scholar]
- 35.Liang SH, Chen JM, Normandin MD, Chang JS, Chang GC, Taylor CK, Trapa P, Plummer MS, Para KS, Conn EL, Lopresti-Morrow L, Lanyon LF, Cook JM, Richter KE, Nolan CE, Schachter JB, Janat F, Che Y, Shanmugasundaram V, Lefker BA, Enerson BE, Livni E, Wang L, Guehl NJ, Patnaik D, Wagner FF, Perlis R, Holson EB, Haggarty SJ, El Fakhri G, Kurumbail RG, Vasdev N. Discovery of a Highly Selective Glycogen Synthase Kinase-3 Inhibitor (PF-04802367) That Modulates Tau Phosphorylation in the Brain: Translation for PET Neuroimaging. Angew Chem Int Ed Engl. 2016;55(33):9601–5. doi: 10.1002/anie.201603797. [DOI] [PMC free article] [PubMed] [Google Scholar]
- 36.Rendic S, Guengerich FP. Survey of Human Oxidoreductases and Cytochrome P450 Enzymes Involved in the Metabolism of Xenobiotic and Natural Chemicals. Chemical Research in Toxicology. 2015;28(1):38–42. doi: 10.1021/tx500444e. [DOI] [PMC free article] [PubMed] [Google Scholar]
- 37.Collier TL, Liang SH, Mann JJ, Vasdev N, Kumar JSD. Microfluidic radiosynthesis of [18F]FEMPT, a high affinity PET radiotracer for imaging serotonin receptors. Beilstein J Org Chem. 2017;13:2922–2927. doi: 10.3762/bjoc.13.285. [DOI] [PMC free article] [PubMed] [Google Scholar]
- 38.Wilson AA, Garcia A, Houle S, Vasdev N. Direct fixation of [(11)C]-CO(2) by amines: formation of [(11)C-carbonyl]-methylcarbamates. Org Biomol Chem. 2010;8(2):428–32. doi: 10.1039/b916419g. [DOI] [PubMed] [Google Scholar]
- 39.Wilson AA, Garcia A, Houle S, Sadovski O, Vasdev N. Synthesis and application of isocyanates radiolabeled with carbon-11. Chemistry. 2011;17(1):259–64. doi: 10.1002/chem.201002345. [DOI] [PubMed] [Google Scholar]
- 40.Rotstein BH, Liang SH, Holland JP, Collier TL, Hooker JM, Wilson AA, Vasdev N. 11CO2 fixation: a renaissance in PET radiochemistry. Chem Commun (Camb) 2013;49(50):5621–9. doi: 10.1039/c3cc42236d. [DOI] [PMC free article] [PubMed] [Google Scholar]
- 41.Rotstein BH, Hooker JM, Woo J, Collier TL, Brady TJ, Liang SH, Vasdev N. Synthesis of [(11)C]Bexarotene by Cu-Mediated [(11)C]Carbon Dioxide Fixation and Preliminary PET Imaging. ACS Med Chem Lett. 2014;5(6):668–72. doi: 10.1021/ml500065q. [DOI] [PMC free article] [PubMed] [Google Scholar]
- 42.Hooker JM, Reibel AT, Hill SM, Schueller MJ, Fowler JS. One-pot, direct incorporation of [11C]CO2 into carbamates. Angew Chem Int Ed Engl. 2009;48(19):3482–5. doi: 10.1002/anie.200900112. [DOI] [PMC free article] [PubMed] [Google Scholar]
- 43.Dahl K, Collier TL, Cheng R, Zhang X, Sadovski O, Liang SH, Vasdev N. In-loop" [11 C]CO2 fixation: Prototype and proof of concept. J Labelled Comp Radiopharm. 2017 doi: 10.1002/jlcr.3528. [DOI] [PMC free article] [PubMed] [Google Scholar]
- 44.Zeglis BM, Houghton JL, Evans MJ, Viola-Villegas N, Lewis JS. Underscoring the Influence of Inorganic Chemistry on Nuclear Imaging with Radiometals. Inorganic Chemistry. 2014;53(4):1880–1899. doi: 10.1021/ic401607z. [DOI] [PMC free article] [PubMed] [Google Scholar]
- 45.Zeglis BM, Lewis JS. A practical guide to the construction of radiometallated bioconjugates for positron emission tomography. Dalton Transactions. 2011;40(23):6168–6195. doi: 10.1039/c0dt01595d. [DOI] [PMC free article] [PubMed] [Google Scholar]
- 46.Wadas TJ, Wong EH, Weisman GR, Anderson CJ. Copper Chelation Chemistry and its Role in Copper Radiopharmaceuticals. Current Pharmaceutical Design. 2007;13(1):3–16. doi: 10.2174/138161207779313768. [DOI] [PubMed] [Google Scholar]
- 47.Holland JP, Divilov V, Bander NH, Smith-Jones PM, Larson SM, Lewis JS. 89Zr-DFO-J591 for immunoPET of prostate-specific membrane antigen expression in vivo. J Nucl Med. 2010;51(8):1293–300. doi: 10.2967/jnumed.110.076174. [DOI] [PMC free article] [PubMed] [Google Scholar]
- 48.Holland JP, Caldas-Lopes E, Divilov V, Longo VA, Taldone T, Zatorska D, Chiosis G, Lewis JS. Measuring the pharmacodynamic effects of a novel Hsp90 inhibitor on HER2/neu expression in mice using Zr-DFO-trastuzumab. PloS one. 2010;5(1):e8859. doi: 10.1371/journal.pone.0008859. [DOI] [PMC free article] [PubMed] [Google Scholar]
- 49.Holland JP, Sheh Y, Lewis JS. Standardized methods for the production of high specific-activity zirconium-89. Nuclear Medicine and Biology. 2009;36(7):729–739. doi: 10.1016/j.nucmedbio.2009.05.007. [DOI] [PMC free article] [PubMed] [Google Scholar]
- 50.Lee E, Kamlet AS, Powers DC, Neumann CN, Boursalian GB, Furuya T, Choi DC, Hooker JM, Ritter T. A fluoride-derived electrophilic late-stage fluorination reagent for PET imaging. Science. 2011;334(6056):639–42. doi: 10.1126/science.1212625. [DOI] [PMC free article] [PubMed] [Google Scholar]


