

Abstract
Radiomics studies have demonstrated the potential use of quantitative image features to improve prognostic stratification of patients with head and neck cancer. Imaging protocol parameters that can affect radiomics feature values have been investigated, but the effects of artifacts caused by intrinsic patient factors have not. Two such artifacts that are common in patients with head and neck cancer are streak artifacts caused by dental fillings and beam-hardening artifacts caused by bone. The purpose of this study was to test the impact of these artifacts and if needed, methods for compensating for these artifacts in head and neck radiomics studies. The robustness of feature values was tested by removing slices of the gross tumor volume (GTV) on computed tomography images from 30 patients with head and neck cancer; these images did not have streak artifacts or had artifacts far from the GTV. The range of each feature value over a percentage of the GTV was compared to the inter-patient variability at full volume. To determine the effects of beam-hardening artifacts, we scanned a phantom with 5 cartridges of different materials encased in polystyrene buildup. A cylindrical hole through the cartridges contained either a rod of polylactic acid to simulate water or a rod of polyvinyl chloride to simulate bone. A region of interest was drawn in each cartridge flush with the rod. Most features were robust with up to 50% of the original GTV removed. Most feature values did not significantly differ when measured with the polylactic acid rod or the polyvinyl chloride rod. Of those that did, the size of the difference did not exceed the inter-patient standard deviation in most cases. We conclude that simply removing slices affected by streak artifacts can enable these scans to be included in radiomics studies and that contours of structures can abut bone without being affected by beam hardening if needed.
Keywords: radiomics, quantitative imaging, texture, artifacts, head and neck
1. Introduction
Radiomics, the analysis of medical images on a voxel level to extract quantitative image features, has become a popular research technique in oncology. Radiomics is based on the assumption that the gene microenvironment is expressed on a macroscopic level and that this information can be extracted by analyzing voxel-level data in various ways (Lambin et al., 2012). Therefore, by extracting texture metrics from the image, information inaccessible to the human eye alone can be obtained. This additional information has been shown, for instance, to improve the ability of survival models to distinguish patients by prognosis when added to conventional prognostic factors such as age (Bogowicz et al., 2017a, 2017b; Fave et al., 2017; Fried et al., 2016; Ou et al., 2017; Vallieres et al., 2017). Most early radiomics studies focused on lung cancer, but patients with head and neck cancer have recently become a prominent focus of radiomics studies (Bagher-Ebadian et al., 2017; Bogowicz et al., 2017a; Bogowicz et al., 2017b; Ou et al., 2017; Parmar et al., 2015b; Parmar et al., 2015a; Vallieres et al., 2017).
While radiomics studies have identified several imaging features that are associated with prognosis, these findings can be affected by a variety of factors. The impact of many characteristics of imaging protocols, such as voxel size, tube current, tube voltage, and kernel, has been studied thoroughly (Fave et al., 2015; Mackin et al., 2017; Mackin et al., 2018; Shafiq-ul-Hassan et al., 2017; Zhao et al., 2014; Zhao et al., 2016). However, the effects of factors intrinsic to the patient have not been investigated. For example, computed tomography (CT) scans of the head and neck cover the oral cavity, where many patients have metal dental fillings that cause streak artifacts. As radiomics is based on the assumption that gene expression at a microscopic level is discernible on a macroscopic level in the voxels, it is likely that measuring the radiomics features of the structures affected by a streak artifact would not provide any valuable information about that structure. Another type of artifact observed in CT scans, beam hardening, can affect images containing bone. Because there are many bones in the area of interest in head and neck examinations, this area may be particularly prone to the effects of these small artifacts. As a result, patients whose structure of interest is affected by streak or beam-hardening artifacts are often excluded from the large data sets required to achieve sufficient statistical power for radiomics studies. Therefore, finding a way to include as many patients as possible is needed.
We aimed to test the impact of these artifacts and if needed, methods for compensating for these artifacts in head and neck radiomics studies. First, we determined whether streak artifacts do in fact alter radiomics feature values, and, if so, whether the simple technique of removing the slices affected by the streak artifact produced feature values similar to those in regions unaffected by the artifact. Second, we aimed to determine whether a buffer region is needed between bone and other structures to ensure that the measured feature values are not affected by beam-hardening artifacts.
2. Methods
2.1. Streak Artifact
2.1.1. Impact of Streak Artifacts on Feature Values
The impact of streak artifacts on feature values was investigated using a cohort of 458 patients with head and neck squamous cell carcinoma (HNSCC). All procedures were performed in accordance with the Declaration of Helsinki on Ethical Issues with a waiver of informed consent from the Institutional Review Board. Only the patients whose CT images exhibited a visible streak artifact on slices showing the gross tumor volume (GTV) were selected, resulting in the selection of 108 patients. The 108 patient cohort had a mean age of 58 years (range: 30–80 years), mean height of 173 cm (range: 149–191 cm), and mean weight of 77.9 kg (range: 46.0–136.0 kg). In order to evaluate the impact of streak artifacts on the radiomics features (gray-level co-occurrence matrix features, gray-level run length matrix features, neighborhood gray tone difference matrix features, and intensity histogram features), a new region of interest (ROI) was created from which the GTV slices with the streak artifact were removed. Radiomics features were extracted for the 2 ROIs: the original GTV and the modified GTV. A pairwise t-test was used to determine if there was a significant (p < 0.05) difference in the measured features. This difference in measured features would indicate the streak artifacts having an impact. Streak artifacts were identified manually using a window width of 400 and a window level of −200. An example of a streak artifact is shown in Figure 1.
Figure 1. Streak Artifact.

Example of identified streak artifact using a window width of 400 and window level of −200.
2.1.2. Impact of Removing Slices
A potential approach to removing the effect of streak artifacts on radiomics features is to exclude the affected slices from the feature calculations. In order to study the impact of excluding slices on feature values, we selected CT images for 30 HNSCC patients from the 458 patient cohort with no streak artifacts or with GTVs located far from the artifact and whose imaging parameters were the same. The 30 patients’ mean age was 64 years (range: 50–87 years), mean height, 175 cm (range: 149–193 cm), and mean weight, 80.5 kg (range: 43.9–114.9 kg). Slices of the GTV were removed in 2 ways: (1) sequentially, from superior to inferior and (2) in the order given by a random number generator. A new ROI was created for each slice removed from the GTV until only 1 slice remained in the GTV (e.g., if the total GTV was 10 slices, the first ROI would consist of the full 10 slices, the next ROI would contain 9 slices, the next ROI would contain 8 slices, etc.)
To determine the volume that could be removed before feature values changed, we developed a range variation metric based on the range of values across the volumes. First, for each feature and patient, the scaled range, SR, was calculated as
where i is the patient number (1 to 30), IFi is the feature value for patient i, and FIFi is the feature value at full volume for patient i. Next, the scaled range for each patient, SRi, was used as an input in the range variation metric to determine whether the given feature was robust to the removal of slices from the GTV:
where the numerator is the mean of the scaled ranges and the denominator is the standard deviation of the feature values at full volume across all patients divided by the mean of the feature values at full volume for all patients. The range variation metric thus represents the average effect of removing parts of the tumor divided by the variability in the patient population.
To evaluate the robustness of features to the removal of slices with streak artifacts, we divided the data set into 4 volume range groups. In each group, all contours within a specified volume range were evaluated: 75%−100%, 50%−100%, 25%−100%, and 0%−100%. For example, in the 75%−100% group, all ROIs for a given patient that had at least 75% of the original GTV remaining after removing slices were evaluated. A cutoff of 0.5 was used to determine if features were robust. Features with a range variation above 0.5 were deemed not robust. A pairwise t-test was conducted to compare the feature values at 100% GTV and 50% GTV.
2.1.3. Feature Extraction
Images were analyzed using IBEX, an open-source radiomics tool (Ger et al., 2018; Zhang et al., 2015). The GTV was contoured on patient images by a radiation oncologist (HE). Twenty-two gray-level co-occurrence matrix features (Haralick and Shanmugam, 1973), 11 gray-level run length matrix features (Galloway, 1975; Tang, 1998), 5 neighborhood gray tone difference matrix features (Amadasun and King, 1989), and 11 intensity histogram features were calculated in IBEX. Each feature was calculated with 4 different preprocessing techniques because different preprocessing techniques have been shown to have different predictive power in non-small cell lung cancer patient survival for individual features (Fave et al., 2016); therefore, we tested the following combinations of preprocessing techniques: (1) thresholding, (2) thresholding and Butterworth smoothing (order 2, cutoff 125), (3) thresholding and 8- bit depth resampling, and (4) thresholding, Butterworth smoothing, and 8-bit depth resampling. The lower bound of the threshold was −100 Hounsfield units, and no upper limit was used. The preprocessing and feature group settings were the same as those described in Fave et al.’s supplemental material (Fave et al., 2017). These features and preprocessing were chosen as they have been used in prognostic studies and for each feature, at least one of the preprocessing techniques has been shown to be correlated with overall survival, local recurrence, or distant metastases (Fave et al., 2017). Illustrations of the effects of each of these preprocessing techniques is demonstrated in Fave et al. (2016).
2.2. Bone Artifact
2.2.1. Phantom Design and Analysis
A modified version of the radiomics phantom described by Mackin et al. (2015) was created to analyze the impact of bone artifacts on feature values (Figure 2). The phantom contained a cylindrical insert made up of 5 different materials: cork, dense cork, hemp seeds, rubber, and solid water. The hemp seeds were held in a 3D-printed cartridge made of polylactic acid (PLA). There was a central hole with a diameter of 2.2 cm through the insert materials. A rod of solid polyvinyl chloride (PVC) was placed in the hole to simulate bone (Grant et al., 2014). A rod of 3D-printed PLA was placed in the hole to simulate water (Craft and Howell, 2017; Craft et al., 2018). The feature values obtained with the PLA rod in place were considered the true values, as this rod induced no artifact. These values were used as the reference for comparison of the feature values extracted with the PVC rod, which simulated bone, in place. The phantom was encased in a 28 × 21 × 22-cm3 buildup of high-density polystyrene; the size was based on the mean physical dimensions of a European female chest (ICRU, 1992).
Figure 2. CT Images of Phantom.
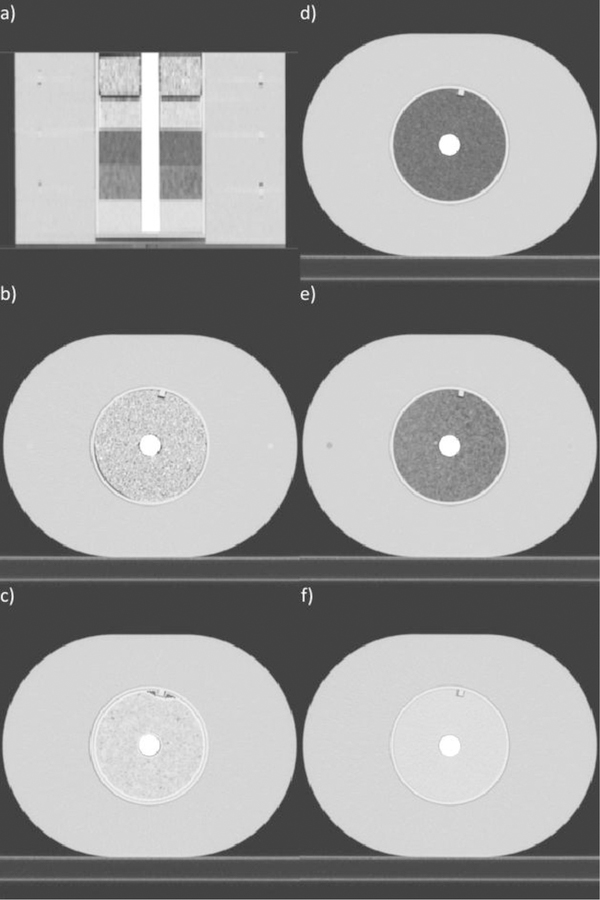
(a) Coronal slice of the full phantom with the polyvinyl chloride rod in the center of the cartridge materials and high-density polystyrene surrounding the cartridges. The full phantom had dimensions of 28 × 21 × 22 cm3, the mean dimensions of a European female chest. Axial slices showing inserts of (b) rubber, (c) hemp seeds, (d) cork, (e) dense cork, and (f) solid water. Window width: 1600, window level: −300.
The phantom was scanned on a Philips Brilliance Big Bore CT scanner (Philips Healthcare, Eindhoven, The Netherlands). Scans were acquired with the following parameters: 120 kVp, 200 mAs, 0.938 pitch, 1.0 s rotation time, 3-mm image thickness, 0.976 mm × 0.976-mm pixel size, and kernel C. The phantom was scanned 5 times each with the PVC and PLA inserts.
Wilcoxon rank sum tests were used to determine whether the feature values measured with the PLA insert were different from the feature values measured with the PVC insert (i.e., if contours next to bone were affected). For features that were significantly (p < 0.05) different, we computed the average absolute difference between the measurement with the PLA insert and the measurement with the PVC insert and compared it to the standard deviation for the feature measured in a cohort of HNSCC patients. The HNSCC patients were the same 30 patients as in the slice-removal study described in section 2.1.2.
2.2.2. Feature Extraction
The phantom was semiautomatically contoured using the location of a radiopaque marker on the superior edge of the phantom. The marker location was input into an in-house MATLAB (MathWorks, Natick, MA) script to create a cylindrical ROI for each material with an outer diameter of 8.2 cm, an inner diameter of 2.2 cm, and height of 2 cm. Additional ROIs for each material were created with inner diameters increasing in 2-mm steps up to 3.4 cm. The same features and preprocessing techniques were used as for the streak artifact study described in section 2.1.2; however, for the phantom images, no threshold bounds were applied.
3. Result
3.1. Streak Artifacts
3.1.1. Impact of Streak Artifacts on Feature Values
On average, 3.0 cm3 of GTV had to be removed to eliminate streak artifacts (standard deviation: 4.0 cm3, range: 0.11–28 cm3). Table 1 shows the percentage of features for which the measured value in the original GTV (with artifact) and the modified GTV (without artifact) differed significantly. Only for gray-level run length matrix features preprocessed using thresholding and intensity features preprocessed using thresholding, smoothing, and 8-bit depth resampling were fewer than 70% of the features affected by the streak artifact. For all other feature categories and combinations of preprocessing techniques, at least 73% of feature values were affected by the streak artifact.
Table 1.
Percentage of features with significantly different values with streak artifacts and with artifact slices removed.
| Preprocessing technique | ||||
|---|---|---|---|---|
| Feature category | Thresholding | Thresholding and 8-bit depth resampling |
Thresholding and Butterworth smoothing |
Thresholding, smoothing, and 8- bit depth resampling |
| GLCM (N = 22) | 95% | 91% | 95% | 91% |
| GLRLM (N = 11) | 17% | 91% | 73% | 91% |
| NGTDM (N = 5) | 80% | 100% | 80% | 100% |
| Intensity (N = 11) | 82% | 82% | 73% | 64% |
GLCM: gray-level co-occurrence matrix, GLRLM: gray-level run length matrix, NGTDM: neighborhood gray tone difference matrix
3.1.2. Impact of Removing Slices
The number of features that were not robust across the volume range for each slice removal and preprocessing technique is shown in Table 2. Almost all features were robust with removal of up to 50% of the original GTV. When modified GTVs were allowed to go down to only 1 slice, almost no features were robust. The features that were not robust are listed in the Supplemental Material. The range variation for each feature and preprocessing for the four volume groupings is contained in spreadsheets in the Supplemental Material.
Table 2.
Number of features that were not robust across the volume range for each slice removal and preprocessing technique.
| ROI Volume Range |
Sequential Slice Removal | Random Slice Removal | ||||||
|---|---|---|---|---|---|---|---|---|
| Thresholding | Thresholding and 8-bit depth resampling |
Thresholding and Butterworth smoothing |
Thresholding, smoothing, and 8-bit depth resampling |
Thresholding | Thresholding and 8-bit depth resampling |
Thresholding and Butterworth smoothing |
Thresholding, smoothing, and 8-bit depth resampling |
|
| 75% - 100% | 0 | 1 | 0 | 0 | 0 | 0 | 0 | 0 |
| 50% - 100% | 4 | 3 | 4 | 3 | 2 | 2 | 2 | 1 |
| 25% - 100% | 20 | 16 | 22 | 20 | 9 | 5 | 9 | 5 |
| 0% - 100% | 48 | 48 | 48 | 48 | 47 | 44 | 47 | 46 |
ROI, region of interest
The pairwise t-test between features at 100% GTV and 50% GTV showed that 76% of features under the sequential slice removal technique and 80% of features under the random slice removal technique were not significantly (p < 0.05) different.
3.2. Bone Artifact
Table 3 shows the number of features that significantly differed in the phantom with a PLA or PVC rod. Adding Butterworth smoothing and 8-bit depth resampling had no consistent effect on the differences. For example, adding smoothing reduced the number of significantly different gray-level co- occurrence matrix features in cork but increased the number in rubber. For the features with significant differences, the average difference divided by the standard deviation across the 30 HNSCC patients was 0.57 (range: 0.0044–3.6) for cork, 0.28 (range: 0.0011–1.7) for dense cork, 2.0 (range: 0.0083–36) for hemp seeds, 0.14 (range: 0.0014–0.93) for rubber, and 3.0 (range: 0.0031–36) for solid water. The results were similar for the various ROIs with different inner diameters.
Table 3.
Number of features with significantly different values when measured in a phantom with a PLA or PVC rod.
| Feature | Preprocessing technique | Cork | Dense Cork |
Hemp Seeds |
Rubber | Solid Water |
|---|---|---|---|---|---|---|
| GLCM (N=22) |
Thresholding | 12 | 5 | 7 | 1 | 13 |
| Thresholding, smoothing | 4 | 4 | 18 | 11 | 15 | |
| Thresholding, 8-bit depth resampling | 11 | 7 | 6 | 1 | 12 | |
| Thresholding, smoothing, 8-bit depth resampling | 4 | 3 | 18 | 10 | 13 | |
| GLRLM (N=11) |
Thresholding | 7 | 6 | 6 | 3 | 6 |
| Thresholding, smoothing | 7 | 6 | 7 | 7 | 10 | |
| Thresholding, 8-bit depth resampling | 5 | 5 | 4 | 3 | 10 | |
| Thresholding, smoothing, 8-bit depth resampling | 5 | 5 | 8 | 5 | 6 | |
| NGTDM (N=5) |
Thresholding | 0 | 0 | 0 | 0 | 3 |
| Thresholding, smoothing | 0 | 4 | 1 | 0 | 1 | |
| Thresholding, 8-bit depth resampling | 0 | 2 | 0 | 0 | 1 | |
| Thresholding, smoothing, 8-bit depth resampling | 0 | 1 | 1 | 0 | 3 | |
| Intensity (N=11) |
Thresholding | 8 | 3 | 7 | 3 | 8 |
| Thresholding, smoothing | 5 | 5 | 11 | 8 | 9 | |
| Thresholding, 8-bit depth resampling | 7 | 4 | 5 | 3 | 7 | |
| Thresholding, smoothing, 8-bit depth resampling | 6 | 5 | 9 | 8 | 9 | |
GLCM: gray-level co-occurrence matrix, GLRLM: gray-level run length matrix, NGTDM: neighborhood gray tone difference matrix.
4. Discussion
In this study, we showed that streak artifacts affect radiomics feature values, suggesting that regions containing such artifacts should not be included in radiomics data sets. We demonstrated that a simple technique, removing the slices with the artifact, can be used to remove up to 50% of the original GTV from the ROI while retaining similar feature values. Additionally, while the presence of bone within the image can affect some feature values, the effect is typically smaller than the spread in values in the patient population and can, therefore, be ignored.
The choice of 0.5 as the cutoff of the range variation metric to determine feature robustness was arbitrary. However, we found that using different cutoffs did not change the conclusions: feature values were generally robust when up to 50% of the GTV was removed, but having only a small fraction (less than 50%) of the GTV remaining in the ROI caused very large differences in feature values. Additionally, a 50% cutoff for robustness means that only a few patients would be lost from the data set; only 15 (3%) of 458 HNSCC patients had artifact on more than 50% of the GTV.
The majority of feature values were not significantly affected by the PVC rod simulating bone in the phantom. When features were affected, the effect was typically smaller than the standard deviation in values from the patient population. Interestingly, we found that the mean HU value was always significantly higher when the PVC rod was in the phantom than when the PLA rod was in the phantom, whereas the median HU was only higher for the PVC rod than the PLA rod when 8-bit depth resampling was not used. The presence of PVC caused this difference no matter the distance measured from the interface of the cartridge material and PVC. However, the average difference was typically one-tenth of the standard deviation of the value from the patient cohort for these features. Therefore, the presence of bone may cause changes in feature values, but the proximity of contours does not.
A method similar to that used for determining the impact of bone artifacts could have also been used for the streak artifacts. For example, a phantom could have been scanned with and without a metal bb inside of it. Since a phantom only simulates patient tissues and is not a true match and we had a large sample of patients with streak artifacts within their GTV, we chose to analyze the patient set instead of a phantom. This gave us the most realistic scenario for implementation on patient data sets. We did not have a large sample for the bone artifacts and thus chose to study the impact within a phantom.
There were several limitations to this study. First, only one technique was investigated for dealing with streak artifacts. Metal artifact reduction techniques may also be able to solve the problem of streak artifacts and may be able to do so without having to exclude any patients. Second, the bone artifact study was conducted in a phantom. While the rubber and cork cartridges have been shown to produce feature values similar to those produced by non-small cell lung cancer tumors (Mackin et al., 2015), the size and shape of the phantom simulated the dimensions of a human chest, not a head. A potential avenue for future investigation could be to create an anthropomorphic head and neck phantom using real human bone. This would allow us to investigate whether features are more susceptible to beam-hardening artifacts right inside the skull than near a cylinder of bone-like material. Additionally, many of these features have been found to have some correlation with volume (Fave et al., 2016). This may contribute to features becoming less robust as more volume was removed. Finally, both of these studies were conducted on CT scans from a single vendor so the results may not be universally applicable.
5. Conclusion
We demonstrated that streak artifacts affect the measured radiomics feature values. In order to deal with this effect, we suggest simply removing the slices with the artifact. Using this method, feature values are robust when up to 50% of the original GTV is removed. Excluding patients in whom more than 50% of the GTV is affected by the artifact only causes about 3% of patients to be excluded. Additionally, we demonstrated that contours can abut bone if needed, as most features are not affected by the presence of nearby bone.
Highlights.
Head and neck patients are often excluded from radiomics studies when streak artifacts from dental fillings impact the visible tumor volume
There are many bones in the head and neck region and may be more susceptible to beam hardening artifacts impacting how close contours should be drawn to bone
Streak artifacts impact the majority of radiomics features’ values
Most features were robust with up to 50% of the original tumor volume removed and were not significantly impacted by the presence of bone or the proximity of contours to bone
Contours of structures can abut bone without being affected by beam hardening if needed
More patients’ head and neck CTs can be used in radiomics studies by simply removing slices affected by streak artifacts
Acknowledgements
This work was supported by the National Institutes of Health [grant #: R21CA216572]. Rachel Ger is supported by the Rosalie B. Hite Graduate Fellowship in Cancer Research and the American Legion Auxiliary Fellowship in Cancer Research awarded by the MD Anderson Cancer Center UTHealth Science Center at Houston Graduate School of Biomedical Sciences. The authors would like to acknowledge the editing assistance of the Department of Scientific Publications at MD Anderson Cancer Center.
Footnotes
Declarations of interest: None.
Publisher's Disclaimer: This is a PDF file of an unedited manuscript that has been accepted for publication. As a service to our customers we are providing this early version of the manuscript. The manuscript will undergo copyediting, typesetting, and review of the resulting proof before it is published in its final citable form. Please note that during the production process errors may be discovered which could affect the content, and all legal disclaimers that apply to the journal pertain.
References
- Amadasun M, King R, 1989. Textural features corresponding to textural properties. IEEE Trans. Syst. Man Cybern 19, 1264–1274. [Google Scholar]
- Bagher-Ebadian H, et al. , 2017. On the impact of smoothing and noise on robustness of CT and CBCT radiomics features for patients with head and neck cancers. Med. Phys 44, 1755–70. [DOI] [PubMed] [Google Scholar]
- Bogowicz M, et al. , 2017a. Comparison of PET and CT radiomics for prediction of local tumor control in head and neck squamous cell carcinoma. Acta Oncol 56, 1531–1536. [DOI] [PubMed] [Google Scholar]
- Bogowicz M, et al. , 2017b. Computed tomography radiomics predicts HPV status and local tumor control after definitive radiochemotherapy in head and neck squamous cell carcinoma. Int. J. Radiat. Oncol. Biol. Phys 99, 921–928. [DOI] [PubMed] [Google Scholar]
- Craft DF, Howell RM, 2017. Preparation and fabrication of a full-scale, sagittal-sliced, 3D-printed, patient-specific radiotherapy phantom. J. Appl. Clin. Med. Phys 18, 285–292. [DOI] [PMC free article] [PubMed] [Google Scholar]
- Craft DF, et al. , 2018. Material matters: analysis of density uncertainty in 3D printing and its consequences for radiation oncology. Med. Phys . 45, 1614–1621. [DOI] [PubMed] [Google Scholar]
- Fave X, et al. , 2015. Preliminary investigation into sources of uncertainty in quantitative imaging features. Comput. Med. Imaging Graph 44, 54–61. [DOI] [PubMed] [Google Scholar]
- Fave X, et al. , 2016. Impact of image preprocessing on the volume dependence and prognostic potential of radiomics features in non-small cell lung cancer. Transl. Cancer Res 5, 349–363. [Google Scholar]
- Fave X, et al. , 2017. Delta-radiomics features for the prediction of patient outcomes in non-small cell lung cancer. Sci. Rep 7, 588. [DOI] [PMC free article] [PubMed] [Google Scholar]
- Fried DV, et al. , 2016. Stage III non-small cell lung cancer: prognostic value of FDG PET quantitative imaging features combined with clinical prognostic factors. Radiology 278, 214–222. [DOI] [PMC free article] [PubMed] [Google Scholar]
- Galloway MM, 1975. Texture analysis using gray level run lengths. Comp. Graph. Image Process 4, 172–179. [Google Scholar]
- Ger RB, et al. , 2018. Guidelines and experience using Imaging Biomarker Explorer (IBEX) for radiomics. J. Vis. Exp 131. [DOI] [PMC free article] [PubMed] [Google Scholar]
- Grant RL, et al. , 2014. Relative stopping power measurements to aid in the design of anthropomorphic phantoms for proton radiotherapy. J. Appl. Clin. Med. Phys 15, 121–126. [DOI] [PMC free article] [PubMed] [Google Scholar]
- Haralick RM, Shanmugam K, 1973. Textural features for image classification. IEEE Trans. Syst. Man Cybern 6, 610–621. [Google Scholar]
- Lambin P, et al. , 2012. Radiomics: extracting more information from medical images using advanced feature analysis. Eur. J. Cancer 48, 441–446 [DOI] [PMC free article] [PubMed] [Google Scholar]
- Mackin D, et al. , 2017. Harmonizing the pixel size in retrospective computed tomography radiomics studies. PLoS One 12, e0178524. [DOI] [PMC free article] [PubMed] [Google Scholar]
- Mackin D, et al. , 2018. Effect of tube current on computed tomography radiomic features. Sci. Rep 8, 2354. [DOI] [PMC free article] [PubMed] [Google Scholar]
- Mackin D, et al. , 2015. Measuring computed tomography scanner variability of radiomics features. Invest. Radiol 50, 757–765. [DOI] [PMC free article] [PubMed] [Google Scholar]
- International Commission on Radiation Units and Measurements (ICRU), 1992. Phantoms and Computational Models in Therapy, Diagnosis and Protection (Report 48) ICRU, Bethesda, Maryland. [Google Scholar]
- Ou D, et al. , 2017. Predictive and prognostic value of CT based radiomics signature in locally advanced head and neck cancers patients treated with concurrent chemoradiotherapy or bioradiotherapy and its added value to human papillomavirus status. Oral Oncol 71, 150–155. [DOI] [PubMed] [Google Scholar]
- Parmar C, et al. , 2015a. Radiomic machine-learning classifiers for prognostic biomarkers of head and neck cancer. Front. Oncol 5, 272. [DOI] [PMC free article] [PubMed] [Google Scholar]
- Parmar C et al. , 2015b. Radiomic feature clusters and prognostic signatures specific for lung and head & neck cancer. Sci. Rep 5, 11044. [DOI] [PMC free article] [PubMed] [Google Scholar]
- Shafiq-ul-Hassan M, et al. , 2017. Intrinsic dependencies of CT radiomic features on voxel size and number of gray levels. Med. Phys 44, 1050–1062. [DOI] [PMC free article] [PubMed] [Google Scholar]
- Tang X, 1998. Texture information in run-length matrices. IEEE Trans. Image Process 7, 1602–1609. [DOI] [PubMed] [Google Scholar]
- Vallieres M, et al. , 2017. Radiomics strategies for risk assessment of tumour failure in head-and-neck cancer. Sci. Rep 7, 10117. [DOI] [PMC free article] [PubMed] [Google Scholar]
- Zhang L, et al. , 2015. IBEX: an open infrastructure software platform to facilitate collaborative work in radiomics. Med. Phys 42, 1341–1353. [DOI] [PMC free article] [PubMed] [Google Scholar]
- Zhao B, et al. , 2014. Exploring variability in CT characterization of tumors: a preliminary phantom study. Transl. Oncol 7, 88–93. [DOI] [PMC free article] [PubMed] [Google Scholar]
- Zhao B, et al. , 2016. Reproducibility of radiomics for deciphering tumor phenotype with imaging. Sci. Rep 6, 23428. [DOI] [PMC free article] [PubMed] [Google Scholar]