

Abstract
In this report, we observed that YOYO-1 immobilized on a glass surface is much brighter when dried (quantum yield 16±4% in the ambient air) or in hexane than in water (quantum yield ~%).YOYO-1 is a typical cyanine dye that has a photo-isomerization reaction upon light illumination. In order to understand this quenching mechanism, we use femtosecond transient absorption spectroscopy to measure YOYO-1’s electron dynamics after excitation directly. By deconvoluting the hot-ground-state absorption and the stimulated emission, the dynamics of electronic relaxation and balance are revealed. The results support the intermolecular charge transfer mechanism better than the intramolecular relaxation mechanism that has been widely believed before. We believe that the first step of the relaxation involves a Dexter charge transfer between the photo-excited YOYO-1 molecule and another guest molecule that is directly bound to the YOYO-1 giving two radicals with opposite signs of charges. The charges are recombined either directly between these two molecules, or both molecules start to rotate and separate from each other. Eventually, the two charges recombined non-radiatively via various pathways. These pathways are reflected on the complicated multi-exponential decay curves of YOYO-1 fluorescence lifetime measurements. This charge transfer mechanism suggests that (1) electrical insulation may help improve the quantum yield of YOYO-1 in polar solutions significantly and (2) a steric hindrance for the intramolecular rotation may have a less significant effect.
Keywords: transient absorption spectroscopy, intermolecular charge transfer, photochemical kinetics, fluorescence quenching.
Table of Contents (TOC)

Charge transfer (right) has been considered in the literature to be a minor mechanism for YOYO-1’s fluorescence quenching, but the new evidence suggests that it is a significant pathway.
1. INTRODUCTION
The fluorescence quenching mechanisms of a typical organic dye have been summarized in the literature to be a vibrational or/and electrical relaxation of the excited electrons through major pathways shown in Fig. 1, namely, intramolecular relaxation, and intermolecular/intermoiety relaxation including energy transfer (e.g. Förster resonance energy transfer, FRET) and charge separation pathways.1Among these, photo-induced charge separation (via electron or hydrogen transfer) is one of the most fundamental processes in chemistry and biology that has been extensively investigated by diverse experimental and theoretical methods.2–12 For example, ultrafast charge transfer (100 fs) from solvents to Nile Blue A perchlorate (NB) has been reported by Yashihara et al. to be responsible for NB’s fluorescent quenching,10and the same mechanism has been used to explain the fluorescence quenching of oxazines and coumarines.8,13–15
Fig. 1.

Scheme of simplified fluorescence quenching mechanisms, self-quenched (intramolecular) or quenched by other molecules (intermolecular).1 (A) An electron energy diagram of fluorescent and vibrational relaxation of an excited molecule. Blue arrows are electrons with spin, each black line is an electronic orbital, green arrows are fluorescent emission, and orange arrows are thermal relaxation. (B) Energy transfer where the red arrows indicate the energy exchange between two molecules. (C) Charge transfer to another molecule that is directly connected to the molecule.
Here we report a study on the fluorescent quenching mechanism of a typical cyanine dye, YOYO-1 (Fig. 2A), for which intramolecular charge transfer has been considered the major mechanism.16–20 YOYO-1, an oxazole yellow (YO) dimer and a member of the YOYO-TOTO family of cyanine dyes belonging to the polymethine group, is a widely used DNA fluorescent staining dye.21–23 YOYO-1 has a high photon molar absorptivity, with peak extinction coefficient at a visible wavelength approaching 105 cm−1M-1.22 The fluorescence quantum yield of YOYO-1 in water is usually very small (<0.1%) and thus is nonfluorescent. Upon binding to DNA, its quantum yield enhances over 1000 fold and reaches up to 50%.22,24 This huge fluorescence contrast has caused a revolution in molecular biology in the 1990s,25 which enabled visualization and detection of DNA molecules using fluorescent molecules instead of radioactive molecules. The quenching mechanism of the YOYO-1 fluorescence in water has been attributed to the nonradiative decay of excited electrons via the rotation/torsion of the benzoxazole and quinolinium moieties at the methine bridge (photo-isomerization),17 a mechanism proposed for typical polymethine dyes.19,26–30 Theoretical calculations have suggested that the initial rotation is induced by an intramolecular twisted internal charge transfer (TICT).19 In this report, we use femtosecond time-resolved transient absorption (TA) spectroscopy (Fig. 2B) that has been widely used for photo-induced electron dynamics,18,31–36 to revisit YOYO-1’s quenching mechanism. We are particularly comparing the intramolecular TICT relaxation and the intermolecular charge-transfer mechanism.
Fig. 2.
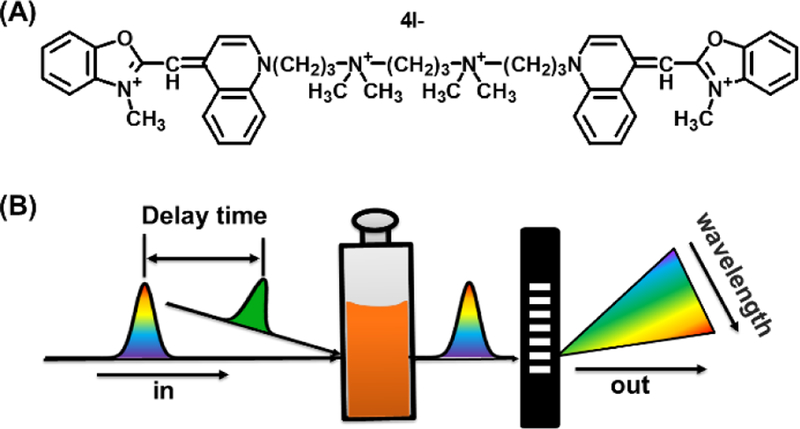
(A) Chemical structure of YOYO-1. (B) Scheme of time-resolved transient absorption spectroscopy. Pump (green) and probe (rainbow) lasers pass through a sample with a delay time between them, and then the probe pulse is analyzed with a spectrometer. The TA signal is the difference in absorbance of the probe before and after excitation.
2. EXPERIMENTAL SECTION
2.1. Fluorescent imaging of YOYO-1.
It was carried out with a 473 nm solid-state excitation laser (Dragon Lasers, China) either under total internal reflection fluorescence (TIRF) or epifluorescence (EPI) mode; Nikon Ti-U inverted microscope with a Nikon 100× oil-immersed TIRF objective (CFI Apo 100×, NA 1.49, WD 0.12 mm); a fluorescent filter cube with ZET488/10 laser bandpass filter, ZT488rdc dichroic mirror, and ET500lp long pass filter (Chroma, USA); and an EMCCD camera (Andor iXon Ultra 897, USA).21
Glass coverslips and tweezers were cleaned by first sonicating in soap (Liquinox) water and secondly using “base piranha” solution (caution for corrosive and splashing). The glass coverslips were washed with ultrapure water after each step and were stored in ultrapure water before use. All cleaned glass coverslips used in these experiments were confirmed to have no fluorescent contamination at the single-molecule level by measuring them before experiments (i.e. no fluorescent spot was observed when searching around the nitrogen blown dry glass coverslips). volume of 10 μL of the solvents, ultrapure water, ethanol (200 proof, Sigma-Aldrich), and hexane (GC grade >99.9%, B&J Brand), were dropped on the clean glasses, dried, and measured. No detectable single-molecule fluorescent signals were observed.
YOYO-1 parent solution (0.1 mM in water) was diluted in ultrapure water to make 0.1 μM, 0.1 nM, and 1 pM solutions. Rhodamine 6G (99%, Sigma-Aldrich) was dissolved in ethanol and its absorbance was measured to be 0.763 at 530 nm (extinction coefficient 116,000 cm−1/M) that corresponds to the concentration of 6.6 μM. This solution was used to make a 1 pM solution.
The high-coverage YOYO-1/glass sample was made by dropping YOYO-1 aqueous solution (0.1 μM, 10 μL) on a glass coverslip and incubated for about 30 s before it was rinsed away by water for about 30 s and blown dry with nitrogen. This sample was imaged during which water and hexane were dropped on and dried alternately (room humidity 17%) both at TIRF and EPI mode. Excitation laser power density was tuned to 18 W/cm2, camera electron-multiplying (EM) gain was set to 50, and the exposure time was 0.02 s per picture. The low-coverage YOYO −1/glass sample was prepared by dropping YOYO-1 solution (1 pM, 3 μL) on a glass coverslip and dried. Low-coverage rhodamine 6G/glass sample was prepared by dropping rhodamine 6G solution (1 pM, 3 μL) on a glass coverslip and dried. Laser power density was tuned to 12 W/cm2, camera EM gain was set to 300, and the exposure time was 0.05 s for single-molecule fluorescence measurements. The histograms of single-molecule intensity were obtained by selecting molecules whose intensities were >5 times the noise level of the fluorescent image.
2.2. UV-Vis spectra.
They were collected with an Ocean Optics USB2000 spectrometer and an Agilent 8453 spectrometer. UV-Vis and steady-state fluorescent spectra were fitted using software Fityk (free version) with Voigt functions.
2.3. Femtosecond transient absorption spectroscopy.
Three solutions for TA measurements were prepared using reagents without further purifications. The water used in sample preparation was an ultrapure deionized (DI) water (18.2 MΩ·cm from Barnstead E-pure system). YOYO-1 in dimethyl sulfoxide (DMSO) (Invitrogen, Thermo Fisher Scientific) was diluted to 10 μM in ultrapure water, or DMSO (Sigma-Aldrich) for the two solutions of YOYO-1/water and YOYO-1/DMSO, respectively. This relative low concentration is chosen to avoid the formation of H-aggregation or J-aggregation of YOYO-1 in the solutions. YOYO-1/DNA solution (300 μg/mL) was made by adding phage Lambda DNA (48,502 basepairs, Thermo Fisher Scientific) to the buffer solution of 25 mM HEPES (pH 7.4, Sigma-Aldrich), 20 mM NaCl (Sigma-Aldrich), and 2 mM MgCl2 (Ambion, Thermo Fisher Scientific). The YOYO-1 to DNA basepair ratio was calculated to be 1:46 assuming an average molecular weight per basepair of 650 daltons for double-stranded DNA with sodium salt. The relatively small dye-DNA ratio minimizes the minutes to remove air bubbles, and the DNA samples were incubated overnight before the TA measurements.
Femtosecond TA spectra were collected on a HELIOS femtosecond transient absorption spectrometer (Ultrafast Systems, USA). The instrumental setup and the experimental procedures were reported previously.31,37,38 The pump laser was set to 486±1 nm whose power was adjusted to 185±5 μW, and the probe white-light laser was measured at 30±5 μW. Under these conditions, nonlinear laser effects or two-photon absorption, and photobleaching were negligible or minimal. The repetition rate was 1 kHz, and the pump-probe pulse convoluted width was ~150 fs. During the experiments, the sample solutions were irradiated with an absorbance of 0.2 measured at the excitation wavelength in a 2.0 mm path length cuvette under mild stirring. All TA data were corrected by subtracting spectral background features that persisted from the previous pulse and appeared pre-pulse, as well as applying chirp and t0 corrections
A home-written MATLAB code was used to analyse the TA spectral data which was represented from the Surface Xplorer Pro 1.1.5 software that came with the instrument (see its online manual for details).39 The spectra were further analysed with 2D correlation method reported in the literature by Noda.40 The time traces were fitted with a multi-exponential function that was convoluted with the instrument response function (IRF) using MATLAB. The standard deviations were obtained by fitting different measurements using the same set of initial guesses.41
2.4. DFT calculations.
They were carried out in Gaussian 09 D.0142 using B3LYP42 hybrid functional with 6–311G+(d,p)43 basis sets. Single-molecule fluorescent data were analysed using the open-source M TL B codes reported before.21,44–46
3. RESULTS
To compare the mechanisms shown in Fig. 1 and re-evaluate the significant ones, we measure the fluorescent signal of YOYO-1 in polar and non-polar solvents. Because YOYO-1 is insoluble in non-polar solvents, bulk solution measurements are difficult. We adsorb the YOYO-1 onto a glass surface so that we can change solvents freely. Before data collection, we confirmed that the cleaned glass and all solvents do not have any fluorescent contamination under the 473 nm laser excitation. Dried YOYO-1 on the glass results in a bright image compared to the scratches where the dye is removed by a tweezer tip (Fig. 3A). It becomes extremely weak with a water-drop on it which is consistent with the bulk solution measurements that the fluorescence quantum yield of YOYO-1 in water is almost zero. small number of molecules may have been washed away but a photobleaching test left a clear bleaching mark on the dried sample, which confirms that the majority dyes stay. When dropping hexane (non-polar) on the glass surface, the fluorescence intensity drops to about half of that in the air (Fig. 3B). These measurements are repeated by dropping and drying alternately to confirm reproducibility. The measurements are done both on TIRF and EPI modes obtaining similar results suggesting that intensity change is not because of excitation variation. At the single-molecule level, dried YOYO-1 is also bright (Fig. 3C). Its intensity is compared to single-molecule rhodamine 6G (R6G) (Fig. 3D). These bright spots are confirmed to be the molecule of interest by dropping more solutions and dried to confirm the increase of coverage upon addition, and the solvents have been confirmed to be clean. The coverage is consistent with the calculated coverage of 3 μL of a 1 pM solution covering a ~1 cm2 area, which gives a surface coverage 1.8×10¹⁰ m−2, or ~20 molecules per area in Fig. 3C and 3D. We see bright YOYO-1 when we drop hexane on the glass. We don’t observe single-molecule YOYO-1 in water.
Fig. 3.

Normalized average photocounts of YOYO-1/glass (high coverage) (A) before and after dropping pure water indicated by the red arrows, and (B) pure hexane on the glass coverslip. Insets and the grey arrows show example fluorescent images that have the same color scale representing intensities. The dark scratches are created by a tweezer tip. Relatively large intensity fluctuations in (A and B) are caused by the moving pipette tip. Fluorescent images of single-molecule (C) YOYO-1, and (D) rhodamine 6G dried on clean glass coverslips. (E) Histograms of the bright spots (intensities >5 times the standard deviation of the image noise) on the fluorescent images (magenta is the overlap part). All scale bars are 10 μm.
The quantitative quantum-yield analysis is carried out only for the dried samples using a single-molecule method established in the literature.47 Dried single-molecule samples avoid the bias from possible variations of the excitation intensities, aggregation, and washing on the high molecular coverage samples. Using the standard R6G dye as a reference, the fluorescence quantum yield of dried YOYO-1 is calculated 16±4% (See the next paragraph for the calculations), which is >500 times the quantum yield of YOYO-1 in water (almost three orders of magnitude increase) and is comparable to (~1/3) the quantum yield of those intercalated in a DNA molecule. The experiment has been carried out under ambient conditions with 17% relative humidity. Removing water and oxygen in the air may further increase the quantum yield value.
Under the same conditions for the instrumentation set-up, the average fitted maximum of the point spread function of single-molecule YOYO-1 is 2500±900 photocounts and R6G is 2600±500 photocounts, respectively (Fig. 3E). The extinction coefficient of R6G at 473 nm is 1.1×104 cm−1M−1, and its fluorescence quantum yield is >95%.48 The extinction coefficient of YOYO-1 at 473 nm is 7.3 ×104 cm−1 M-1.24 Our long-pass filter cuts 11% YOYO-1 emission signal and allows all R6G signal to pass. The EMCCD detector has a uniform sensitivity on both the YOYO-1 and the R6G emissions wavelengths. Assuming a small molecular orientational effect because the excitation and collection angle of our 100× objective spans most of the whole half sphere (−77o to 77o, with objective NA 1.49, and the refractive index 1.53 for both glass and the objective immersion oil), the quantum yield of dried YOYO-1 on glass can be calculated using the Beer–Lambert law and referenced to the R6G standard. The extinction coefficient of the dye is measured using solution transmission:
| (1) |
where A is the absorbance, I0 is the incident photon flux, IT is the transmitted photon flux, l is the optical path length of the solution, c is the concentration of the dye in the solution, and ε is its extinction coefficient. Thus for a 1 μM solution in a 1 cm long cuvette when the precondition is met, i.e. each photon passes less than one molecule, the absorbance of YOYO-1 is 1.18 and R6G is 1.03 at 473 nm, meaning that each YOYO-1 molecule absorbs (7.3 ×10⁴)/(1.1×104) = 6.6 times more photons than each R6G molecule at this wavelength, i.e., a YOYO-1 molecule has 6.6 times larger absorption cross section than an R6G molecule at 473 nm.
Fluorescence quantum yield of a molecule is defined as the number of emitted photons of interest over the number of absorbed photons. Thus, the average quantum yield of these bright YOYO-1 molecules
| (2) |
where QYR is the quantum yield of the reference molecule, Em is the detected average emission, and D/DR is the relative photon collection efficiency between the molecule and the reference. Thus, dried YOYO-1 QY = 95%×(2500/89%)/6.6/(2600/100%) = 16±4%. The error bar is estimated from the distribution of the emission intensities.
TA has been demonstrated as a powerful technique in measuring charge transfer18,33–36 thus we measured the TA spectra of YOYO-1 molecules in three different solutions, namely in water, DMSO, and a DNA buffer solution (Fig. 4). YOYO-1 only dissolves in polar solvents. Thus, we cannot measure YOYO-1 TA in non-polar solvents. When intercalated into DNA basepairs, the two head groups of YOYO-1 are in a hydrophobic environment and the linker part of YOYO-1 is at the water-DNA interface. The dynamics of the excited electron decay is observed in the positive (red) parts of the TA spectra in Fig. 4. A low dye concentration (10−5 M) is selected to minimize the intermolecular aggregation of dyes in the solution. The depleted-ground-state refill is observed in most of the negative (blue) parts of Fig. 4. The absorbance signal after the pulsed laser excitation has been referenced to the absorbance of the solution before the excitation. Thus, a positive signal indicates the concentration increase of the species it represents after excitation than before excitation and a negative signal indicates a concentration decrease. The steady-state UV-Vis spectra and fluorescent emission spectra of YOYO-1 are available in the supporting information as Fig. S1–S3. The relationship between the different TA absorption peaks is shown in the supporting information Fig. S4 via the 2D-correlation analysis,40,49–52 on which a positive correlation means that the two signals go up and down over time synchronously, and a negative value means an anti-correlation.
Fig. 4.

The probe TA spectra change (ΔA) after the pump excitation of 10 μM YOYO-1 (A) in water, (B) in DMSO, and (C) 460 μM DNA basepair (300 μg/mL phage λ-DNA) upon different pump-probe delay times. The lower row is the zoom-in of the first 100 ps in the spectra above. Experiments were repeated with two sets of different samples on different days. Consistency has been observed. Pump pulse is 100 fs, 486 nm (2.55 eV) laser; and probe pulse is 100 fs, white light laser. (D-F) Sample spectra in (A-C) over delay time 0.5, 1, 2, 5, 10, 20, 50, 100, 200, 500, 1000, and 1500 ps
The peaks in the TA spectra are assigned (Fig. 5) based on YOYO-1’s UV-Vis absorption spectra (supporting information Fig. S1, S2), fluorescence emission spectra (supporting information Fig. S3), and 2D correlation spectra of the TA measurements (supporting information Fig. S4). First, from the UV-Vis absorption spectra, three bands of absorption are observed for YOYO-1, with absorption energy centered around 2.5 eV (496 nm), 4 eV (310 nm), and >5 eV (248 nm), respectively (supporting information Fig. S2). These three bands represent the energy gaps between the ground state (S0) and three separated groups of excited states named S1, S2, and S3 respectively. The S0-S3 absorption overlaps with the quartz cuvette absorption range (starts above ~7 eV and goes up) thus its energy center cannot be determined from the spectra. Second, the fluorescent emission is Stokes shifted from the S0-S1 absorption of about 0.2 eV (~40 nm) (supporting information Fig. S3). Usually, the fluorescence has randomly-oriented emission angles during a regular fluorescent experiment and would be undetectable for a detector positioned relatively far away. However, in the TA experiment, the probe stimulates the emission in the same direction, with the emission intensity as a function of the probe intensity, spectral overlap, and the population of the excited-state molecules.53 Thus, stimulated emission (SE) is often observed in TA experiments.32 The dynamics of the transient absorption bands also help in the peak assignments because the bands originating from the same excited electrons will have the same or similar decay dynamics and will show positive correlations among them on the 2D correlation spectra (supporting information Fig. S4).
Fig. 5.

(A) YOYO-1 absorption and emission spectra in energy scale. The blue solid line is the absorption of YOYO-1 in water, the blue dashed line is the YOYO-1 absorption in DNA, and the red dashed line is the YOYO-1 emission in DNA. (B) Scheme of band assignment in the TA spectra. The YOYO-1 molecular orbitals are coupled with its atomic nucleus vibrations (Franck-Condon principle) to represent a distribution of molecules with the same electronic structure but different vibrational states in the solution at a given moment. Sn indicates one excited electron on the nth electronic orbital (often delocalized) and another electron in the ground state leaving a vacancy on the HOMO of the original host atom of the excited electron right after the excitation (delocalized over time). Arrows show the absorptions (blue arrows), the vibrational relaxation (twisted red arrows), and the emission (straight red arrow) of YOYO-1.
The band with two peaks at 2.54 eV and 2.71 eV is apparently the ground-state depletion after the excitation, because they have the same peak position values in the S0-S1 band of the steady-state UV-Vis absorption spectra, which represents the energy gap between the highest occupied molecular orbital (HOMO) and the lowest unoccupied molecular orbital (LUMO). The initially negative TA signal of this band represents the decrease of the ground-state-molecule concentration in the solution after excitation, and its dynamics represent the rebuilding of the ground-state population that has been depleted by the pump laser. This band is negative for the three solutions and goes back to zero at very different rates. The 1.7 eV and 3.4 eV band is the excited state absorption of LUMO electrons (the same as calculated from the energy gaps in the steady-state absorption spectra).32 These two bands are positively correlated with each other and are negatively correlated with the ground-state repopulation, perfectly representing the LUMO (lose) to HOMO (gain) electron relaxation. These two bands are all positive at the beginning and decay back to zero in the three solutions. The steady-state S0-S3 band (> 5 eV) overlaps with the quartz absorption, but the S1-S3 transition in the TA spectra can be well resolved at about 3.4 eV (Fig. 4, 5). The transitions of S0-S2 and S0-S3 are ~4 eV and 5.5 eV, respectively. These two bands are positioned beyond the energy window of our probe laser.
The band around 2.24 eV and 2.35 eV is the combination of the fluorescence stimulated emission (SE),32 and the absorption of HOMO electrons when the molecules are at an upper vibrational level (S0*).54 The SE peaks have the same energies on the steady-state fluorescent emission spectrum and S0* is called the Franck-Condon ground state or the hot-ground-state.55–57 At the same time, the molecule can undergo photoisomerization. These assignments are supported by the 2D correlation analysis (supporting information Fig. S4). The positive correlation between 1.7 eV and 3.4 eV (red color) groups them both as contributing from the excited LUMO electrons of the molecules at S1 excited state, both being anti-correlated to the HOMO electron absorption (e.g., the band at 2.54 eV). Condition-dependent positive and negative correlation between 2.54 eV and 2.24 eV split the origin of 2.24 eV signal, coming from the excited electrons of molecules either at S0* or at S1 states competing with each other under different conditions. This assignment explains why the band is negative right after excitation in all three solutions. At this moment, the excited-state molecules have a large population which contributes to a large SE signal, and the hot-ground-state population is zero which does not contribute to any signal. As time goes by in the water, the relaxation of the excited molecule is very fast (a few ps), which relaxes mostly to the ground state such that the SE signal becomes very small. A small population of the excited-state molecules relaxes to the hot-ground-state (S0*) and eventually relaxes back to the ground state. These hot-ground-state molecules contribute to a small positive signal at around 5 ps that vanishes back to zero later. In DMSO, the excitation state also relaxes fast (~20 ps), but a more substantial portion goes to the hot-ground-state. Thus, the signal dramatically overshoots to a relatively large positive value at ~10 ps (red color at 2.35 eV, 10 ps on Fig. 4B). This signal stays positive for a longer time and then relaxes in ~50 ps, with a small portion remaining positive even after 1 ns. In DNA, the excited-state population remains large and the hot-ground-state population is small throughout our experimental time window. Thus, only the negative signal is observed, because the SE signal dominates the S0* absorption.
A target analysis strategy, which has been commonly used in the data analysis of time-resolved spectra,41 is used to analyze the decay curves of the TA spectra with a two-step electron transfer model shown in Fig. 6. Within this model, right after the pump laser excitation, YOYO-1 has ground-state depletion (some molecules are excited), leaving an electron vacancy at HOMO, and an excited electron at LUMO. Thus, the excited molecule stays electrically neutral with a possible(oscillating)dipole formation at 1|HO LU>. These electrons have intramolecular charge transfer nature according to theoretical calculations on the model system stilbene.19 The energy structure of the excited molecules remains largely unchanged because no significant peak shifting is observed in the TA measurement and the excited electrons absorb light consistent with the gap of the ground-state absorptions (Fig. 5): 1.7 eV consistent with the gap between absorption peaks representing S0-S1 and S0-S2 transitions, and 3.4 eV consistent with the gap between absorption peaks representing S0-S1 and S0-S3 transitions. The electron vacancy at HOMO gives a negative ΔA in the TA spectra, and the LUMO electron gives a positive ΔA signal. At time zero, no charge transfer is expected such that the sum of these two signal is zero. The absorption cross section of the missing HOMO electron (hole) before excitation to a 2.71 eV light and the excited electron after excitation to a 3.44 eV light have similar magnitudes but opposite signs on the TA spectra (Fig. 4D–4E). At time zero, their concentration should be the same. Thus, we normalize the 2.71 eV decay curve representing the electron vacancy concentration at HOMO (concentration of molecules with a missing electron in the HOMO) to −1 and normalize the 3.44 eV decay curve representing the electron concentration at LUMO (concentration of molecules with an excited electron in the LUMO) to 1 at time zero, such that the sum of both equals zero at time zero.
Fig. 6.

Scheme of a two-step Dexter electron transfer mechanism (top) based on the normalized absorption decays (bottom) that represent the concentration of molecules with different electronic states vs pulse delay time for YOYO-1 in (A) water, (B) DMSO, and (C) DNA solutions. (Top) Lines represent energy levels (molecular orbitals), blue dots represent electrons, red circles represent available space for electrons on the HOMO, black states represent unknown molecules that can donate and accept electrons, and arrows represent the electron decay pathways. The numbers in the scheme represent the order in the time series. (Bottom) Negative values in the decay curves mean the loss of electrons after excitation and positive values represent the excited electrons. The red curve (representing 1|HO LU> absorbance) and blue curve (representing 1|HO HO> absorbance) are normalized raw data, the green curve is the sum of these two, the orange curve (representing 1|HO* HO*> absorbance) is calculated from two curves explained in the main text, and the purple curve is the sum of the orange and green curves.
The asymmetry between the curves of electron vacancy in HOMO and excited electrons in LUMO in water and DMSO suggests that a simplified picture of the relaxation pathway shown in Fig. 1A fails. If the only available pathways for the LUMO electrons to decay back to the HOMO are via fluorescence and thermal relaxation, the sum (the green curve HO+LU in Fig. 6) of the HOMO and the LUMO decay curves (the red and the blue curves in Fig. 6) would have remained at zero as a function of time, and a symmetric decay pattern would have been observed. However, when adding the two experimental decay curves of HOMO and LUMO, a negative signal is obtained in both water (Fig. 6A green curve) and DMSO (Fig. 6B green curve), while conservation is observed in the DNA solution (Fig. 6C green curve). At first, we have considered that all the missing electrons relax to the hot- ground-state HOMO* when both electrons are at the HOMO, but the nuclei are at higher vibrational levels. Thus, we further analyze the concentrations of molecules at S0*.
The decay curve at 2.35 eV contains HOMO* electron absorption, and the fluorescence stimulated emission signal (negative signal) whose intensity is directly proportional to the concentration of molecules at S1. Thus the absorbance of the electrons in HOMO* (Fig. 6 orange curves) can be deconvoluted from the decay curve at 2.35 eV (A2.35eV) and the absorbance of the excited electrons (ALU). The probe laser with intensity I0 passes the sample and gives a new light intensity
where IT is the transmitting light intensity, and ISE is the fluorescence stimulated emission intensity. Thus, the measured TA signal at 2.35 eV is
| (3) |
In which the absorbance of the molecules at hot-ground-state is
| (4) |
and the stimulated emission intensity ISE is proportional to the concentration of the LUMO electrons and eventually the absorbance of the LUMO electrons ALU:
| (5) |
where a is a constant.
Once we apply the boundary condition that at time = 0, AHO* (@ t = 0) = 0, and IT (@ t = 0) = I0 (no absorption, Equation 4) at 2.35 eV in Equation 3 and 5, we obtain
A2.35eV (@t = 0) is the measured TA value at 2.35 eV and time zero, ALU (@t = 0) is the measured TA value at 3.44 eV and time zero.
Thus with Equation 3,
and with Equation 4,
| (6) |
The constant k in Equation 6 contains the coefficient of the stimulated emission intensity of the excited state electrons. The HO* curves are calculated before normalization and are then normalized such that the total electrons in YOYO-1 are within (−)1 to (+)1 near the beginning of the delay time, and approach zero at longer time because permanent ionization of YOYO-1 is rare under our experimental conditions, beyond the detection of the TA’s signal to noise level. A more accurate normalization factor can be established in the future if the absorption cross-section of the hot-ground-state electrons is measured. An example of this data treatment has been shown in the supporting information Fig. S5. This data treatment helps to visualize the hot-ground-state absorption that has been saturated by the strong SE signal of YOYO-1.
The decay lifetimes of molecules at excited and ground state are fitted with a multi-exponential function convoluted with the instrument response function (IRF). The results are shown in Table 1. The shorter lifetimes are consistent with water hydrogen bond reformation time (~1–2 ps),56,58–60 the average (sum(Aτ)/sum(A), where A is the preexponential factor and τ is the lifetime) of the two lifetimes 33 ps and 146 ps is 74 ps, which is consistent with free YOYO-1 rotation in water ~60 ps reported in the literature;17 DMSO dye coupling ~7 ps,61 DMSO wobbling lifetime ~20 ps;59 and a lifetime at ~400 ps is observed in DNA which is consistent with the conformational change of water bound to DNA molecules ~450 ps.62 The longer lifetimes at a few to several nanoseconds are consistent with YOYO-1’s long-lived fluorescent decay lifetimes.17
Table 1.
Excited |LU1> electron decay (e) and |HO1> refill lifetimes of YOYO-1 in (A) water, (B) DMSO, and (C) DNA solution.
| Pre-exponential factor (%) | Lifetimes (ps) | ||||||||
|---|---|---|---|---|---|---|---|---|---|
| A1 | A2 | A3 | A4 | τ1 | τ2 | τ3 | τ4 (ns) | ||
| (A) | LU | 60(2) | 23(3) | 13(1) | 4(1) | 2.3(0.1) | 33(2) | 146(29) | 1.2(0.2) |
| HO | −55(1) | −45(5) | −11(2) | 26(4) | 143(12) | 1.5(0.1) | |||
| (B) | LU | 42(5) | 45(3) | 9(2) | 4(1) | 0.7(0.5) | 6.8(1) | 29(2) | 0.5(0.1) |
| HO | −82(1) | −18(1) | 22(1) | 2.1(0.3) | |||||
| (C) | LU | 21(2) | 42(2) | 37(3) | 2(1) | 390(20) | 6.2(0.8) | ||
| HO | −13(2) | −43(3) | −44(2) | 4(1) | 410(40) | 8.2(1.2) | |||
Note. See supporting information Fig. S6 for an example fitting of each. (Error) represents the standard deviation of two different samples and multiple fittings. All fittings have R2>0.98.
DFT calculations were performed to compare the molecular structures when the hydrogen at the methine group is pulled away from YOYO-1. The YO molecule favors a planar structure as expected (Fig. 7A). The electron density at the hydrogen at the methine group contributes to the HOMO while it does not contribute to the LUMO (left the black arrow in Fig. 7), making it vulnerable at the excited state. For example, when an OH- (O2 should do the same thing too) is placed near the hydrogen of the methine group, it pulls the hydrogen away from the methine (Fig. 7B). The rest of the molecule adapts a perpendicular geometry between the two moieties connected by the bridging methine, with uneven distributions of electron densities.
Fig. 7.

The density functional theory (DFT)-calculated HOMO and LUMO electron clouds, and the most stable geometry of the methine group for (A) YO and (B) YO with an OH- near the methine group. The red arrow indicates the chemical difference between the two, black arrows highlight the methine hydrogen, and the green and red balloons represent the electron clouds.
4. Discussion
The fluorescence results of YOYO-1 on the glass slides suggest a mechanism other than the intramolecular rotation and the energy transfer mechanism. It is reasonable to assume that the immobilization has a certain degree of effect on the free rotation of the molecules. Thus, a larger quantum yield should have been observed for YOYO-1 yet the value still approaching zero, the same value observed in the bulk solution. If photo-isomerization, hula-twist,1 or wobbling is responsible for the quenching, the molecule should have remained non-fluorescent when these movements are allowed in all three cases (dye, in water, or in hexane). In order to explain the increased fluorescence in air and hexane, an alternative theory should be considered. Intermolecular charge transfer could explain the results as charge transfer to the solvent should be allowed in the water, but not in hexane or air. One large assumption above is that the physical properties of YOYO-1 molecules themselves are treated roughly equally in each environment. But it is possible that the environmental change affects the YOYO-1 properties. Three important environmental factors are viscosity, polarity, and the degree of intramolecular aggregation. The effect of viscosity supports our results that rotation is hindered because water is ~3 times more viscous than hexane, 8.9×10⁻⁴ Pa s compared to 3.0×10⁻⁴ Pa s respectively and the fluorescence is increased in hexane. This is opposite to the trend that rotation should be slower in water than in hexane thus YOYO-1 should have been brighter in water than in hexane if viscosity is the major factor. One original research in the literature about the effect of solvent viscosity on dye fluorescence is done by changing the temperature of a dye-glycerol-water or similar solution.26,63 These experiments cannot exclude the possibility of intermolecular charge transfer because temperature also affects the charge transfer and dye-solvent interaction. Solvent polarity could be another possible explanation because typically, an increase of polarity will cause a lower solvent relaxed excited energy level, leading to a decrease in fluorescence for polar or charged dyes like YOYO-1. YOYO-1 is known to form intramolecular H-aggregates. Less than an order of magnitude change in the fluorescence quantum yield could be explained by intramolecular aggregation if the degree of aggregation is affected by the environment.64
The TA results also favor an intermolecular charge transfer mechanism better than the intramolecular interaction mechanism. Positive absorption signal of total electrons in YOYO-1 is observed in both water (Fig. 6A purple curve) and in DMSO (Fig. 6B purple curve). This phenomenon is unlikely to be explained by the intramolecular π electron transfer mechanism proposed in the literature which predicts a flat and zero total absorption.19 If the excited electron breaks the bridging π bond, positions the molecule in twisted geometry or rotation, or transfers the molecule to a triplet state, or relaxes via a Förster resonance energy transfer process, then, either electron conservation should be observed when all of these electrons still absorb light within our observation window, or a net loss of electrons should be observed if the electron/electrons no longer absorb light in our observation wavelengths. Our observation of electron net gain disfavors these mechanisms. Thus, extra electron donors must be considered. One possible electron donor source is the intermolecular charge transfer (YOYO-1 could gain an electron from or lose a hydrogen cation to the solvent molecules).8,65–67 Another source could be an electron from the sigma or non-bonding orbitals of YOYO-1 that does not change the electronic energy structure of the molecule when moved. In both cases, our data suggest that the relaxation of the HOMO vacancy at the hot-ground-state is the first step of relaxation. The source of the electrons are more likely from the solvent rather than from YOYO-1 itself given that solvent-dye charge transfer is a commonly observed phenomenon in photosynthesis systems, where hydrogen bonds are considered effective electron donors.8,33,36,65–71 The detailed mechanism can be a direct charge flow via hydrogen bond or a two-step Dexter electron transfer observed in many systems.36,72,73 This hypothesis is supported by the DFT calculations (Fig. 7).
In water and DMSO solutions, the fluorescence quantum yields of YOYO-1 are known to be almost zero, and the excited molecules are known to rotate at the bridging carbon (photo-isomerization). The data observed here perfectly explains both conclusions. Right after the excitation, the positive electron vacancy is neutralized by an electron (lifetime ~2 ps) from outside of the HOMO-LUMO electrons (step 1 in Fig. 6A, 6B), pushing the whole molecule (nuclei) to an upper vibrational state and a free electron in the LUMO. The molecule is negatively ionized to a radical if the electron is from another molecule and a dipole is created if the electron is from an internal sigma-bond electron. This process (a few ps in water) is much faster than the fluorescent relaxation of the excited electron to the ground states (lifetime ~4 ns in DNA),17 dominating the non-radiative decay pathway and making the fluorescence quantum yield in water and DMSO almost negligible. Then, the free excited electrons transfer out of the system to fill the outside positive charge (step 2 in Fig. 6A, 6B) which quenches the radicals. The injection of an extra electron into the π system changes the C=C double bond to a near single bond condition, and thus enables the photoisomerization. The quencher cannot be identified in this measurement but is highly suspected to be water/DMSO and/or oxygen that can donate an electron or accept a proton in step 1 (Fig. 6).
The TA data of YOYO-1 in DNA solution suggest that the HOMO relaxation via charge transfer is hindered because no net gain of electrons is observed (Fig. 6C). The fluorescence quantum yield of YOYO-1 in DNA is known ~50%,22,24 a high value that the fast charge transfer quenching should have been blocked because the intercalation of YOYO-1 in the DNA basepairs protects the molecule from the solvent charge donor. Thus, S0* electrons are not observed during the whole excitation and relaxation processes. Dye photophysics is known to be dependent on the binding geometry of YOYO-1 in DNA thus a high DNA:dye ratio is used in this report to minimize the number of non-intercalated dyes.23 If charge transfer still happens in this situation, its effect spans the long lived excited states and is undetected in our TA measurement. In the literature, intercalated YOYO-1 is known to photo-cleave DNA molecules at relatively high illumination intensities, which means charge transfer must also happen under that condition to generate radicals in the solution.
The decay results in Table 1 suggest that in water and DMSO, about half of the excited molecules, 60%, and 40% respectively, relax via the same solvent molecules that directly bind to the molecules via a fast charge exchange in less than a few picoseconds (Fig. 6). This nonradiative relaxation is independent of the solvent viscosity because it is in the faster time domain than the diffusive solvation dynamics. Giving the fast electron exchange rate, it is likely to be a Dexter energy transfer process,74 consistent with a typical solute-solvent electron transfer dynamics.8,10,13 The rest half of the excited molecules live longer and rotate or move away from the solvent molecule that has donated the charges. Eventually, the negative charge on the dye molecule recombines with the positive charge either on the same solvent molecule or a different solvent molecule depending on the stability of the charges on the molecules. Possibly with the same molecule due to the Coulombic attraction between the positive and the negative charges but only recombine at a binding geometry. This relaxation is dependent on the solvent viscosity. Both decays are nonfluorescent and should be the major physical origin of the nonradiative decay pathways. Very few excited dye molecules survive to illuminate. In DNA, however, ~20% excited molecules nonradiative relaxed at 2–4 ps, ~40% relaxed via the interaction between the dye, the DNA bases, and solvent which can form radicalss; and ~40% molecules can survive to give fluorescent signals.
The shape of the ground-state bleaching band (hole absorption) of YOYO-1 in water and DNA does not change much over time but a noticeable change is observed in DMSO (Fig. 4). A possible reason can be that YOYO-1 gets hotter in DMSO than the other two cases. This hypothesis is consistent with the larger amount of hot-ground-state electron calculated from the spectra (Fig. 6B). YOYO-1 aggregation and FRET has been observed but they are unlikely to be the major quenching mechanism because the same phenomena are also observed for diluted monomer YO.20 The shorter decay lifetimes of ESA than the triplet state lifetime (>10 μs)75,76 excludes a significant population of triplet-state YOYO-1, consistent with an estimation of less than 0.1% triplet probability for excited typical cyanine dyes.77
5. CONCLUSIONS
In summary, we have proposed a method for transient absorption spectroscopy to deconvolute the hot-ground-state absorption from the stimulated emission signal and apply it to study the YOYO-1 fluorescence quenching mechanism in polar solvents. After photoexcitation of YOYO-1, we speculate that intermolecular charge transfer quenches the HOMO of the excited molecules in water and DMSO (making [YOYO-1]−1 radical anions), which is responsible for its initial fluorescence quenching. The energy of the excited electron can be relaxed using the existing energy levels of the solvents and no transient energy levels are needed on the dye molecule. The charge transfer process is significantly blocked when YOYO-1 is intercalated in the DNA basepairs or is dried on a glass surface, which greatly increases YOYO-1’s fluorescence quantum yield. This experimental observation highly recommends including both electronic and molecular dynamics between the dye molecules and the solvent molecules in the future theoretical calculations for organic dye photophysics. We conclude that the intramolecular rotation is a consequence of intermolecular charge transfer after photoexcitation, rather than the previously believed major nonradiative decay pathway of the excited molecules. This conclusion leads to a dramatically different polymethine dye designing principle: a charge insulating may work to stop the charge transfer, and thus significantly increase the dye’s fluorescence quantum yield in polar solvents, while steric hindrance for rotation may not work.
Supplementary Material
Highlights.
Charge transfer induced fluorescent quenching is a well-accepted concept for many fields but is less accepted by the YOYO-1 community. YOYO-1 is a typical cyanine dye that is fluorescently dark in water but is very bright when binding to DNA, making it one of the most successful staining reagents for DNA sensing and imaging.
The mostly believed mechanism for the fluorescence quenching in water is the photo-isomerization reaction of the methine group in YOYO-1, i.e. an intramolecular bond twisting and rotating.
In this manuscript, we provide evidence based on ultrafast transient absorption (TA) spectroscopy to support the alternative intermolecular charge transfer mechanism. TA on YOYO-1 has not been measured before.
We believe that our new data suggest that the non-radiative decay of photo-excited YOYO-1 starts with an ultrafast charge-exchange with its environment (solvents), followed by charge separation and slower recombination.
This observation is also consistent with fluorescent quantum yield measurements and DFT calculations that have also been included in this manuscript.
We speculate that the charge separation induces photo-isomerization of YOYO-1.
ACKNOWLEDGEMENTS
The authors thank the National Science Foundation under Grant No. CHE-0947031 for instrumental support; thank Dr. Michael Jensen and his group for help in UV-Vis measurements; thank Dr. Hugh Richardson, Kurt Sy Piecco and Juvinch Vicente for beneficial discussions; thank Ohio University faculty startup program, Nanoscale and Quantum Phenomena Institute (NQPI), and Condensed Matter and Surface Science Program (CMSS) for financial support.
Footnotes
Publisher's Disclaimer: This is a PDF file of an unedited manuscript that has been accepted for publication. As a service to our customers we are providing this early version of the manuscript. The manuscript will undergo copyediting, typesetting, and review of the resulting proof before it is published in its final citable form. Please note that during the production process errors may be discovered which could affect the content, and all legal disclaimers that apply to the journal pertain.
ASSOCIATED CONTENT
REFERENCES
- (1).Lakowicz JR Principles of Fluorescence Spectroscopy; 3rd ed.; Springer US, 2006. [Google Scholar]
- (2).Dereka B; Koch M; Vauthey E Looking at Photoinduced Charge Transfer Processes in the IR: Answers to Several Long-Standing Questions. Acc. Chem. Res 2017, 50, 426–434. [DOI] [PubMed] [Google Scholar]
- (3).Park S; Fischer AL; Li Z; Bassi R; Niyogi KK; Fleming GR Snapshot Transient Absorption Spectroscopy of Carotenoid Radical Cations in High-Light-Acclimating Thylakoid Membranes. J. Phys. Chem. Lett 2017, 8, 5548–5554. [DOI] [PubMed] [Google Scholar]
- (4).Dieter R; Albert W Kinetics of Fluorescence Quenching by Electron and H‐Atom Transfer. Isr. J. Chem 1970, 8, 259–271. [Google Scholar]
- (5).Zhao J; Chen J; Cui Y; Wang J; Xia L; Dai Y; Song P; Ma F A Questionable Excited State Double-Proton Transfer Mechanism for 3-Hydroxyisoquinoline. Phys. Chem. Chem. Phys 2015, 17, 1142–1150. [DOI] [PubMed] [Google Scholar]
- (6).Marenich AV; Cramer CJ; Truhlar DG Universal Solvation Model Based on Solute Electron Density and on a Continuum Model of the Solvent Defined by the Bulk Dielectric Constant and Atomic Surface Tensions. J. Phys. Chem. B 2009, 113, 6378–6396. [DOI] [PubMed] [Google Scholar]
- (7).Ma X; Hua J; Wu W; Jin Y; Meng F; Zhan W; Tian H A High-Efficiency Cyanine Dye for Dye-Sensitized Solar Cells. Tetrahedron 2008, 64, 345–350. [Google Scholar]
- (8).Zhao G-J; Liu J-Y; Zhou L-C; Han K-L Site-Selective Photoinduced Electron Transfer from Alcoholic Solvents to the Chromophore Facilitated by Hydrogen Bonding: A New Fluorescence Quenching Mechanism. J. Phys. Chem. B 2007, 111, 8940–8945. [DOI] [PubMed] [Google Scholar]
- (9).Zhao G-J; Han K-L Early Time Hydrogen-Bonding Dynamics of Photoexcited Coumarin 102 in Hydrogen-Donating Solvents: Theoretical Study. J. Phys. Chem. A 2007, 111, 2469–2474. [DOI] [PubMed] [Google Scholar]
- (10).Nagasawa Y; Yartsev AP; Tominaga K; Johnson AE; Yoshihara K Temperature Dependence of Ultrafast Intermolecular Electron Transfer Faster than Solvation Process. J. Chem. Phys 1994, 101, 5717–5726. [Google Scholar]
- (11).Rettig W Photoinduced Charge Separation via Twisted Intramolecular Charge Transfer States. In Electron Transfer I; Springer, 1994; pp. 253–299. [Google Scholar]
- (12).Fonseca T; Ladanyi BM Breakdown of Linear Response for Solvation Dynamics in Methanol. J. Phys. Chem 1991, 95, 2116–2119. [Google Scholar]
- (13).Nagasawa Y; Yartsev AP; Tominaga K; Bisht PB; Johnson AE; Yoshihara K Dynamic Aspects of Ultrafast Intermolecular Electron Transfer Faster than Solvation Process: Substituent Effects and Energy Gap Dependence. J. Phys. Chem 1995, 99, 653–662. [Google Scholar]
- (14).Pal H; Nagasawa Y; Tominaga K; Yoshihara K Deuterium Isotope Effect on Ultrafast Intermolecular Electron Transfer. J. Phys. Chem 1996, 100, 11964–11974. [Google Scholar]
- (15).Yoshihara K; Tominaga K; Nagasawa Y Effects of the Solvent Dynamics and Vibrational Motions in Electron Transfer. Bull. Chem. Soc. Jpn 1995, 68, 696–712. [Google Scholar]
- (16).Momicchioli F; Baraldi I; Berthier G Theoretical Study of Trans-Cis Photoisomerism in Polymethine Cyanines. Chem. Phys 1988, 123, 103–112. [Google Scholar]
- (17).Fürstenberg A; Julliard MD; Deligeorgiev TG; Gadjev NI; Vasilev AA; Vauthey E Ultrafast Excited-State Dynamics of DNA Fluorescent Intercalators: New Insight into the Fluorescence Enhancement Mechanism. J. Am. Chem. Soc 2006, 128, 7661–7669. [DOI] [PubMed] [Google Scholar]
- (18).Milanovich N; Suh M; Jankowiak R; Small GJ; Hayes JM Binding of TO-PRO-3 and TOTO-3 to DNA: Fluorescence and Hole-Burning Studies. J. Phys. Chem 1996, 100, 9181–9186. [Google Scholar]
- (19).Netzel TL; Nafisi K; Zhao M; Lenhard JR; Johnson I Base-Content Dependence of Emission Enhancements, Quantum Yields, and Lifetimes for Cyanine Dyes Bound to DoubleStrand DNA: Photophysical Properties of Monomeric and Bichromomphoric DNA Stains. J. Phys. Chem 1995, 99, 17936–17947. [Google Scholar]
- (20).Carlsson C; Larsson A; Jonsson M; Albinsson B; Norden B Optical and Photophysical Properties of the Oxazole Yellow DNA Probes YO and YOYO. J. Phys. Chem 1994, 98, 10313– 10321. [Google Scholar]
- (21).Pyle JR; Chen J Photobleaching of YOYO-1 in Super-Resolution Single DNA Fluorescence Imaging. Beilstein J. Nanotechnol 2017, 8, 2296. [DOI] [PMC free article] [PubMed] [Google Scholar]
- (22).Rye HS; Yue S; Wemmer DE; Quesada MA; Haugland RP; Mathies RA; Glazer AN Stable Fluorescent Complexes of Double-Stranded DNA with Bis-Intercalating Asymmetric Cyanine Dyes: Properties and Applications. Nucleic Acids Res 1992, 20, 2803–2812. [DOI] [PMC free article] [PubMed] [Google Scholar]
- (23).Larsson A; Carlsson C; Jonsson M; Albinsson B Characterization of the Binding of the Fluorescent Dyes YO and YOYO to DNA by Polarized Light Spectroscopy. J. Am. Chem. Soc 1994, 116, 8459–8465. [Google Scholar]
- (24).Sabnis RW YOYO 1. In Handbook of Fluorescent Dyes and Probes; John Wiley & Sons, Inc, 2015; pp. 421–424. [Google Scholar]
- (25).Selvin P Science Innovation ‘92: The San Francisco Sequel. Science 1992, 257, 885–886. [DOI] [PubMed] [Google Scholar]
- (26).Sundström V; Gillbro T Viscosity Dependent Radiationless Relaxation Rate of Cyanine Dyes. A Picosecond Laser Spectroscopy Study. Chem. Phys 1981, 61, 257–269. [Google Scholar]
- (27).Murphy S; Schuster GB Electronic Relaxation in a Series of Cyanine Dyes: Evidence for Electronic and Steric Control of the Rotational Rate. J. Phys. Chem 1995, 99, 8516–8518. [Google Scholar]
- (28).Åkesson E; Sundström V; Gillbro T Isomerization Dynamics in Solution Described by Kramers′ Theory with a Solvent-Dependent Activation Energy. Chem. Phys 1986, 106, 269–280. [Google Scholar]
- (29).Yang X; Zaitsev A; Sauerwein B; Murphy S; Schuster GB Penetrated Ion Pairs: Photochemistry of Cyanine Dyes within Organic Borates. J. Am. Chem. Soc 1992, 114, 793–794. [Google Scholar]
- (30).Sibbett W; Taylor J; Welford D Substituent and Environmental Effects on the Picosecond Lifetimes of the Polymethine Cyanine Dyes. IEEE J. Quantum Electron 1981, 17, 500–509. [Google Scholar]
- (31).King AW; Wang L; Rack JJ Excited State Dynamics and Isomerization in Ruthenium Sulfoxide Complexes. Acc. Chem. Res 2015, 48, 1115–1122. [DOI] [PubMed] [Google Scholar]
- (32).Berera R; van Grondelle R; Kennis JTM Ultrafast Transient Absorption Spectroscopy: Principles and Application to Photosynthetic Systems. Photosynth. Res 2009, 101, 105–118. [DOI] [PMC free article] [PubMed] [Google Scholar]
- (33).McCusker JK Femtosecond Absorption Spectroscopy of Transition Metal Charge-Transfer Complexes. Acc. Chem. Res 2003, 36, 876–887. [DOI] [PubMed] [Google Scholar]
- (34).Ohkita H; Cook S; Astuti Y; Duffy W; Tierney S; Zhang W; Heeney M; McCulloch I; Nelson J; Bradley DDC; et al. Charge Carrier Formation in Polythiophene/Fullerene Blend Films Studied by Transient Absorption Spectroscopy. J. Am. Chem. Soc 2008, 130, 3030–3042. [DOI] [PubMed] [Google Scholar]
- (35).Kaucikas M; Nürnberg D; Dorlhiac G; Rutherford AW; van Thor JJ Femtosecond Visible Transient Absorption Spectroscopy of Chlorophyll F-Containing Photosystem I. Biophys. J 2017, 112, 234–249. [DOI] [PMC free article] [PubMed] [Google Scholar]
- (36).Henkel S; Misuraca MC; Ding Y; Guitet M; Hunter CA Enhanced Chelate Cooperativity in Polar Solvents. J. Am. Chem. Soc 2017, 139, 6675–6681. [DOI] [PubMed] [Google Scholar]
- (37).Garg K; King AW; Rack JJ One Photon Yields Two Isomerizations: Large Atomic Displacements during Electronic Excited-State Dynamics in Ruthenium Sulfoxide Complexes. J. Am. Chem. Soc 2014, 136, 1856–1863. [DOI] [PubMed] [Google Scholar]
- (38).Wang L; Tamgho I-S; Crandall LA; Rack JJ; Ziegler CJ Ultrafast Dynamics of a New Class of Highly Fluorescent Boron Difluoride Dyes. Phys. Chem. Chem. Phys 2015, 17, 2349– 2351. [DOI] [PubMed] [Google Scholar]
- (39).Spectroscopy Data Analysis Software - Transient Emission. http://ultrafastsystems.com/surfacexplorer-data-analysis-software/ (accessed May 9, 2017).
- (40).Noda I Generalized Two-Dimensional Correlation Method Applicable to Infrared, Raman, and Other Types of Spectroscopy. Appl. Spectrosc 1993, 47, 1329–1336. [Google Scholar]
- (41).van Stokkum IHM; Larsen DS; van Grondelle R Global and Target Analysis of Time Resolved Spectra. Biochim. Biophys. Acta - Bioenerg 2004, 1657, 82–104. [DOI] [PubMed] [Google Scholar]
- (42).Frisch MJ; Trucks GW; Schlegel HB; Scuseria GE; Robb MA; Cheeseman JR; Scalmani G; Barone V; Mennucci B; Petersson GA; et al. Gaussian 09, Revision D. 01; Gaussian, Inc., Wallingford CT, 2013. [Google Scholar]
- (43).Andersson MP; Uvdal P New Scale Factors for Harmonic Vibrational Frequencies Using the B3LYP Density Functional Method with the Triple-ζ Basis Set 6–311+ G (d, P). J. Phys. Chem. A 2005, 109, 2937–2941. [DOI] [PubMed] [Google Scholar]
- (44).Chen J; Bremauntz A; Kisley L; Shuang B; Landes CF Super-Resolution MbPAINT for Optical Localization of Single-Stranded DNA. ACS Appl. Mater. Interfaces 2013, 5, 9338–9343. [DOI] [PMC free article] [PubMed] [Google Scholar]
- (45).Shuang B; Chen J; Kisley L; Landes CF Troika of Single Particle Tracking Programing: SNR Enhancement, Particle Identification, and Mapping. Phys. Chem. Chem. Phys 2014, 16, 624–634. [DOI] [PMC free article] [PubMed] [Google Scholar]
- (46).Kisley L; Chen J; Mansur AP; Shuang B; Kourentzi K; Poongavanam M-V; Chen WH; Dhamane S; Willson RC; Landes CF Unified Superresolution Experiments and Stochastic Theory Provide Mechanistic Insight into Protein Ion-Exchange Adsorptive Separations. Proc. Natl. Acad. Sci. U.S.A 2014, 111, 2075–2080. [DOI] [PMC free article] [PubMed] [Google Scholar]
- (47).Lord SJ; Lu Z; Wang H; Willets KA; Schuck PJ; Lee HD; Nishimura SY; Twieg RJ; Moerner WE Photophysical Properties of Acene DCDHF Fluorophores: LongWavelength Single-Molecule Emitters Designed for Cellular Imaging. J. Phys. Chem. A 2007, 111, 8934–8941. [DOI] [PMC free article] [PubMed] [Google Scholar]
- (48).Birge RR Kodak Laser Dyes. Kodak Publ. JJ-169 1987.
- (49).Noda I Two-Dimensional Infrared (2D IR) Spectroscopy: Theory and Applications. Appl. Spectrosc 1990, 44, 550–561. [Google Scholar]
- (50).Noda I Determination of Two-Dimensional Correlation Spectra Using the Hilbert Transform. Appl. Spectrosc 2000, 54, 994–999. [Google Scholar]
- (51).Hung C-C; Yabushita A; Kobayashi T; Chen P-F; Liang KS Ultrafast Relaxation Dynamics of Nitric Oxide Synthase Studied by Visible Broadband Transient Absorption Spectroscopy. Chem. Phys. Lett 2017, 683, 619–624. [Google Scholar]
- (52).Vdovic S; Wang Y; Li B; Qiu M; Wang X; Guo Q; Xia A Excited State Dynamics of β-Carotene Studied by Means of Transient Absorption Spectroscopy and Multivariate Curve Resolution Alternating Least-Squares Analysis. Phys. Chem. Chem. Phys 2013, 15, 20026–20036. [DOI] [PubMed] [Google Scholar]
- (53).Hell SW; Wichmann J Breaking the Diffraction Resolution Limit by Stimulated Emission: Stimulated-Emission-Depletion Fluorescence Microscopy. Opt. Lett 1994, 19, 780–782. [DOI] [PubMed] [Google Scholar]
- (54).Haran G; Wynne K; Xie A; He Q; Chance M; Hochstrasser RM Excited State Dynamics of Bacteriorhodopsin Revealed by Transient Stimulated Emission Spectra. Chem. Phys. Lett 1996, 261, 389–395. [Google Scholar]
- (55).Wynne K; Hochstrasser RM The Theory of Ultrafast Vibrational Spectroscopy. Chem. Phys 1995, 193, 211–236. [Google Scholar]
- (56).Son DH; Kambhampati P; Kee TW; Barbara PF Femtosecond Multicolor Pump−Probe Study of Ultrafast Electron Transfer of [(NH3)5RuIIINCRuII(CN)5]- in Aqueous Solution. J. Phys. Chem. A 2002, 106, 4591–4597. [Google Scholar]
- (57).Wohlleben W; Buckup T; Hashimoto H; Cogdell RJ; Herek JL; Motzkus M Pump−Deplete−Probe Spectroscopy and the Puzzle of Carotenoid Dark States. J. Phys. Chem. B 2004, 108, 3320–3325. [Google Scholar]
- (58).Rey R; Møller KB; Hynes JT Hydrogen Bond Dynamics in Water and Ultrafast Infrared Spectroscopy. J. Phys. Chem. A 2002, 106, 11993–11996. [DOI] [PubMed] [Google Scholar]
- (59).Wong DB; Sokolowsky KP; El-Barghouthi MI; Fenn EE; Giammanco CH; Sturlaugson AL; Fayer MD Water Dynamics in Water/DMSO Binary Mixtures. J. Phys. Chem. B 2012, 116, 5479–5490. [DOI] [PubMed] [Google Scholar]
- (60).Bian H; Chen H; Zhang Q; Li J; Wen X; Zhuang W; Zheng J Cation Effects on Rotational Dynamics of Anions and Water Molecules in Alkali (Li+, Na+, K+, Cs+) Thiocyanate (SCN–) Aqueous Solutions. J. Phys. Chem. B 2013, 117, 7972–7984. [DOI] [PubMed] [Google Scholar]
- (61).Liu J-Y; Fan W-H; Han K-L; Deng W-Q; Xu D-L; Lou N-Q Ultrafast Vibrational and Thermal Relaxation of Dye Molecules in Solutions. J. Phys. Chem. A 2003, 107, 10857–10861. [Google Scholar]
- (62).Pal SK; Zhao L; Zewail AH Water at DNA Surfaces: Ultrafast Dynamics in Minor Groove Recognition. Proc. Natl. Acad. Sci. U.S.A 2003, 100, 8113–8118. [DOI] [PMC free article] [PubMed] [Google Scholar]
- (63).Oster G; Nishijima Y Fluorescence and Internal Rotation: Their Dependence on Viscosity of the Medium. J. Am. Chem. Soc 1956, 78, 1581–1584. [Google Scholar]
- (64).Fürstenberg A; Deligeorgiev TG; Gadjev NI; Vasilev AA; Vauthey E Structure– Fluorescence Contrast Relationship in Cyanine DNA Intercalators: Toward Rational Dye Design. Chem. – A Eur. J 2007, 13, 8600–8609. [DOI] [PubMed] [Google Scholar]
- (65).Zhao G-J; Han K-L Hydrogen Bonding in the Electronic Excited State. Acc. Chem. Res 2012, 45, 404–413. [DOI] [PubMed] [Google Scholar]
- (66).Sun L; Burkitt M; Tamm M; Raymond MK; Abrahamsson M; LeGourriérec D; Frapart Y; Magnuson A; Kenéz PH; Brandt P Hydrogen-Bond Promoted Intramolecular Electron Transfer to Photogenerated Ru (III): A Functional Mimic of Tyrosinez and Histidine 190 in Photosystem II. J. Am. Chem. Soc 1999, 121, 6834–6842. [Google Scholar]
- (67).Peng X; Song F; Lu E; Wang Y; Zhou W; Fan J; Gao Y Heptamethine Cyanine Dyes with a Large Stokes Shift and Strong Fluorescence: A Paradigm for Excited-State Intramolecular Charge Transfer. J. Am. Chem. Soc 2005, 127, 4170–4171. [DOI] [PubMed] [Google Scholar]
- (68).Lewis NS; Nocera DG Powering the Planet: Chemical Challenges in Solar Energy Utilization. Proc. Natl. Acad. Sci. U.S.A 2006, 103, 15729–15735. [DOI] [PMC free article] [PubMed] [Google Scholar]
- (69).Zaleski JM; Chang CK; Leroi GE; Cukier RI; Nocera DG Role of Solvent Dynamics in the Charge Recombination of a Donor/Acceptor Pair. J. Am. Chem. Soc 1992, 114, 3564–3565. [Google Scholar]
- (70).Petersen PB; Roberts ST; Ramasesha K; Nocera DG; Tokmakoff A Ultrafast N−H Vibrational Dynamics of Cyclic Doubly Hydrogen-Bonded Homo- and Heterodimers. J. Phys. Chem. B 2008, 112, 13167–13171. [DOI] [PMC free article] [PubMed] [Google Scholar]
- (71).Olaya AJ; Brevet P-F; Smirnov EA; Girault HH Ultrafast Population Dynamics of Surface-Active Dyes during Electrochemically Controlled Ion Transfer across a Liquid|Liquid Interface. J. Phys. Chem. C 2014, 118, 25027–25031. [Google Scholar]
- (72).Ulrich G; Ziessel R; Harriman A The Chemistry of Fluorescent Bodipy Dyes: Versatility Unsurpassed. Angew. Chem. Int. Ed. (English) 2008, 47, 1184–1201. [DOI] [PubMed] [Google Scholar]
- (73).Picraux LB; Smeigh AL; Guo D; McCusker JK Intramolecular Energy Transfer Involving Heisenberg Spin-Coupled Dinuclear Iron−Oxo Complexes. Inorg. Chem 2005, 44, 7846–7859. [DOI] [PubMed] [Google Scholar]
- (74).Dexter DL A Theory of Sensitized Luminescence in Solids. J. Chem. Phys 1953, 21, 836–850. [Google Scholar]
- (75).Shimizu M; Sasaki S; Kinjo M Triplet Fraction Buildup Effect of the DNA–YOYO Complex Studied with Fluorescence Correlation Spectroscopy. Anal. Biochem 2007, 366, 87–92. [DOI] [PubMed] [Google Scholar]
- (76).B., S. G.; A., K. B.; D., M. B.; Margherita G The Triplet‐state Lifetime of Indole Derivatives in Aqueous Solution¶. Photochem. Photobiol 2007, 80, 462–470. [DOI] [PubMed] [Google Scholar]
- (77).Ha T; Tinnefeld P Photophysics of Fluorescent Probes for Single-Molecule Biophysics and Super-Resolution Imaging. Annu. Rev. Phys. Chem 2012, 63, 595–617. [DOI] [PMC free article] [PubMed] [Google Scholar]
Associated Data
This section collects any data citations, data availability statements, or supplementary materials included in this article.