Abstract
N6-methyladenosine (m6A) is an abundant internal RNA modification in both coding1 and non-coding RNAs2,3, catalysed by the METTL3/METTL14 methyltransferase complex4. Here we define a novel pathway specific for METTL3, implicated in the maintenance of the leukaemic state. We identify METTL3 as an essential gene for growth of acute myeloid leukaemia (AML) cells in two distinct genetic screens. Down-regulation of METTL3 results in cell cycle arrest, differentiation of leukaemic cells and failure to establish leukaemia in immunodeficient mice. We show that METTL3, independently of METTL14, associates with chromatin and localizes to transcriptional start site (TSS) of active genes. The vast majority of these genes have the CAATT-box binding protein CEBPZ present at the TSS5, which is required for recruitment of METTL3 to chromatin. Promoter bound METTL3 induces m6A modification within the coding region of the associated mRNA transcript, and enhances its translation by relieving ribosome stalling. We show that genes regulated by METTL3 in this way are necessary for AML. Together, these data define METTL3 as a regulator of a novel chromatin-based pathway necessary for maintenance of the leukaemic state and identify this enzyme as a novel therapeutic target for AML.
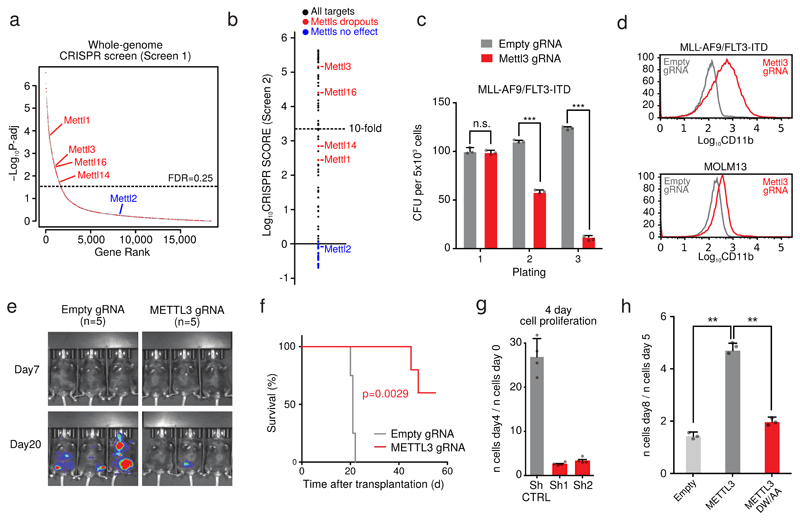
To identify RNA modifying enzymes necessary for survival and proliferation of AML cells, we performed two independent CRISPR screens. Firstly, we performed an ex vivo genome wide CRISPR dropout screen (Screen 1) using Cas9-expressing mouse primary leukaemia cells driven by an MLL-AF9 fusion gene and a FLT3 internal tandem duplication6 (Fig. 1a). This identified 1550 dropout targets with a false discovery rate (FDR) of 0.25 (Supplementary Table 1), including 75 genes encoding possible RNA modifying enzymes whose expression is necessary for growth of primary leukaemia cells (see Methods; Supplementary Table 2).
Figure 1. METTL3 is essential for AML cells both in vivo and in vitro.
a) Dropout p-values of the genome-wide screen in MLL-AF9/FLT-ITD cells are displayed. Discontinuous blue line shows the 25%FDR threshold. RNA enzymes are shown as red dots. b) CRISPR score for the 75 RNA enzymes (black circles) or the METTL family members (red/blue) as controls in AML-AF9 RN2C cells. c) Colony forming assay of MLL-AF9/FLT3-ITD-Cas9 cells targeted for Mettl3 (catalytic domain-specific) or CTRL showing decreased replating ability. Mean+S.D. of three independent replicates is shown; CFU: colony forming units. (***p< 0.001; t-test). d) CD11b expression in METTL3 (catalytic domain-specific) targeted cells (MLL-AF9/FLT-ITD mouse cells and MOLM13 human cells) was measured by flow cytometry 8 days (mouse) and 6 days (human) after infection. e) Bioluminescence imaging of mice transplanted with luciferase-expressing MOLM13 cells transduced with the indicated gRNAs. f) Kaplan-Meier plot showing the survival time of mice from Fig. 1e. A log rank test was performed. g) Proliferation assay of METTL3 KD or CTRL cells measured between day 4 and day 8 after tetracycline induction. Mean+S.D. of three independent replicates is shown. h) Proliferation assay of MPN1c/Flt3ltd/+/Rosa26Cas9/+ mouse Leukaemia cells transduced with gRNA targeting the catalytic domain of METTL3 and plasmids expressing wild type METTL3 or a catalytically inactive mutant. Mean+S.D. of three independent replicates is shown. (**p< 0.01; t-test).
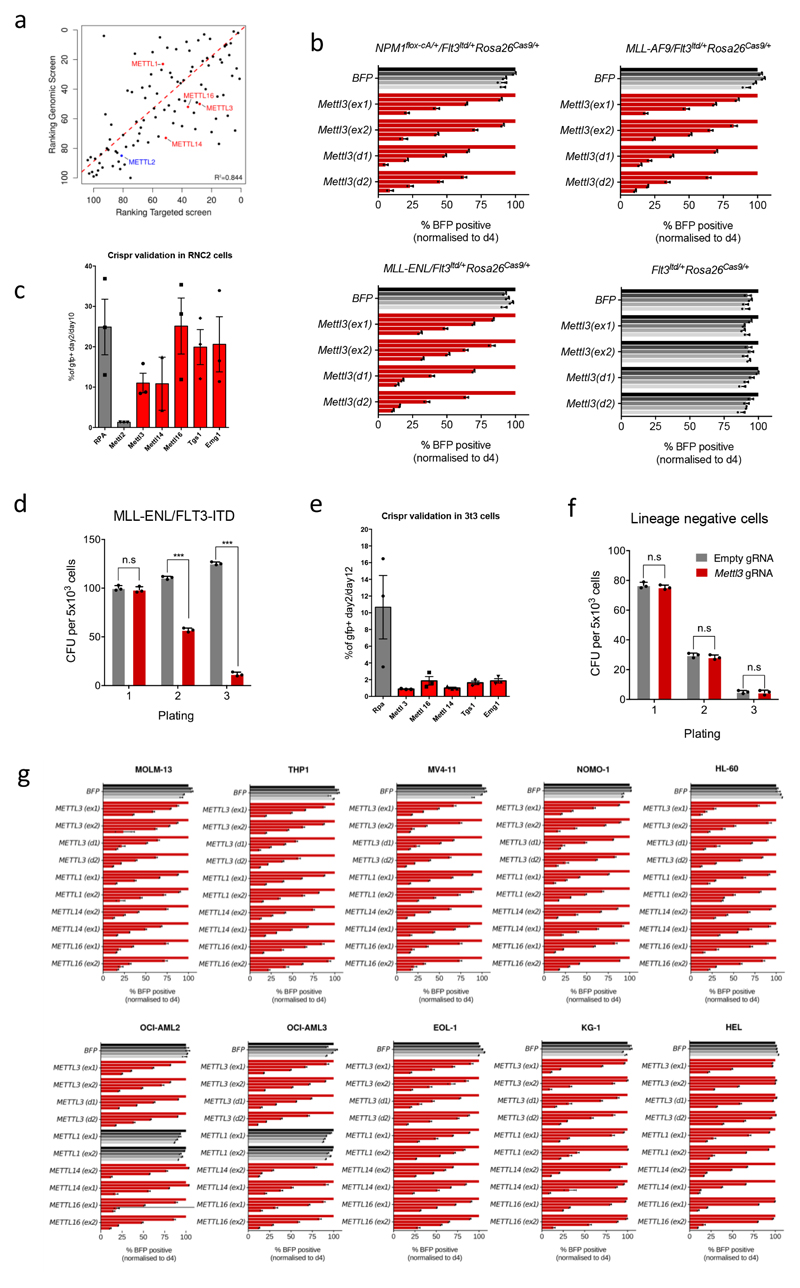
Cas9-induced indel mutations induce stronger negative selection in dropout screens when critical functional domains are targeted7. Therefore, we constructed a custom domain-focused gRNA library including the 75 RNA modifying enzymes identified above (Screen 2). This identified 46 high-confidence potential RNA modifying enzymes whose catalytic activity is required for leukaemia cell growth (Fig. 1b and Supplementary Table 2). Despite showing high overall correlation, comparison between the two screens highlights targets whose catalytic activity is specifically required for leukaemia cell growth (Extended Data Fig. 1a).
Two Mettl family members, Mettl3 and Mettl16, scored very highly, whilst Mettl14 and Mettl1 showed significant but lower negative selection. METTL3 and METTL14 form a complex that catalyses RNA adenosine N6-methylation (m6A)4. METTL16 is also an m6A methyltransferase8. This modification is present in mRNAs1, pre-miRNA2 and long non-coding RNAs3, and it affects mRNA stability9,10 and translation11. Interestingly, an m6A demethylase, FTO, which is required for human leukaemia cell growth12 was not identified in our Screen 1, which may be explained by the heterogeneous genetic background of human AML cell lines.
We validated our results using growth competition assays with individual gRNAs targeting the catalytic domain of Mettl3 and Mettl16 (like in Screen 2) in mouse AML cells (Extended Data Fig. 1b). Furthermore, negative selection of gRNAs targeting either early exons (like Screen 1) or the catalytic domain of METTL3 was validated in different mouse primary leukaemia cell lines (Extended Data Fig. 1c). Finally, disruption of Mettl3's catalytic domain strongly suppresses primary murine AML cell colony formation (Fig. 1c and Extended Data Fig. 1d). In contrast, targeting Mettl3 in non-transformed NIH3T3 and primary haematopoietic cells had no significant effect (Extended Data Fig. 1e and 1f). Our findings indicate that these genes are specifically essential for AML cell survival and not for general cellular viability.
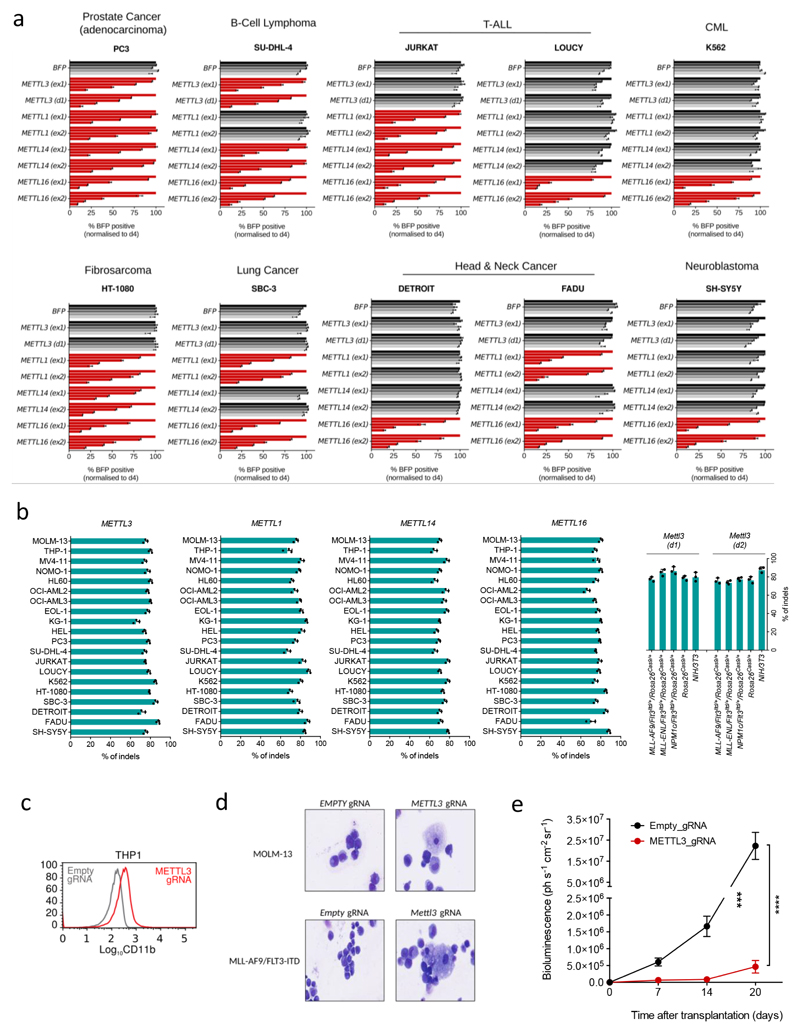
We next targeted METTLs 1, 3, 14 and 16 in ten different human AML cell lines and 10 cell lines from heterogeneous cancer types. All four METTLs show negative selection in all AML cell lines tested (Extended Data Fig. 1g), but display varying degrees of negative selection in non-AML tumours (Extended Data Fig. 2a). These differences are not due to variable editing levels across cell lines (Extended Data Fig. 2b).
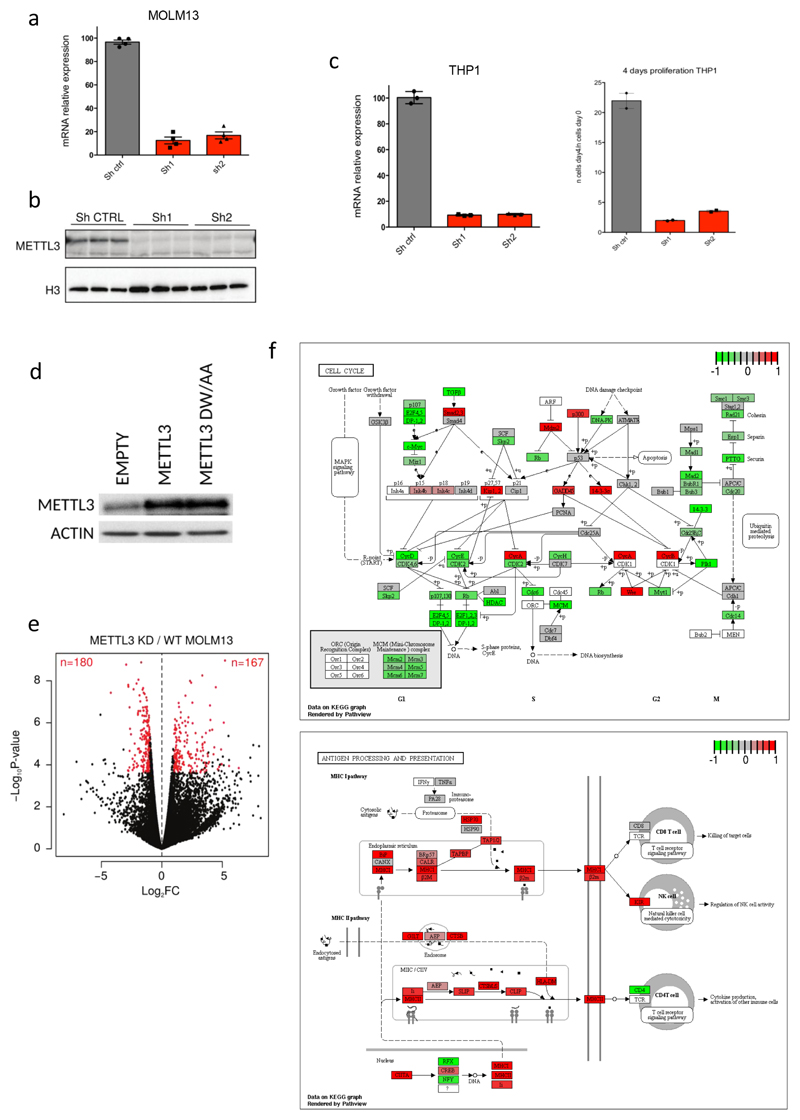
METTL3 disruption reverses the myeloid differentiation block characteristic of AML, in both mouse and human AML cells (Fig. 1d and Extended Data Fig. 2c and d). Increased expression of CD11b, a granulocytic differentiation marker13, occurred in all METTL3-domain-knockout (KO) cells analysed, consistent with METTL3 loss promoting AML cell differentiation. Strikingly, targeting METTL3's methyltransferase domain markedly impairs human leukaemic cell engraftment into immunocompromised mice (Fig. 1e and Extended Data Fig. 2e), with animals surviving significantly longer than controls (Fig. 1f). An independent genetic approach, using human MOLM13 cells harbouring inducible METTL3-specific shRNAs, was used to validate our findings. These cells showed near-complete loss of METTL3 mRNA and protein upon tetracycline induction of shRNAs (Extended Data Fig. 3a and b) and markedly reduced proliferation (Fig. 1g). Similar results were obtained using human AML cell line THP1 (Extended Data Fig. 3c). Importantly, ectopic expression of METTL3 (Extended Data Fig. 3d) fully rescued the proliferation defect, whilst a catalytically inactive mutant failed to do so (Fig. 1h), confirming that loss of growth was due to lack of METTL3's catalytic activity.
RNA-seq of METTL3 knock-down (KD) cells showed altered expression of transcripts, both upregulated (n=167) and downregulated (n=180; Extended Data Fig. 3e and Supplementary Table 3). Gene ontology analysis of differentially expressed genes revealed down-regulation of cell cycle and up-regulation of haematopoietic cell differentiation pathways, mirroring our findings obtained using CRISPR-Cas9 and flow cytometry analyses (Extended Data Fig. 3f and Supplementary Table 4). These data demonstrate that METTL3 is required for leukaemic cell growth and that its inactivation induces differentiation of MLL-AF9-driven AML cells.
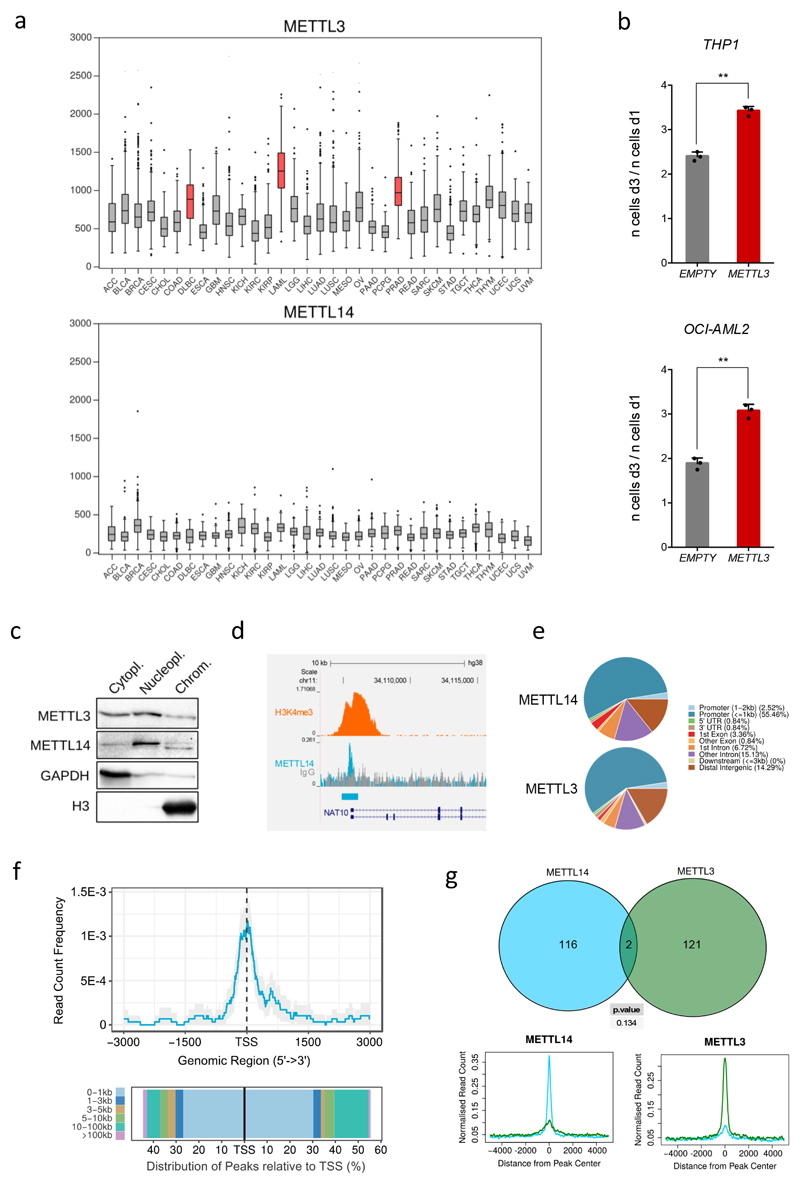
Next we interrogated METTL3 expression levels across different cancer samples from the TCGA dataset14. Interestingly, highest expression of METTL3 (but not METTL14) was identified in AML cells, diffuse large B-cell lymphoma and prostate adenocarcinoma cells (Extended Data Fig. 4a). Strikingly, these three cancer types correspond to the cell lines sensitive to METTL3 targeting (Extended Data Fig. 1g and 2a). Furthermore, METTL3 over-expression in human AML cell lines increases their proliferation (Extended Data Fig. 4b). These observations are consistent with METTL3 playing an oncogenic role in AML.
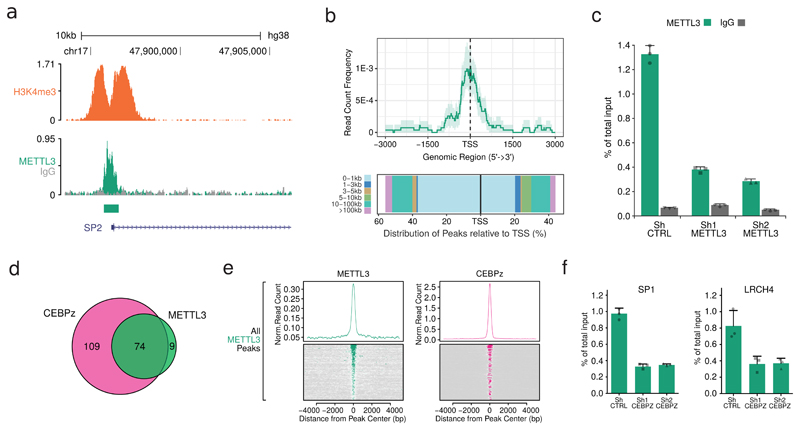
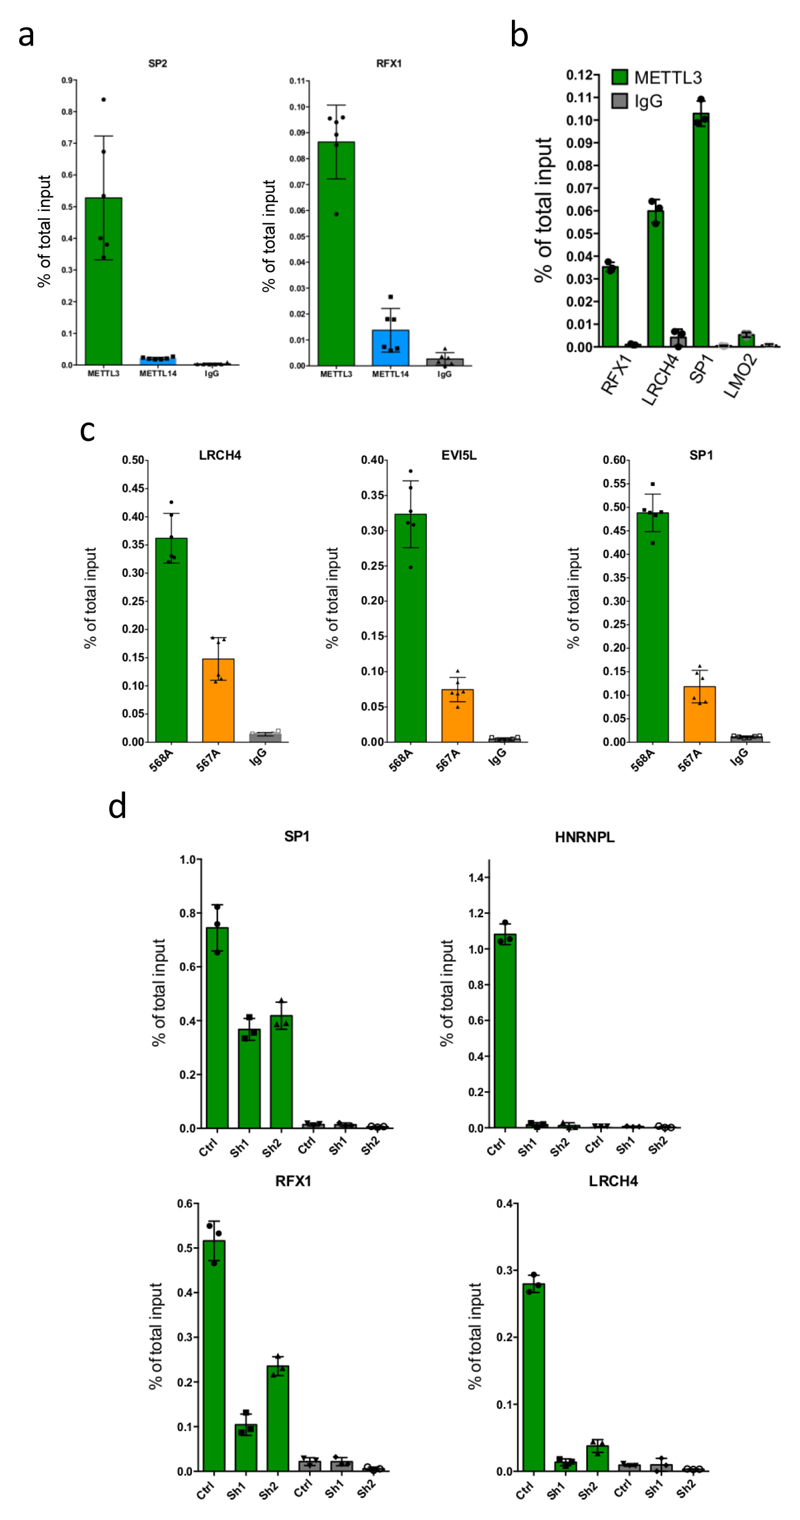
We previously described that cytoplasmic signalling enzymes can directly regulate genes by binding chromatin15. We therefore tested whether METTL3 binds chromatin. We detected both METTL3 and its partner METTL14 associated with chromatin fractions from MOLM13 cells (Extended Data Fig. 4c). To identify genomic loci bound by METTL3 and/or METTL14, we performed chromatin immunoprecipitation (ChIP) using antibodies against METTL3, METTL14 and H3K4me3. This identified 126 METTL3 and 119 METTL14 genomic peaks (Fig. 2a, Extended Data Fig. 4d and Supplementary Table 5). Both METTL3 and METTL14 localized mainly to TSSs of coding genes characterized by bimodal H3K4me3 peaks (e.g. Fig. 2a, b and Extended Data Fig. 4e and f). Surprisingly, the two METTLs did not bind the same TSSs (Extended Data Fig. 4g and 5a), suggesting they have distinct roles on chromatin. Here, we focus on METTL3 and its functions. We validated several METTL3 peaks using two different METTL3-specific antibodies by ChIP-qPCR (Extended Data Fig. 5b and c) and confirmed reduction of METTL3 ChIP signal at specific promoters upon METTL3 KD (Fig. 2c and Extended Data Fig. 5d).
Figure 2. METTL3 localises on specific TSSs on chromatin.
a) Genomic visualisation of METTL3 and H3K4me3 ChIP-seq dataset at the SP2 locus. b) Distribution of METTL3 ChIP-seq reads centred on TSSs (upper panel) and histogram of ChIP-seq reads distribution relative to TSSs (lower panel). c) METTL3 ChIP-seq validation by ChIP-qPCR on the SP2 TSS in CTRL or METTL3 KD MOLM13 cells, showing a specific reduction of METTL3 binding in KD cells. Mean+S.D. of three technical replicates is shown. The experiment was performed independently three times. d) Venn diagram showing the overlap between CEBPZ and METTL3 ChIP-seq peaks. e) Distribution and heatmaps of normalised ChIP-seq reads for CEBPZ centred on METTL3 peaks. f) ChIP-qPCR of METTL3 binding on target TSSs in and MOLM13 cells, expressing a control shRNA or two independent shRNAs against CEBPZ, showing a specific reduction of METTL3 binding in CEBPZ KD cells. Mean+S.D. of three technical replicates is shown. The experiment was performed independently three times.
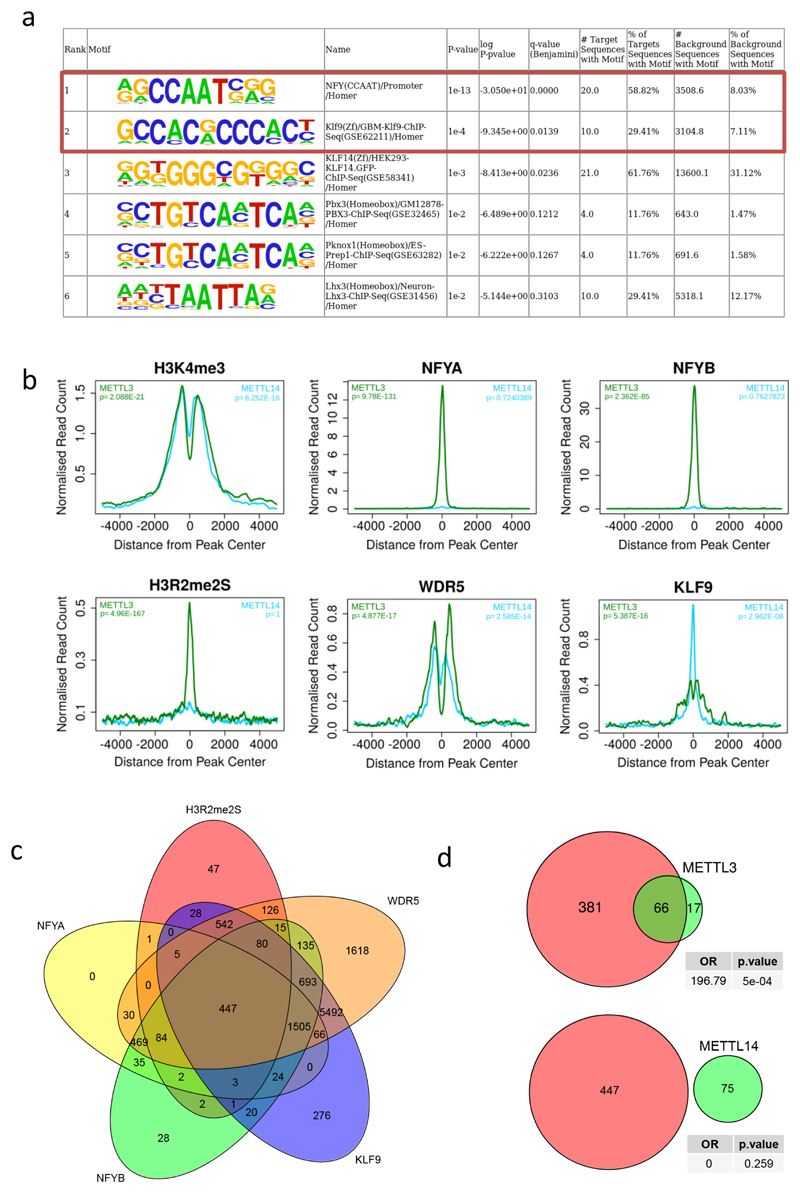
We interrogated sequences under METTL3 peaks for enriched motifs and identified the CCAAT-box as the top hit (Extended Data Fig. 6a). This motif binds the NFY complex16, which associates with H3R2me2s and WDR5 on active promoters17. Another significantly enriched METTL3 peak motif is that for transcription factor KLF9. Using existing ChIP-seq datasets5 we observed high correlation between METTL3 binding sites and all of these factors. METTL14 peaks showed no correlation with the same factors except WDR5 (Extended Data Fig. 6b). Co-occupancy by all of these factors on 447 promoters overlaps with METTL3 binding (Extended Data Fig. 6c and d), but their combined predictive power for defining METTL3 bound sites is limited.
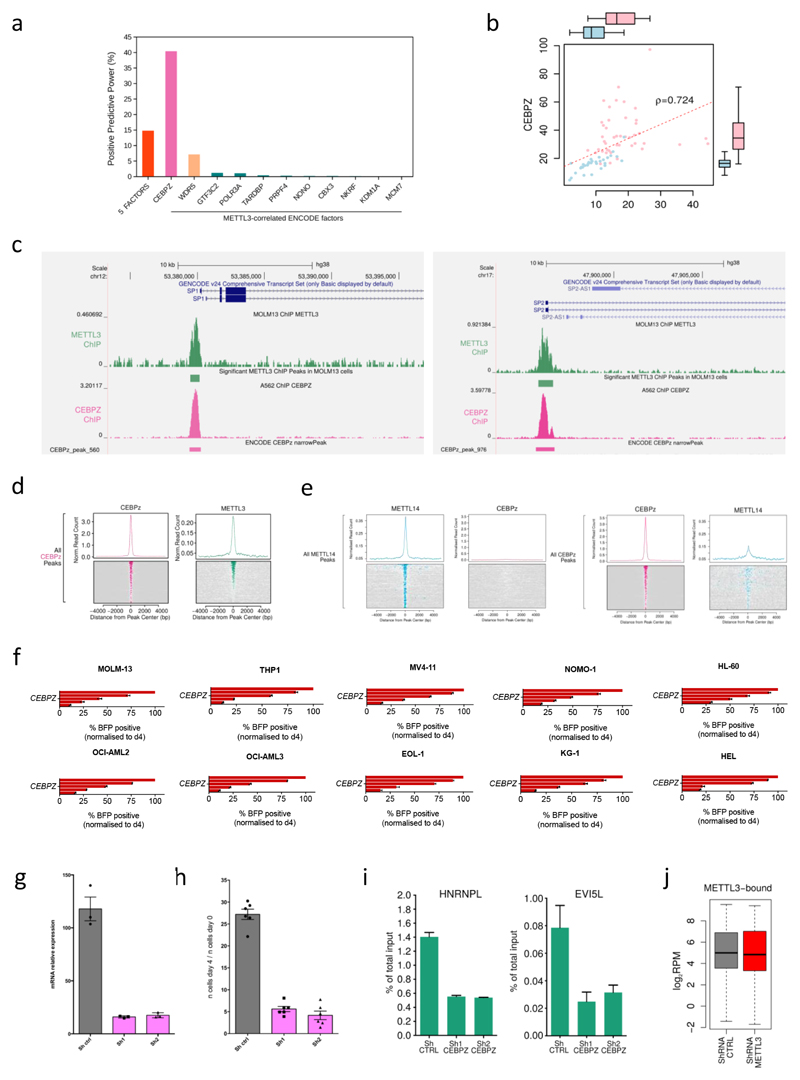
We then selected genes most tightly co-expressed with METTL3 (top 2.5 percentile) in normal and cancer cell lines18. 11 AML Encode ChIP-seq datasets are available for these co-expressed factors5, including WDR5 (Extended Data Fig. 7a). Amongst them, CEBPZ shows high co-expression (Extended Data Fig. 7b) and ChIP co-localisation with METTL3 (Fig. 2d, e and Extended Data Fig. 7c and d), but not with METTL14 (Extended Data Fig. 7e). Interestingly, CEBPZ is a CCAAT-box binding factor and is amongst the top dropouts in the genomic CRISPR-Cas9 screen (Supplementary Table 1 and Extended Data Fig. 7f). CEBPZ KD in MOLM13 cells (Extended Data Fig. 7g) impairs cell proliferation (Extended Data Fig. 7h), as shown for METTL3.
To test whether CEBPZ is involved in recruiting METTL3 to TSSs, we performed METTL3 ChIP-qPCR experiments upon CEBPZ KD. Figure 2f and Extended Data Figure 7i show reduction of chromatin-bound METTL3 at several promoters in CEBPZ KD cells. This shows for the first time that METTL3 and METTL14 are recruited to highly specific chromatin sites, with METTL3 localizing to TSSs with a well-defined signature of transcription factors and histone modifications. This suggested METTL3 regulates gene expression of mRNAs derived from its chromatin target genes.
Transcriptional profiling of METTL3-depleted cells showed that levels of mRNAs transcribed from METTL3-bound genes were not affected (Extended Data Fig. 7j and Supplementary Table 3; OR=0.75; p=1). Given that METTL3's catalytic activity is essential for AML cell growth (Fig. 1h), we investigated post-transcriptional events that could be regulated by METTL3-mediated RNA methylation.
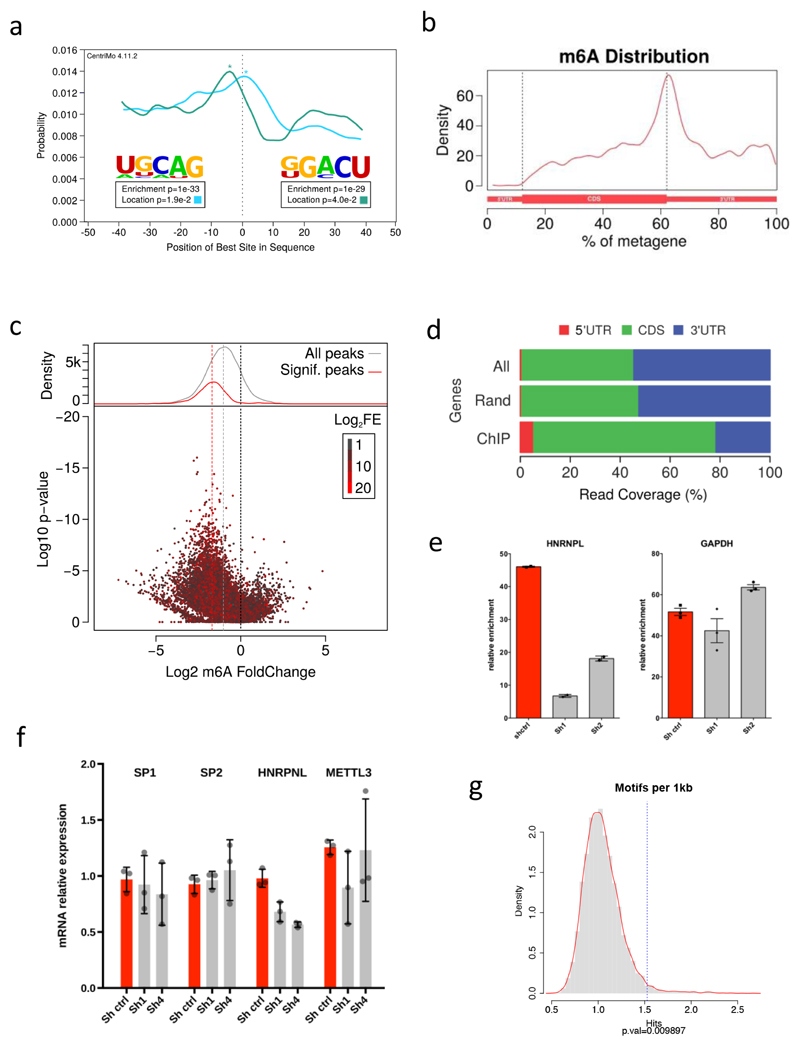
To identify RNAs methylated by METTL3 in AML, we performed RNA-immunoprecipitation linked to high throughput sequencing using an m6A-specific antibody (m6A-IP). We used RNA isolated from MOLM13 cells (CTRL) and from METTL3-depleted cells. This identified 4085 METTL3-dependent m6A peaks on poly-A+ enriched RNA (Supplementary Table 6, Extended Data Fig. 8a and b). As expected, we observed widespread reduction of m6A upon METTL3 KD (Extended Data Fig. 8c).
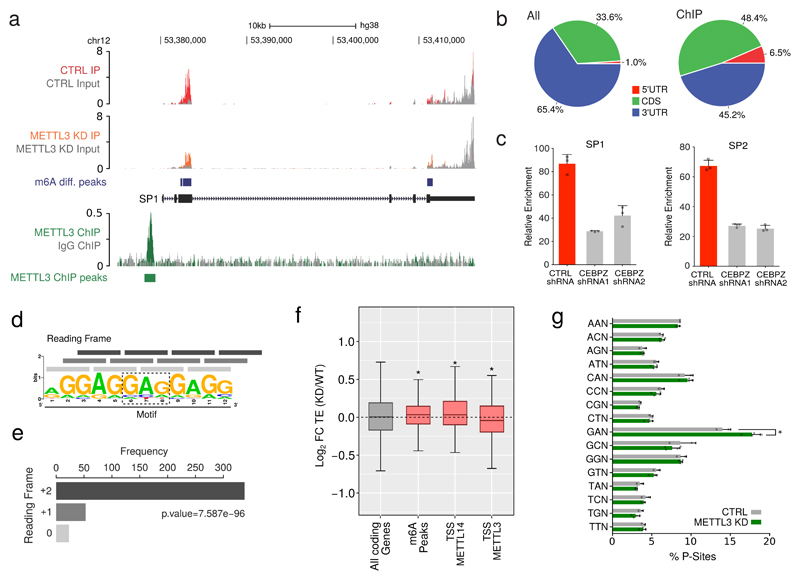
We then considered the distribution of m6A in transcripts derived specifically from METTL3-bound genes, 72.4% of which contained m6A peaks, compared to 38.4% of all transcripts (OR=4.2; p=5e-04). The m6A levels on mRNA encoding transcription factor SP1 are shown as an example (Fig. 3a). The majority of METTL3-dependent m6A occurs within the coding region of transcripts of METTL3-bound genes, in contrast to its distribution in the general transcriptome, where it is enriched within mRNA 3’UTRs (Fig. 3b and Extended Data Fig. 8d).
Figure 3. Transcripts derived from METTL3-bound promoters harbour m6A whithin their CDS.
a) Genomic visualisation of the m6A-IP normalised signal in METTL3 KD or CTRL MOLM13 cells on the SP1 transcript (upper tracks), along with the genomic visualisation of the METTL3 ChIP-seq. b) Pie charts of the distribution of METTL3-dependent m6A peaks within the whole transcriptome or METTL3 chromatin targets mRNAs. c) m6A-IP followed by qPCR for M6A peaks of SP1, SP2 and HNRNPL or GAPDH as a control. The plot show the m6A-IP signal over total input in MOLM 13 cells expressing a control shRNA or shRNAs targeting CEBPZ. Mean+S.D. of three technical replicates are shown; the experiment has been performed independently twice. d) Motif enriched in mRNAs from METTL3-bound TSSs. e) Reading frame distribution of the [GAG]n motif on the transcripts produced at METTL3-bound TSSs. Significance was obtained by multinomial test. f) Box plot showing the difference in translational efficiency (TE) between METTL3 KD and CTRL cells. The distributions of log2FC(TE) for all coding genes, mRNAs harbouring METTL3-dependent m6A and mRNAs originated from METTL3-bound or METTL14-bound TSSs are shown (*p<0.05; Wilcoxon test). g) Frequency of P-site occupancy of GAN codons in METTL3 KD or CTRL MOLM13 cells (*p<0.05; t-test).
To investigate whether promoter-bound METTL3 is required for m6A modification of associated transcripts, we measured m6A modification in these mRNAs following CEBPZ KD, since this leads to loss of METTL3 at TSSs (Fig. 2f). This demonstrated reduced m6A in relevant mRNAs (Fig. 3c and Extended Data Fig. 8e). In contrast, no changes were observed in control mRNAs such as GAPDH. As expected, CEBPZ KD did not affect mRNA levels of METTL3 chromatin targets or levels of METTL3 itself (Extended Data Fig. 8f).
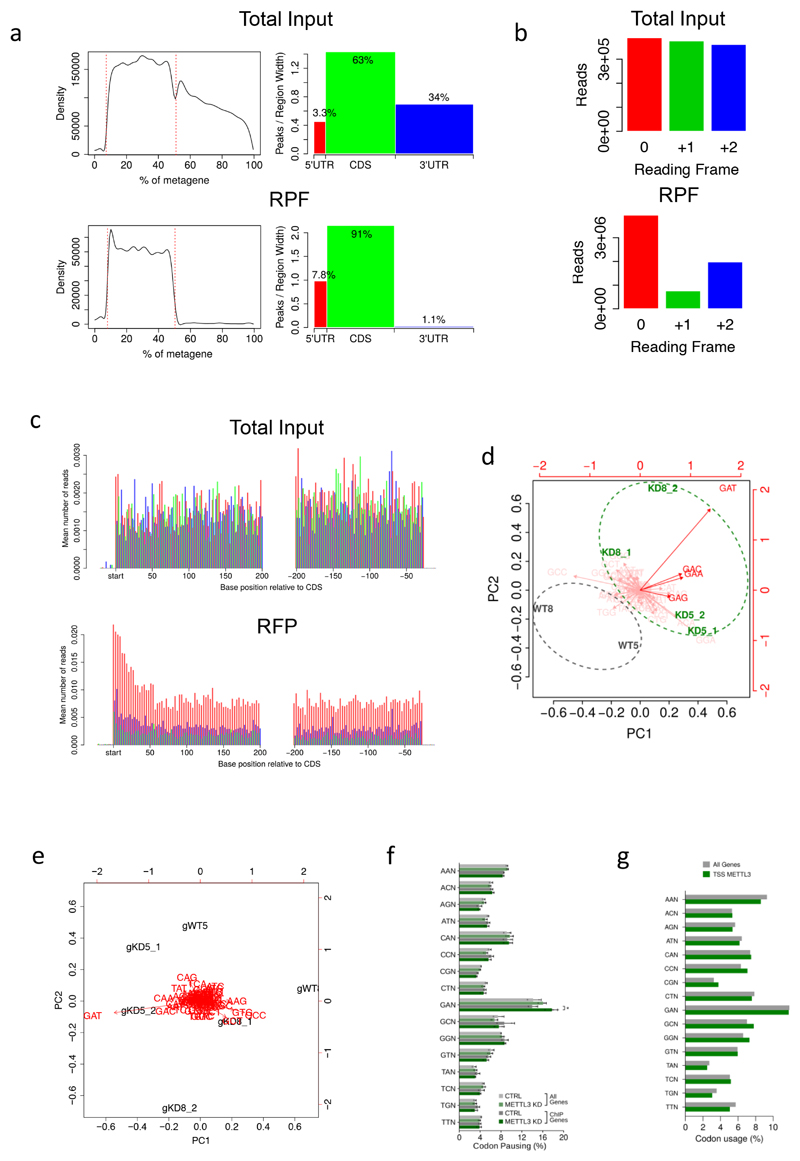
Analysis of the whole coding sequences of these transcripts revealed enrichment of a [GAG]n motif (Fig. 3d). This motif, whilst common throughout coding transcripts, is significantly over-represented amongst transcripts derived from METTL3-bound genes (Extended Data Fig. 8g). Interestingly, the motif's reading frame (+2) is preserved throughout transcripts derived from METTL3-bound genes (Fig. 3e). Although the significance of this motif remains unclear, its presence suggests these GAG rich transcripts require m6A modification for translational efficiency (TE). We therefore performed ribosome footprinting (RFP) of CTRL and METTL3 KD MOLM13 cells, to evaluate their translational output (Extended Data Fig. 9a, b and c). Intriguingly, while mRNAs marked by m6A generally tended to have an increased TE upon METTL3 KD (as seen by others19), the transcripts derived from genes harbouring METTL3 on their promoter were translated less efficiently (Fig. 3f and Supplementary Table 7). We therefore mapped ribosomal pausing sites on mRNAs produced from METTL3-bound genes. P-site codon occupancy in these transcripts indicated that four codons, GAG, GAT, GAC, GAA (GAN codons), are more occupied by ribosomes in METTL3 KD cells compared to CTRL cells (Fig. 3g and Extended Data Fig. 9d). The same was not observed as a general feature throughout the transcriptome (Extended Data Fig. 9e and f) and is not due to general over-representation of GAN codons throughout transcripts (Extended Data Fig. 9g).
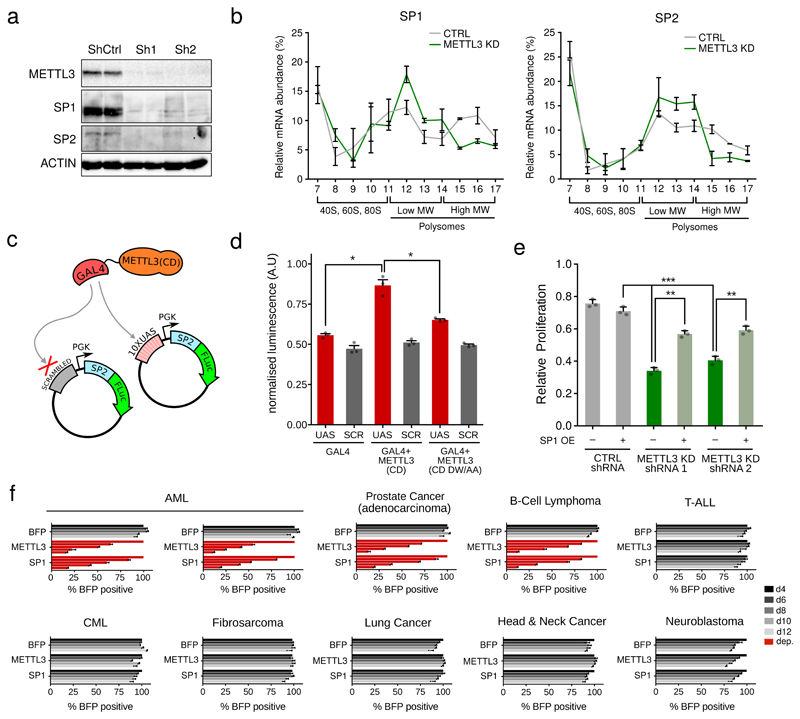
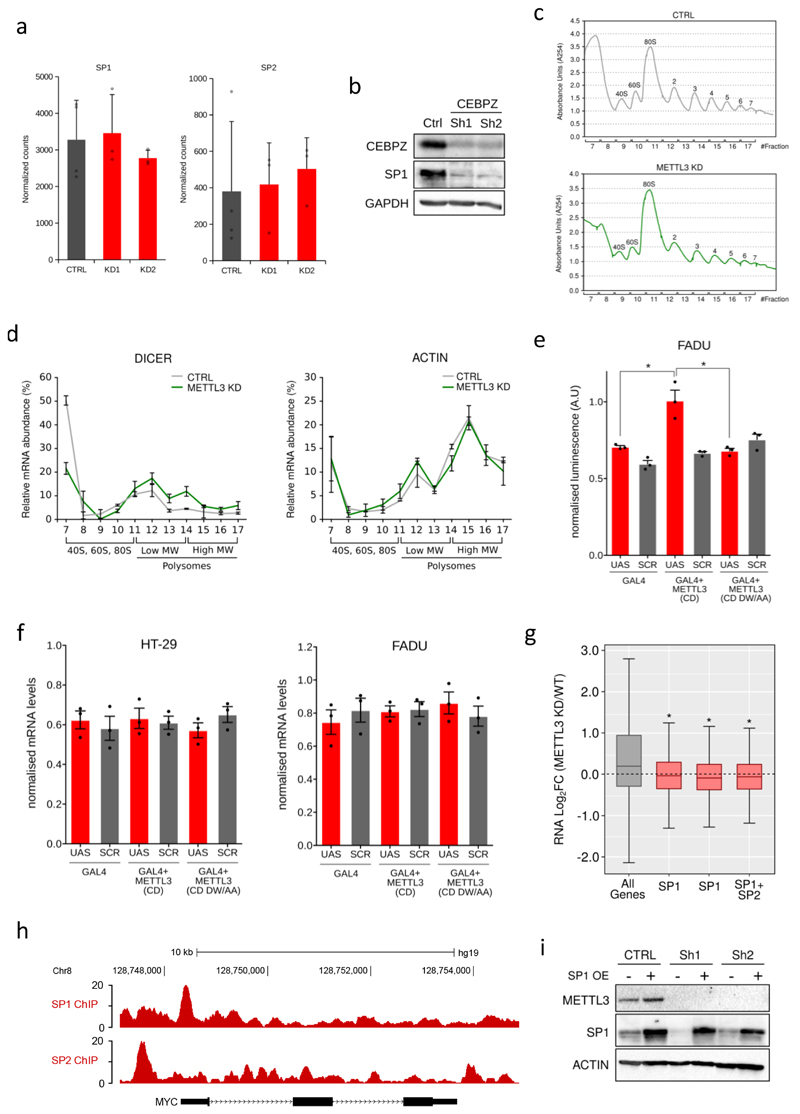
To better characterise how METTL3 regulates translation, we focused on two genes expressing the transcription factors SP1 and SP2, which have promoters occupied by METTL3. The levels of SP1 and SP2 proteins are reduced upon METTL3 depletion (Figure 4a), but their mRNA levels are unaffected (Extended Data Fig. 10a). Indeed, a similar reduction in SP1 protein levels is observed upon CEBPZ KD (Extended Data Fig. 10b). We next asked how METTL3 KD affects SP1 and SP2 mRNA association with polysomes (Extended Data Fig. 10c). Upon METTL3 depletion, there is a specific shift of SP1 and SP2 transcripts towards lower molecular weight polysomes (Figure 4b), indicating less efficient translation, whilst there are no differences for control mRNAs (Extended Data Fig. 10d).
Figure 4. Negative effect of METTL3 depletion on the translation efficiency of genes necessary for AML growth.
a) Western blot showing METTL3, SP1, SP2 and ACTIN protein levels in MOLM13 cells infected with METTL3-specific or CTRL TET-inducible shRNAs 8 days after doxycycline treatment. Two independent biological replicates are shown. For gel source data see Supplementary Information. b) SP1 and SP2 mRNAs in each ribosome fraction were quantified through qPCR and plotted as a percentage of the total. Data are from two independent polysome-profiling experiments. Mean ±SEM are shown..c) Schematic representation of the engineered reporter system. d) Firefly luciferase activity from UAS or scrambled (SCR) sequence carrying plasmid in presence of GAL4 either alone or fused with METTL3 wild type (CD) or inactive (CD DW/AA) catalytic domain (*p<0.05; t-test). The mean +S.D. of three independent transfections is shown, for two different cell lines (HT-29 and FADU) e) Proliferation assay of MOLM13 cells infected with METTL3-specific or CTRL TET-inducible shRNAs and with an SP1 expression vector between day 3 and day 6 after doxycycline treatment. Mean+S.D. of three independent replicates is shown. f) Competitive co-culture assay showing negative selection of BFP+ human tumour cell lines upon targeting of METTL3 or SP1 by CRISPR-Cas9. Results were normalized to day 4 for each gRNA. Mean+S.D. of two independent infections is shown.
The above results demonstrate that METTL3 affects translation of the mRNAs whose promoters it occupies. We next aimed to prove that recruitment of METTL3 to promoters is sufficient for this effect. For this, we used a reporter system (Fig. 4c) consisting of a plasmid harbouring GAL4 binding sites upstream of a constitutive promoter that expresses an SP2 (m6A peak)-luciferase mRNA fusion. We expressed METTL3 wild type catalytic domain, or an inactive point mutant20, in-frame with GAL4 DNA-binding domain. Consistently, only recruitment of wild type METTL3-GAL4 enhanced luciferase activity (Fig. 4d and Extended Data Fig. 10e), without affecting luciferase mRNA levels (Extended Data Fig. 10f). These data corroborate the model that promoter-bound METTL3 augments translation of its target genes.
Consistent with SP1 and SP2 protein depletion in METTL3 KD cells, genes directly bound and regulated by these factors5 were also generally down-regulated in METTL3 depleted MOLM13 cells (Extended Data Fig. 10g). Amongst these is the c-MYC oncogene, whose promoter is bound by both SP1 and SP2 (Extended Data Fig. 10h and Supplementary Table 3). We then tested whether loss of SP1 could explain the proliferation defect caused by METTL3 depletion. Figure 4e shows that ectopic over-expression of SP1 in METTL3 KD cells (Extended Data Fig. 10i) rescues cell growth. Strikingly, CRISPR targeting of SP1 is lethal in cell lines, and only in cell lines, that show sensitivity to METTL3 inactivation (Fig. 4f). These observations suggest that the sensitivity of leukaemic cells to the loss of METTL3 is dictated by the requirement of SP1 for cell growth.
Here we define a set of RNA modifying enzymes necessary for AML leukaemia and we identify a new leukaemic pathway for the METTL3 RNA methyltransferase. In this pathway, METTL3 is stably recruited by CEBPZ to promoters of a specific set of active genes, resulting in m6A methylation of the respective mRNAs and increased translation.
One important target is SP1, an oncogene in several cancers21, which regulates c-MYC expression22. Consistent with these findings, it was recently reported that METTL3 can methylate its targets co-transcriptionally23.
METTL3 affects mRNA translation in numerous ways, including by promoting RNA loading onto ribosomes24 and recruiting specific m6A reader proteins (e.g. YTHFD1)25. The findings presented here provide significant insight into the mechanisms through which METTL3 promotes post-transcriptional regulation of gene expression. They identify a new paradigm for selecting RNAs to be modified, namely the stable recruitment of the RNA modifying enzyme to specific genomic loci. They also demonstrate a new mechanism by which m6A can affect translation, namely relief of ribosome stalling at GAN codons of specific transcripts.
The new pathway described here is critical for AML leukaemia since three of its components are required for AML cell growth: (i) the m6A RNA methyltransferases METTL3, (ii) the transcription factor CEBPZ, which targets this enzyme to promoters and (iii) SP1, whose translation is dependent upon the m6A modification by METTL3. Together, these observations define METTL3 enzymatic activity as a new candidate target for the treatment of AML.
Materials and Methods (Online only)
Cell culture
MOLM13, THP-1, MV4-11, NOMO-1, HL-60, EOL-1, KG-1, RN2c, HEL, JURKAT, LOUCY, K562 cells were cultured in RPMI1640 (Invitrogen) supplemented with 10% FBS and 1% penicillin/streptomycin/glutamine. OCI-AML2 and OCI-AML3 cells were cultured in Alpha-MEM supplemented with 20% FBS and 1% penicillin/streptomycin/glutamine. 293T, mouse immortalized fibroblasts NIH-3T3, SU-DHL-4, HT1080, SBC-3, DETROIT-562, FADU, SH-SY5Y and HT-29 cells were cultured in DMEM (Invitrogen), supplemented with 10% FBS and 1% penicillin/streptomycin/glutamine. 293T, FADU and HT-29 cells were transfected using the Lipofectamine 2000 reagent (Invitrogen) according to the manufacturer instructions. All human cancer cell lines were obtained from the Sanger Institute Cancer Cell Collection and tested to be negative for mycoplasma contamination. Human cell lines employed are not listed in the cross-contaminated or misidentified cell lines database curated by the International Cell Line Authentication Committee (ICLAC).
Isolation of haematopoietic progenitors
Flt3ITD/+ mice26 were kindly provided by Gary Gilliland and crossed with Rosa26Cas9/+ mice6. Freshly isolated bone marrow from 6- to 10-week-old female Rosa26Cas9/+, Flt3ITD/+; Rosa26Cas9/+ or moribund Npm1flox−cA/+; Flt3ITD/+ mice was used. Bone marrow cells were exposed to erythrocyte lysis (BD PharmLyse, BD Bioscience), followed by magnetic bead selection of Lin- cells using the Lineage Cell Depletion Kit (Miltenyi Biotec) according to the manufacturer’s instructions. Lin- cells were cultured in X-VIVO 20 (Lonza) supplemented with 5% BIT serum substitute (Stem Cell Technologies), 10ng ml-1 IL3 (Peprotech), 10ng ml-1 IL6 (Peprotech) and 50ng ml-1 of SCF (Peprotech). Retrovirus constructs pMSCV-MLL-AF9-IRES-YFP and pMSCV-MLL-ENL-IRES-Neo were used with package plasmid psi-Eco to produce retrovirus. 293T cells (Life Technologies) were cultured and prepared for transduction in 10cm plates as described above. For virus production, 5 μg of the above plasmids and 5 μg psi-Eco packaging vector were transfected drop wise into the 293T cells using 47.5 μl TransIT LT1 (Mirus) and 600 μl Opti-MEM (Invitrogen). Transduction of primary mouse cells was performed in 6-well plates as mentioned above. After transduction, cells were sorted for YFP (for MLL-AF9) or selected with neomycin (for MLL-ENL).
Generation of genome-wide mutant libraries and screening
Ex-vivo CRISPR screens were performed using the previously reported WT Sanger genome-wide CRISPR library6, which employs 5 gRNA for each of the 18424 targeted genes. 3.0 × 10⁷ cells were infected with a pre-determined volume of the genome-wide gRNA lentiviral supernatant that gave rise to 30% transduction efficiency measured by BFP expression. Two independent infections were conducted for the murine primary AML cells. Two days after transduction, the cells were selected with puromycin at 1.5 μg ml-1.
Genomic DNA extraction and Illumina sequencing of gRNAs were conducted as described previously6. For the primary murine AML screen, 19-bp single-end sequencing was performed with the custom sequencing primer 5’-TCTTCCGATCTCTTGTGGAAAGGACGAAACACCG-3’. The number of reads for each guide was counted with an in-house script. Enrichment and depletion of guides and genes were analyzed using MAGeCK statistical package27 by comparing read counts from each cell line with counts from matching plasmid as the initial population.
The 296 RNA enzyme list which has been interrogated for dropouts was compiled as follows: 171 SAM-binding proteins without known histone methyltransferase activity; 65 ATP-dependent helicases with reported RNA interaction in at least 3 out of 4 CLIP datasets28–31; 12 Pseudouridylases; 48 annotated RNA enzymes not included in the previous lists (Supplementary Table 2)
Lentiviral vectors production and infection
For virus production 293T cells were transfected with the appropriate Lentiviral vector (PLKO.1 for shRNA, LRG and LentiCRISPR-v2 for CRISPR-Cas9) together with the packaging plasmids PAX2 and VSVg at a 1:1.5:0.5 ratio. Supernatant was harvested 48 and 72 hours after transfection.
1x10⁶ cells and viral supernatant were mixed in 2 ml of culture medium supplemented with 8 μg ml-1 (human) or 4 μg ml-1 (mouse) polybrene (Millipore), followed by spinfection (60 min, 900 g, 32 °C) and further incubated overnight at 37 °C. The medium was refreshed on the following day and the transduced cells were cultured further.
Pooled domain-focused CRISPR gRNA construction
For the RNA enzyme domain-focused CRISPR screen, 5 gRNAs were designed to target the catalytic domain of each protein based on the NCBI database annotation. gRNAs were synthesized in a pooled format on an array platform (Twist Bioscience) and PCR-cloned into a lentiviral gRNA expression vector (LRG, Addgene: #65656). To check the representation and identity of individual gRNAs within the lentiviral pool, a deep-sequence analysis was performed. This confirmed that 100% of the designed gRNAs were cloned in the LRG vector and the abundance of >95% of the gRNA constructs was within 5-folds of the mean.
Pooled gRNA screening, Miseq library construction, and data analysis
Virus containing the domain-focused gRNA library against RNA modifying enzymes was generated as described above. A serial dilution of this virus in correlation with the GFP+ cell population was used to estimate the viral titer multiplicity of infection (MOI). In the initial infected cell population, the total number of RN2c cells corresponded to an approximately one thousand-fold representation of each gRNA. To ensure that a single gRNA was transduced per cell, the viral volume for infection corresponded to an MOI of 0.4~0.5. At 2 days post-infection, a portion of the RN2c cells was harvested and used as a reference time point. At the end point of the negative selection experiment, a portion of the RN2c cells was harvested again and saved for gRNA abundance quantification through deep sequencing analysis.
The gRNA cassette MiSeq deep sequencing library was constructed using a similar method as previously described7. Genomic DNA was extracted using QiAamp DNA mini kit (Qiagen #51304), following the manufacturer’s protocol. In order to maintain approximately one thousand-fold gRNA library representation, 25 parallel PCR reactions were performed to amplify the gRNA cassette using the 2X High Fidelity Phusion Master Mix (Thermo Scientific #F-548). PCR products were subjected to Illumina MiSeq library construction and sequencing. First, the PCR product was end repaired with T4 DNA polymerase (New England BioLabs, NEB), DNA polymerase I (NEB), and T4 polynucleotide kinase (NEB). Then, an A overhang was added to the end-repaired DNA using Klenow DNA Pol Exo- (NEB). The A-overhang DNA fragment was ligated with diversity-increased barcoded Illumina adaptors followed by seven pre-capture PCR cycles. The barcoded libraries were pooled at an equal molar ratio and subjected to massively parallel sequencing through a MiSeq instrument (Illumina) using paired-end 150-bp sequencing (MiSeq Reagent Kit v2; Illumina MS-102-2002).
The sequence data were de-barcoded and trimmed to contain only the gRNA sequence, and subsequently mapped to the reference gRNA library without allowing any mismatches. The read counts were calculated for each individual gRNA. To calculate the relative abundance of each gRNA, the read counts of each gRNA were divided by the total read counts of the pooled gRNA library.
Validation of the Catalytic domain-specific screen
RN2C cells or NIH3t3 mouse fibroblast cells were infected with LRG lentiviral vectors expressing GFP and a single gRNA targeting the catalytic domain of the indicated RNA enzymes and controls. The % of GFP+ cells was measured at day 2 after infection as a baseline by flow cytometry. The % of GFP+ cells was measured again at day 10 and day 12 for RN2C or NIH3T3 cells, respectively. Three gRNAs from Screen 2 were used for each target and one gRNA for the rosa26 locus as a negative control. The gRNA sequences are listed in the supplementary material table. The data were analysed using Flowjo software.
gRNA competition
gRNA competition assays were performed using single and dual gRNA vectors as described previously2. For the validation of individual target genes, one gRNA was derived from the CRISPR library used in the screens and another gRNA was designed using WTSI Genome Editing website (http://www.sanger.ac.uk/htgt/wge/). Viral supernatants were collected 48 h after transfection. All transfections and viral collections were performed in 24-well plates and transduction was performed as mentioned above. For gRNA/BFP competition assays, flow cytometry analysis was performed on 96-well plates using a LSRFortessa instrument (BD). Gating was performed on live cells using forward and side scatter, before measuring of BFP+ cells. The gRNA sequences are listed in the supplementary material table.
Efficiency of genome editing in the pool of sgRNA-targeted cells was evaluated by Tracking of Indels by Decomposition (TIDE)32.
Replating Assays
For re-plating assays, 5,000 lineage negative cells and primary murine AML cells expressing Cas9 were plated in three wells of 6-well-plate of M3434 methylcellulose (Stem Cell Technologies) after infection with lentiviral vectors expressing gRNAs targeting the catalytic domain of METTL3 or empty vectors. The colonies were counted 7 days later and further 5,000 cells re-seeded and re-counted after a week until no colonies were observed (for WT) or until the 3rd replating (for primary murine AMLs).
Flow cytometry analyses of AML cells
Cas9 expressing cells were transduced with gRNA vectors targeting the catalytic domain of METTL3 or empty vectors and stained with anti-mouse CD11b PE/Cy5 (Biolegend, cat. no. 101210) and anti-human CD11b PE (eBiosciences, cat. no. 9012-0118). Data were analysed by using LSRFortessa (BD) and FlowJo.
Mouse whole-body bioluminescent imaging
For in vivo experiments, MOLM13 cells expressing Cas9 were transduced with a firefly luciferase-expressing plasmid (System Biosciences). After propagation, the cells were transduced with a lentivirus either empty or expressing Mettl3 gRNA (day 0) and selected with puromycin from day 2 to day 5. At day 5 post transduction, the cells were suspended in fresh medium without puromycin. At day 6, 1 x 10⁵ cells were transplanted into female 6-week old Rag2-/- IL2RG-/- mice by tail-vein injection. At day 14 post-transplant, the tumour burdens of the animals were detected using IVIS Lumina II (Caliper) with Living Image version 4.3.1 software (PerkinElmer). Briefly, 100 μl of 30 mg/ml D-luciferin (BioVision) was injected into the animals intraperitoneally. Ten min after injection, the animals were maintained in general anaesthesia by isoflurane and put into the IVIS chamber for imaging. The detected tumour burdens were measured and quantified by the same software. Animals were culled when the tumour burden was 108 photons per second or higher. Diseased mice welfare was assessed blindly by qualified animal technicians from the Sanger mouse facility. All animal studies were carried out in accordance with the Animals (Scientific Procedures) Act 1986, UK and approved by the Ethics Committee at the Sanger Institute. Randomisation and blinding were not applied.
Conditional Knock-Down cells generation
5*105 MOLM13 or THP1 cells were infected as described above using PLKO-TETon-Puro lentiviral vectors expressing shRNAs against the coding sequence of human METTL3, CEBPZ or a scramble control. 24 hours after spinfection the cells were replated in fresh medium containing 1 ug/ml of puromicin and kept in selection medium for 7 days. ShRNA was induced by 200 ng/ml doxycycline treatment for the indicated times. The shRNA sequences are listed in the supplementary material table.
Proliferation assays
5*104 MOLM13 or THP1 CTRL or METTL3 KD cells (4 days after doxycycline induction) were seeded in 2 ml of complete RPMI medium and counted 4 days after plating using the Countess II cell counter. For SP1 rescue experiments the number of doxycycline treated cells were normalised to their untreated counterparts.
Rescue Experiments
cDNA was obtained by reverse transcription of MOLM13 RNA with Supercript III (ThermoFisher Scientific), then SP1 full length coding sequence was amplified by PCR and cloned into pHIV-ZsGreen plasmid (Addgene #18121) by Gibson assembly (Gibson Assembly® Cloning Kit, NEB), using the HpaI site.
MOLM13 cells were transduced with the lentiviral constructs, then GFP+ cells were isolated by flow cytometry sorting after 5 days and employed in proliferation assays as descripted in the previous section.
For rescue experiments with either active or catalytically mutant METTL3, pcDNA3/Flag-METTL3 plasmid (Addgene #53739) was mutagenized at the positions D394A (GAC / GCC) and W397A (TGG / GCG) as described by Fustin et al33 with QuikChange II Site-Directed Mutagenesis Kit (Stratagene).
NPM1cFlt3Itd/+/Rosa26Cas9/+ cells were transduced with an empty or domain-specific Mettl3 gRNA lentiviral vector and selected with puromycin until day 5 post-transduction. Then cells were electroporated in Buffer R (Invitrogen) with the plasmids encoding WT METTL3, catalytically inactive METTL3 or an empty vector as a control. In each replicate 150,000 cells were electroporated with 500 ng of each plasmid and plated in triplicate at 50,000 cells per well in a 6-well plate. Electroporation was performed using the Neon Transfection System (Thermo Fisher Scientific) as previously described34. 3 days after electroporation (day 8), live cells were measured per well/condition.
METTL3 overexpression/proliferation experiments
AML cells were electroporated in Buffer R (Invitrogen) with plasmids encoding the WT METTL3 or an empty vector as a control. In each replicate 200,000 cells were electroporated with 500 ng of each plasmid and plated in triplicate at 50,000 cells per well in a 6-well plate. 2 days after electroporation (day 3), live cells were measured per well/condition.
Chromatin Immunoprecipitation
Chromatin immunoprecipitation was performed as previously described35. Firstly MOLM13 cells were cross-linked with 0.5% formaldehyde for 10 minutes. 20*106 cells were used for each immunoprecipitation with 3 μg of specific antibodies or IgG. Immunoprecipitated DNA was purified with ChIP DNA Clean & Concentrator Columns (Zymo) and either amplified for massive parallel sequencing or analysed on an ABI 7900 real-time PCR machine, Fast SybrGreen PCR mastermix according to the manufacturer’s instructions. Primer sequences are listed in the supplementary material table.
ChIP-sequencing
For the METTL3, METTL14, H3K4me3 and IgG ChIP-Seq experiment 5, 5, 2 and 3 independent biological replicates were used, respectively. Single end 50bp libraries were prepared using the Bioo Scientific NEXTflex ChIP-Seq kit following manufacturer's recommendations. Reads were sequenced using HiSeq 1500 and multiplexed reads were split based on their barcodes using Illumina Basespace. Reads were trimmed to remove the TRUseq adapter using trim_galore (http://www.bioinformatics.babraham.ac.uk/projects/trim_galore) with parameters '-q 0 -a AGATCGGAAGAGCACACGTCTGAACTCCAGTCAC --phred33 --fastqc'. Read quality was assessed using FastQC. Ribosomal contamination was removed by first mapping the reads to hg38 rDNA sequences using bwa36 (default parameters), and removing all reads that mapped. Trimmed non-ribosomal reads were mapped to the hg38 genome using bwa with parameters '-n 3 -k 2 -R 300 -t 4'. Multiple reads mapping to a single genomic locus were treated as PCR duplicates, and were removed using samtools rmdup37. Mapped reads were filtered to remove reads mapping to more than one unique genomic locus (multihits) by keeping only reads with flag XT:A:U in the output bam file from bwa. Reads were further filtered to remove those with mapping quality less than 20 using samtools. Genome coverage bedgraph files were generated using genomeCoverageBed from the bedtools38 suite of tools. Coverage files were converted to bigwig format using bedGraphToBigWig. Peaks were called against input sample using MACS2 using default parameters39. Peaks from all replicates were merged to give a master list of potential binding loci per condition, and read count (normalised by overall read depth of the library) for each replicate was calculated using the GenomicRanges package in R40. Peaks were treated as potential binding loci if all replicates showed normalised score greater than 1 and did not overlap a peak called in the IgG. Genomic annotation of ChIP peaks and reads and gene set operations were performed taking advantage of the R packages ChIPseeker41 and VennDiagram42, respectively. HOMER tool suite43 was used for DNA motif discovery coupled with the hypergeometric enrichment calculations (or binomial) to determine motif enrichment.
m6A RNA IP-sequencing
Total RNA was isolated from MOLM13 CTRL cells or METTL3KD cells (2 independent biological replicate for each shRNA) 8 days after doxycycline administration using the RNAeasy midi Kit (Quiagen). Successively polyA+ RNA was purified from 300μg of total RNA using the NEBNext® Poly(A) mRNA Magnetic Isolation Module (New England Biolabs). 500 ng of polyA+ purified RNA was used for each immunoprecipitation reaction. m6A RNA immunoprecipitation was performed using the Magna MeRIP™ m6A kit (Millipore) according with the manufacturer instructions.
Single end 50bp stranded libraries were prepared using the Bioo Scientific NEXTflex Rapid Directional RNA kit following manufacturer's recommendations. Reads were sequenced using HiSeq 4000 and multiplexed reads were split based on their barcodes using Illumina Basespace. Reads were trimmed to remove the TRUseq adapter using trim_galore with parameters: '-q 0 -a AGATCGGAAGAGCACACGTCTGAACTCCAGTCAC --phred33 --fastqc'.
Read quality was assessed using FastQC. Ribosomal contamination was removed by first mapping the reads to hg38 rDNA sequences using bwa (default parameters), and removing all reads that mapped. Trimmed non-ribosomal reads were mapped to the hg38 genome using Tophat2 with parameters '--no-coverage-search --max-multihits 300 -- report-secondary-alignments --read-mismatches 2'. Gene annotations from Ensembl v86 were used to direct transcript alignment. Mapped reads were filtered to remove those mapping to more than one unique genomic locus (multihits) by keeping only reads with flag NH:i:1 in the output bam file from Tophat. Reads were further filtered to remove the ones with mapping quality less than 20 using samtools. Genome coverage bedgraph files were generated for forward and reverse strand reads using genomeCoverageBed from the bedtools suite of tools. Coverage files were converted to bigwig format using bedGraphToBigWig. Transcript assembly was performed using cufflinks2 and a single transcript database was generated using cuffmerge44. Statistical analysis of differentially methylated peaks in CTRL and METTL3 KD cells was performed using the R package MeTDiff45. Metagene plots were generated by RNAModR package (https://github.com/mevers/RNAModR), while m6A motifs were analysed according to published protocols46. For evaluating statistical significance of [GAG]n motif enrichment, individual motif occurrences were searched throughout human transcriptome with FIMO program (MEME suite47).
Ribosome profiling
Ribosome profiling was obtained using the Illumina TruSeq® Ribo Profiler (Mammalian) kit. 5*107 MOLM13 CTRL (2 pooled independent biological replicates) or METTL3 KD cells (2 pooled independent biological replicates for each shRNA) 5 or 8 days after doxycycline induction were treated with 0.1 mg/ml of cycloheximide for 1 minute and the RPF fraction of mRNA was isolated following the manufacturer instruction. Ribosomal RNA was removed using the Illumina Ribozero Kit.
Single end 50 bp stranded libraries were prepared following manufacturer's recommendations. Reads were sequenced using HiSeq 1500 and multiplexed reads were split based on their barcodes using Illumina Basespace. Reads were trimmed to remove the TRUseq adapter using trim_galore with parameters '-q 0 -a AGATCGGAAGAGCACACGTCTGAACTCCAGTCAC --phred33 --fastqc'. Read quality was assessed using FastQC. Ribosomal contamination was removed by first mapping the reads to hg38 rDNA sequences using bwa (default parameters), and removing all reads that mapped. Trimmed non-ribosomal reads were mapped to the hg38 genome using Tophat2 with parameters '--no-coverage-search --max-multihits 300 --report-secondary-alignments --read-mismatches 2'. Gene annotations from Ensembl v86 were used to direct transcript alignment. Mapped reads were filtered to remove those mapping to more than one unique genomic locus (multihits) by keeping only reads with flag NH:i:1 in the output bam file from Tophat. Reads were further filtered to remove the ones with mapping quality less than 20 using samtools. Genome coverage bedgraph files were generated for forward and reverse strand reads using genomeCoverageBed from the bedtools suite of tools. Coverage files were converted to bigwig format using bedGraphToBigWig. Transcript assembly was performed using cufflinks and a single transcript database was generated using cuffmerge. Statistical analysis of differentially translated genes in CTRL and METTL3 KD cells was performed using the R package xtail48. In order to estimate the offset value relative to the read start required to localize the position of P-sites (in our case ~12nt, as already described in the literature), we employed the function “psite” of the plastid Python library49.
Polysome fractionation
5*107 MOLM13 CTRL (2 pooled independent biological replicates) or METTL3 KD cells (2 pooled independent biological replicates) 8 days after doxycycline induction were treated with 0.1 mg/ml of cycloheximide for 5 minutes at 37°C, then they were lysed and polysomes were fractionated on a sucrose gradient as described before50. Relative RNA abundance in each fraction was then quantified by RT-qPCR.
RNA-sequencing
Input samples from the m6A RNA IP and Riboprofiling experiments were combined to give a set of transcriptional profiling samples to treat as an RNA seq experiment (CTRL n=4, METTL3 KD n=6). Gene counts were calculated at the transcript level for the combined transcript database from cuffmerge using summarizeOverlaps from the GenomicAlignments40 package in R using a generalized linear model fit which takes into account possible batch effects of the two distinct experiments. Differential gene expression analysis was conducted using DESeq2ref.51. Differentially expressed genes were identified as those with RPKM greater than 1 for WT or KD showing differential expression greater than 2 fold (up or down) with a Benjamini and Hochberg corrected p value less than 0.05 unless stated otherwise.
Gene set enrichment analysis was performed using R package GAGE52.
Construction of the engineered translation reporter system
A DNA sequence carrying 10 GAL4 recognition motifs (or a scrambled version of the same sequence) was in vitro synthetized and cloned into pMirGlo plasmid (Promega) upstream to the constitutive PGK promoter by cutting with BglII and ligating with T4 DNA ligase (NEB). The sequence of SP2 known to harbor the m6A peak and the [GAN]n motif was amplified by PCR and subcloned in frame at the N-terminus of Firefly luciferase by Gibson assembly (Gibson Assembly® Cloning Kit, NEB), using the ApaI site.
To generate GAL4-METTL3(CD) construct, The CREB coding sequence in plasmid pcDNAI-GAL4-CREB-S133A (Addgene #46770) was swapped with METTL3 catalytic domain obtained by plasmid pcDNA3/Flag-METTL3 (Addgene #53739) using restriction enzymes XbaI and EcoRI. Wild type METTL3, was mutagenized at the positions D394A (GAC / GCC) and W397A (TGG / GCG) as described by Fustin et al33 with QuikChange II Site-Directed Mutagenesis Kit (Stratagene). Cloning primer sequences are listed in the supplementary material table.
Luciferase assay
293T cells were co-transfected with the GAL4-METTL3 construct and UAS-SP2-Luc or SCR-SP2-Luc vectors expressing the Renilla luciferase as transfection control. 24 hours after transfection the Firefly and Renilla lucipherases activities were measured using the Dual-Luciferase Reporter Assay System (Promega) on CLARIOstar microplate reader (BMG Labtech).
Alternatively, transfected cells were lysed and total RNA extracted using the Qiagen RNAeasy Mini kit according to the manufacturer instructions.
Western blotting
Western blotting was performed as previously described53. For the isolation of nuclei from the cytoplasmic fraction, cells were incubated in hypotonic buffer (20mM Tris-HCl, pH 7.4, 10mM NaCl, 3mM MgCl2,) and the cytoplasmic membranes disrupted by adding 0.5% NP40. Pelleted nuclei were successively lysed in IPH buffer (50mM Tris-HCl pH=8.0, 150mM NaCl, 5mM EDTA, 0.5% NP-40) for 10 minutes on ice. Nucleoplasmic and chromatin fractions were separated by 15 minutes centrifugation at 4°C. The chromatin fraction was resuspended and sonicated in Laemmli buffer before loading on SDS-PAGE.
RT-qPCR
Total RNA from MOLM13, THP1 or 293T cells was purified using the RNAeasy mini kit according to the manufacturer instructions. 1μg of purified total RNA was retrotranscribed using the High capacity cDNA reverse transcription kit (Applied Biosystems). The levels of specific RNAs were measured using the ABI 7900 real-time PCR machine and the Fast SybrGreen PCR mastermix according to the manufacturer’s instructions. Firefly luciferase levels were normalised on Renilla luciferase levels while METTL3 mRNA levels were normalised on β-ACTIN mRNA. For quantification of polysome fractionation and m6A-RIP experiments, probes from Universal ProbeLibrary (Roche) were used with TaqMan® Fast Advanced Master Mix (ThermoFisher). Primer sequences are listed in the Supplementary Material tables.
Antibodies
For the ChIP experiments the following antibodies were used: anti-METTL3 from Bethyl Laboratories (A301-568A), anti-METTL3 from Bethyl Laboratories (A301-567A), rabbit polyclonal anti-METTL14 from Abcam (ab98166), anti H3k4me3 from Abcam (ab8580) and IgG Isotype Control (ab171870).
Western blot experiment were performed using the following antibodies: anti-METTL3 from Bethyl Laboratories (A301-568A), anti-METTL14 from Abcam (ab98166), anti-Histone H3 from Active motif (39763), anti-WDR5 from Abcam (ab178410), anti-CEBPZ from Abcam (ab176579), anti-SP1 from Abcam (ab13370) and anti-SP2 from Abcam (ab137238), anti-ACTIN from Abcam (ab8227).
Statistical analysis
All general statistical analyses were performed using either a two-tailed Student’s t-test or a Wilcoxon test (when distributions were assessed not to be normal and homoscedastic) at a confidence interval of 95%, unless differently specified.
Availability of data and material
Raw sequencing data have been deposited in the Gene Expression Omnibus database with accession code: GSE94613 (https://www.ncbi.nlm.nih.gov/geo/query/acc.cgi?acc=GSE94613).
Extended Data
Extended Data Figure 1. Validation of CRISPR screens.
(Related to Figure 1)
a) Correlation between gene rankings from the two independent CRISPR-Cas9 screens. Goodness of fit is calculated as Pearson Correlation Coefficient. b) Average ratio of the percentage of GFP positive RN2C cells between day 2 and day 10 after infection with lentiviral vectors expressing GFP and individual gRNAs against the indicated targets. The mean +S.E.M. depletion of 3 different gRNAs against the catalytic domain of the targets is shown. gRNA targeting the Rosa26 locus was a negative control. Rpa (replication protein A) is a positive control. c) Competitive co-culture assay showing negative selection of BFP+ MOLM13 or MLL-AF9 primary mouse cells upon targeting of METTL3 by CRISPR-Cas9. Cells were transduced with lentiviruses expressing four different gRNAs targeting the 5’ exons or the catalytic domain of METTL3 and the BFP-positive fraction was compared with the non-transduced population. Results were normalized to those at day 4 for each gRNA. The mean ±S.D. of two independent infections is shown. d) Colony forming assay of MLL-ENL/FLT3-ITD Cas9-expressing cells targeting METTL3 (catalytic domain-specific) or CTRL showing decreased replating ability. CFU: colony forming units (***p< 0.001; t-test). The mean +S.D. of three independent experiments is shown. e) Average ratio of the percentage of GFP positive NIH-3T3 mouse fibroblasts between day 2 and day 12 after infection with lentiviral vectors expressing GFP and individual gRNAs against the indicated targets. The mean ±S.E.M. depletion of 3 different gRNAs against the catalytic domain of the targets is shown. Rpa (replication protein A) is a positive control. f) Colony forming assay of lineage negative haematopoietic Cas9-expressing cells targeting METTL3 (catalytic domain-specific; right panel) or CTRL. CFU: colony forming units (***p< 0.001; t-test). The mean +S.D. of three independent experiments is shown. g) Competitive co-culture assay showing negative selection of BFP+ AML cell lines upon targeting of METTL3, METTL1, METTL14 and METTL16 by CRISPR-Cas9 using two independent gRNAs for each target. Cells were transduced with lentiviruses expressing BFP and four different gRNAs targeting the 5’ exons or the catalytic domain of each target and the BFP-positive fraction was compared with the non-transduced population. Results were normalized to those at day 4 for each gRNA. The mean +S.D. of two independent infections is shown.
Extended Data Figure 2. Effects of targeting METTL factors In human cancer cell lines.
(Related to Figure 1)
a) Competitive co-culture assay showing negative selection of BFP+ human cancer cell lines upon targeting of METTL3, METTL1, METTL14 and METTL16 by CRISPR-Cas9 using two independent gRNAs for each target. The experiment was performed as described above. b) Efficiency of genome editing for gRNAs targeting METTL3, METTL1, METTL14 and METTL14 was measured across the indicated 20 human cell lines through TIDE analysis. Efficiency of targeting was also measured in mouse primary cell lines for gRNAs targeting Mettl3. c) CD11b expression in METTL3 (catalytic domain-specific) targeted cells (THP1 human cell line) was measured by flow cytometry 6 days after infection. d) Haematoxylin eosin staining of human and mouse AML cell lines infected with a control gRNA or gRNAs targeting the catalytic domain of METTL3. e) Time course quantification of luminescence from mice transplanted with luciferase-labelled MOLM13 cells targeting METTL3 using gRNAs specific for the catalytic domain or CTRL (***p < 0.001).
Extended Data Figure 3. METTL3 depletion in AML human cell lines leads to cell cycle arrest.
(Related to Figure 1)
a) METTL3 mRNA levels detected by RT-qPCR 4 days after shRNAs induction with doxycycline in MOLM13 cells. The mean ±S.E.M. of four independent cultures is shown. b) Western blot showing METTL3 and H3 levels in MOLM13 cells infected with specific or CTRL TET-inducible shRNAs 5 days after doxycycline treatment. For gel source data see Supplementary Information. c) METTL3 mRNA levels detected by RT-qPCR 4 days after shRNA induction with doxycyxline in THP1 cells (left panel). The mean ±S.E.M. of three independent cultures is shown. A proliferation assay of the cells was then performed with cell numbers measured between day 0 (4d post doxycycline) and day 4 (8d post doxycycline) (right panel). The mean ±S.D. of two independent replicates is shown. d) Western blot for METTL3 and actin in mouse AML cells. MPN1c/Flt3ltd/+/Rosa26Cas9/+ mouse AML cells were transduced with gRNAs targeting the catalytic domain of Mettl3 and plasmids expressing either wild type METTL3 or a catalytically inactive mutant (DW/AA). For gel source data see Supplementary Information. e) Volcano plots for CTRL vs METTL3 KD samples, showing the significance p-value (log10) versus. Fold Change (log2) of gene expression. Significantly upregulated and downregulated transcripts are shown in red (|logFC|>1, p<0.001, FDR<0.01). f) Graphical representation of KEGG pathways regulation showing cell cycle down-regulation (upper panel) and haematopoietic differentiation up-regulation (lower panel) as obtained by comparing RNA-seq derived from METTL3 KD and CTRL MOLM13 cells (up-regulated genes: red; down-regulated genes: green).
Extended Data Figure 4. METTL3 is overesxpressed in human AML and it is recruited on chromatin.
a) METTL3 (top panel) and METTL14 (lower panel) mRNA expression levels across cancer types from the TCGA database. b) Proliferation assay of human AML cell lines upon transduction with a vector expressing METTL3. Cell numbers were measured between day 1 and day 3 after electroporation. The mean +S.D. of three independent replicates is shown. c) Western blot for METTL3 and METTL14, GAPDH and histone H3 on cytoplasmic, nucleoplasmic and chromatin fractions from MOLM13 cells. For gel source data see Supplementary Information. d) Genomic browser screenshot of METTL14 and H3K4me3 normalised ChIP-seq datasets on the human SP2 gene locus from MOLM13 cells. e) Pie charts of genomic regions associated with METTL14 (top) and METTL3 (bottom) ChIP-seq peaks. f) Distribution of METTL14 ChIP-seq reads centred on TSSs (upper panel) and histogram of ChIP-seq reads distribution relative to TSSs (lower panel). g) Top: Venn diagram showing the overlap between METTL3 and METTL14 peak datasets (statistical significance was evaluated by a χ2-test). Bottom: Distribution of METTL3 and METTL14 ChIP-seq reads centred on METTL14 (left panel) or METTL3 (right panel) peaks.
Extended Data Figure 5. Validation of METTL3 ChIP-seq.
(Related to Figure 2)
a) ChIP-seq validation by ChIP-qPCR of METTL3 and METTL14 binding on the SP2 and RFX1 loci. The mean of six technical replicates ±S.D. is shown. The experiment was performed independently three times. b) METTL3 ChIP-seq validation by ChIP-qPCR on the indicated loci. The LMO2 promoter was used as a negative control. The mean of three technical replicates ±S.D. is shown. The experiment was performed independently three times. c) METTL3 ChIP-seq validation by ChIP-qPCR on the indicated TSSs using two independent METTL3 antibodies in MOLM13 cells. The mean of six technical replicates ±S.D. is shown. The experiment was performed independently three times. d) METTL3 ChIP-seq validation by ChIP-qPCR on the indicated TSS in CTRL or METTL3 KD MOLM13 cells, showing a specific reduction of METTL3 binding in KD cells. The mean of three technical replicates ±S.D. is shown. The experiment was performed independently three times.
Extended Data Figure 6. METTL3 colocalise with a defined set of chromatin factors.
(Related to Figure 2)
a) Motif discovery analysis of the genomic sequences under METTL3 ChIP-seq peaks using HOMER. Significance was obtained using a hypergeometric test. b) Distribution of ChIP-seq reads for the indicated factors or histone modifications, centred on METTL3 (green) and METTL14 (blue) ChIP peaks. Statistical significance of the binary overlap was evaluated by a χ2-test. c) Venn diagram showing the overlap of H3R2me2s, WDR5, KLF9, NFYA and NFYB ChIP-seq peaks after filtering for H3K4me3 promoters. d) Venn diagram showing significant overlap between METTL3 but not METTL14 peaks with the 447 loci carrying all five factors as in panel above. Statistical significance of the binary overlap was evaluated by a χ2-test.
Extended Data Figure 7. CEBPZ recruits METTL3 on chromatin.
(Related to Figure 2)
a) Histogram representing the positive predictive power of the combined 5 factors compared with the predictive power of the ENCODE factors whose expression levels are tightly correlated with METTL3 expression. b) Correlation between CEBPZ and METTL3 mRNA expression levels in the Human Protein Atlas RNA-seq datasets, including non-transformed (blue) and cancer (pink) cell lines. (ρ= Spearmann correlation coefficient). c) Genomic plot of METTL3 and CEBPZ normalised ChIP-seq datasets on the human SP1 and SP2 gene loci in MOLM13 and K562 cells, respectively. d) Distribution and heatmaps of normalised ChIP-seq reads for METTL3 centred on CEBPZ peaks. e) Distribution and heatmaps of normalised ChIP-seq reads of METTL14 and CEBPZ centred on METTL14 (left panel) and CEBPZ (right panel) peaks. f) Competitive co-culture assay showing negative selection of BFP+ AML cell lines upon targeting of CEBPZ by CRISPR-Cas9 gRNAs. Cells were transduced with lentiviruses expressing a gRNA targeting the first exon of CEBPZ and the BFP-positive fraction was compared with the non-transduced population. Results were normalized to those at day 4. The mean +S.D. of two independent infections is shown. g) CEBPZ mRNA levels detected by RT-qPCR 4 days after shRNA induction with doxycycline in MOLM13 cells. The mean ±S.D. of three independent cultures is shown.
h) A proliferation assay of the CEBPZ CTRL and KD cells was performed with cell numbers measured between day 0 (4d post doxycycline) and day 4 (8d post doxycycline). The mean ±S.D. of six independent replicates is shown. i) ChIP-qPCR of METTL3 binding on target TSSs in and MOLM13 cells, expressing a control shRNA or two independent shRNAs against CEBPZ, showing a specific reduction of METTL3 binding in CEBPZ KD cells. The mean of three technical replicates +S.D. is shown. The experiment was performed independently three times. j) Box plot representing the expression levels of METTL3 targets upon METTL3 KD from the dataset shown in Extended Data Figure 3e.
Extended Data Figure 8. Validation of the m6A RNA-IP upon METTL3 depletion.
(Related to Figure 3)
a) Motif analysis under the identified m6A-IP peaks showing enrichment of the expected UGCAG and GGACU sequences and their central distribution throughout the m6A-IP peaks, as obtained by MEME and CentriMo. b) Distribution of m6A-IP reads throughout the mRNA metatranscript, showing the expected enrichment around the STOP codon in MOML13 cells. c) Scatter plots and density plot showing the general down-regulation of m6A-IP signal upon METTL3 knock-down in MOLM13 cells. d) Histogram showing METTL3–dependent m6A-IP read coverage in mRNAs from METTL3-bound TSSs (ChIP), whole transcriptome (All) or the permutation of random sets of genes (Rand). e) m6A-IP followed by qPCR for m6A peaks of HNRNPL or GAPDH as a control. The plot show the m6A-IP signal over total input in MOLM 13 cells expressing a control shRNA or shRNAs targeting CEBPZ. Mean ±S.D. of three technical replicates are shown; the experiment has been performed independently twice. f) SP1, SP2, HNRNPL and METTL3 mRNA levels detected by RT-qPCR 8 days after doxycycline induction in MOLM13 CTRL or CEBPZ KD cells. The mean ±S.D. of three independent cultures is shown. g) Histogram showing the enrichment of the [GAG]n motif within the transcript sequences of METTL3 ChIP-targets compared with random permutations of genes.
Extended Data Figure 9. Ribosome profiling analysis.
(Related to Figure 3)
a) Distribution of ribosome profiling reads throughout the mRNA metatranscript from RNA inputs or ribosome-protected fragments (RPF) showing absence of 3’UTR specifically in the RPF dataset. b) Reading frame analysis of ribosome profiling reads from RNA inputs and RPF in MOLM13 cells showing enrichment of the 0 reading frame specifically in the RPF reads. c) Average read alignments to 5' and 3' ends of coding sequences in RNA inputs (upper panel) or RPF (lower panel) showing triplet periodicity and accumulation of reads on the start site typical of cycloheximide pre-treatment. d) Principal component analysis of P-site codon distribution on mRNAs from METTL3-bound TSSs as obtained by ribosome footprinting, 5 or 8 days after doxycycline administration, of METTL3 KD (KD5, KD8) or CTRL (WT5, WT8) MOLM 13 cells. e) Principal component analysis of P-site codon distribution on all mRNAs, as above. f) Frequency of P-site occupancy of codons in METTL3 KD or CTRL MOLM13 cells for either all coding genes or genes harbouring a METTL3 ChIP peak on their promoter (*p<0.05; t-test). g) Frequency of codons within the coding sequence of METTL3 chromatin targets compared with the general frequency throughout the coding transcripts. The plot shows no significant overrepresentation of GAN codons in the METTL3 chromatin targets.
Extended Data Figure 10. METTL3 controls the translation of SP1 and SP2.
(Related to Figure 4)
a) RNA-seq normalised counts of SP1 and SP2 mRNAs from CTRL or METTL3 KD MOLM13 cells at day 8 after doxycycline induction. Mean +S.D. of at least three biological replicates are shown; b) Western blot showing CEBPZ, SP1 and GAPDH levels in CTRL and CEBPZ KD cells. For gel source data see Supplementary Information. c) Polysome fractionation analysis. Cell extracts from CTRL or METTL3 KD cells were prepared and resolved in 5 to 50 % sucrose gradient. The absorbance at 254 was continuously measured. The peaks corresponding to free 40S and 60S subunits, 80S and polysomes are indicated. d) DICER1 and ACTIN mRNAs in each ribosome fraction were quantified through qPCR and plotted as a percentage of the total. Data are from two independent polysome-profiling experiments. Mean ±S.E.M. are shown. e) Firefly luciferase activity in FADU cell line from UAS or scrambled (SCR) sequence carrying plasmid in presence of GAL4 either alone or fused with METTL3 wild type (CD) or inactive (CD DW/AA) catalytic domain (*p<0.05; t-test). The mean +S.D. of three independent transfections is shown. f) Firefly luciferase mRNA from plasmids carrying UAS or scrambled sequence in presence of GAL4 either alone or fused with METTL3 wild type (CD) or inactive (CD DW/AA) catalytic domain, as evaluated by qPCR. The mean ±S.D. of three replicates is shown. g) Box plot showing transcriptional modulation of genes bound by SP1, SP2 or both between METTL3 KD and CTRL MOLM13 cells (*p<0.05; Wilcoxon test). h) Genomic browser screenshot of SP1 and SP2 normalised ChIP-seq dataset on the human c-MYC gene locus in K562 cells (from ENCODE). i) Western blot showing METTL3, SP1 and ACTIN protein levels in MOLM13 cells infected with METTL3-specific or CTRL TET-inducible shRNAs and with an SP1 expression vector 5 days after doxycycline treatment. For gel source data see Supplementary Information.
Supplementary Material
Acknowledgements
We thank Dr. Ka Hing Che for help generating the RNA enzyme list. The Kouzarides laboratory is supported by grants from Cancer Research UK (Grant Reference RG17001) and ERC (Project number 268569), in addition to benefiting from core support from the Wellcome Trust (Core Grant reference 092096) and Cancer Research UK (Grant Reference C6946/A14492). I.B. is funded by a Kay Kendall Leukaemia Fund project grant (Grant Reference RG88664). G.M.Z. is funded by an EMBO fellowship (ALTF907-2014). G.S.V. is funded by a Wellcome Trust Senior Fellowship in Clinical Science (Grant Reference WT095663MA) and work in his laboratory is funded by Bloodwise. C.R.V. and J.S. are funded by a translational research grant from Northwell Health.
Footnotes
Competing financial interests
T.K. is a co-founder of Abcam Plc and Storm Therapeutics Ltd, Cambridge, UK.
A.H. is an employee of Storm Therapeutics Ltd, Cambridge, UK.
Author contributions
I.B., K.T and J.S. designed, performed and validated the CRISPR screens. K.T., J.P. and E.D.B. performed the phenotypic analysis of human mouse targeted cells. I.B. and L.P. generated the conditional KD cells, performed and validated the RNA-seq, ChIP-seq, RNA-IP and riboprofiling experiments. L.P., S.C.R. and N.H. performed bioinformatic analyses of datasets. N.H. generated the expression profiles from the TCGA dataset G.M.Z. performed and analysed the polysome fractionation experiments. I.B., L.P, K.T and D.A. performed the rescue experiments and the luciferase assays. V.M. A.J.B and A.H. took part in the validation of ChIP-seq and RNA-IP experiments. I.B., K.T. and L.P. designed experiments and interpreted results. C.R.V., G.S.V., and T.K. devised and supervised the project. A.J.B., G.S.V. and T.K. wrote the manuscript with contributions from all authors.
References
- 1.Dominissini D, et al. Topology of the human and mouse m6A RNA methylomes revealed by m6A-seq. Nature. 2012;485:201–206. doi: 10.1038/nature11112. [DOI] [PubMed] [Google Scholar]
- 2.Alarcón CR, Lee H, Goodarzi H, Halberg N, Tavazoie SF. N6-methyladenosine marks primary microRNAs for processing. Nature. 2015;519:482–485. doi: 10.1038/nature14281. [DOI] [PMC free article] [PubMed] [Google Scholar]
- 3.Patil DP, et al. m6A RNA methylation promotes XIST-mediated transcriptional repression. Nature. 2016;537:369–373. doi: 10.1038/nature19342. [DOI] [PMC free article] [PubMed] [Google Scholar]
- 4.Liu J, et al. A METTL3-METTL14 complex mediates mammalian nuclear RNA N6-adenosine methylation. Nat Chem Biol. 2014;10:93–5. doi: 10.1038/nchembio.1432. [DOI] [PMC free article] [PubMed] [Google Scholar]
- 5.Dunham I, et al. An integrated encyclopedia of DNA elements in the human genome. Nature. 2012;489:57–74. doi: 10.1038/nature11247. [DOI] [PMC free article] [PubMed] [Google Scholar]
- 6.Tzelepis K, et al. A CRISPR Dropout Screen Identifies Genetic Vulnerabilities and Therapeutic Targets in Acute Myeloid Leukemia. Cell Rep. 2016;17:1193–1205. doi: 10.1016/j.celrep.2016.09.079. [DOI] [PMC free article] [PubMed] [Google Scholar]
- 7.Shi J, et al. Discovery of cancer drug targets by CRISPR-Cas9 screening of protein domains. Nat Biotechnol. 2015;33:661–667. doi: 10.1038/nbt.3235. [DOI] [PMC free article] [PubMed] [Google Scholar]
- 8.Pendleton KE, et al. The U6 snRNA m6A Methyltransferase METTL16 Regulates SAM Synthetase Intron Retention. Cell. 2017;169:824–835.e14. doi: 10.1016/j.cell.2017.05.003. [DOI] [PMC free article] [PubMed] [Google Scholar]
- 9.Batista PJ, et al. m(6)A RNA modification controls cell fate transition in mammalian embryonic stem cells. Cell Stem Cell. 2014;15:707–19. doi: 10.1016/j.stem.2014.09.019. [DOI] [PMC free article] [PubMed] [Google Scholar]
- 10.Wang Y, et al. N6-methyladenosine modification destabilizes developmental regulators in embryonic stem cells. Nat Cell Biol. 2014;16:191–198. doi: 10.1038/ncb2902. [DOI] [PMC free article] [PubMed] [Google Scholar]
- 11.Meyer KD, et al. 5' UTR m6A Promotes Cap-Independent Translation. Cell. 2015;163:999–1010. doi: 10.1016/j.cell.2015.10.012. [DOI] [PMC free article] [PubMed] [Google Scholar]
- 12.Li Z, et al. FTO Plays an Oncogenic Role in Acute Myeloid Leukemia as a N6-Methyladenosine RNA Demethylase. Cancer Cell. 2017;31:127–141. doi: 10.1016/j.ccell.2016.11.017. [DOI] [PMC free article] [PubMed] [Google Scholar]
- 13.Ripperger T, et al. The heteromeric transcription factor GABP activates the ITGAM/CD11b promoter and induces myeloid differentiation. Biochim Biophys Acta - Gene Regul Mech. 2015;1849:1145–1154. doi: 10.1016/j.bbagrm.2015.07.005. [DOI] [PubMed] [Google Scholar]
- 14.Cancer Genome Atlas Research Network et al. The Cancer Genome Atlas Pan-Cancer analysis project. Nat Genet. 2013;45:1113–20. doi: 10.1038/ng.2764. [DOI] [PMC free article] [PubMed] [Google Scholar]
- 15.Dawson MA, et al. JAK2 phosphorylates histone H3Y41 and excludes HP1alpha from chromatin. Nature. 2009;461:819–22. doi: 10.1038/nature08448. [DOI] [PMC free article] [PubMed] [Google Scholar]
- 16.Ronchi AE, Bottardi S, Mazzucchelli C, Ottolenghi S, Santoro C. Differential binding of the NFE3 and CP1/NFY transcription factors to the human gamma- and epsilon-globin CCAAT boxes. J Biol Chem. 1995;270:21934–41. doi: 10.1074/jbc.270.37.21934. [DOI] [PubMed] [Google Scholar]
- 17.Migliori V, et al. Symmetric dimethylation of H3R2 is a newly identified histone mark that supports euchromatin maintenance. Nat Struct Mol Biol. 2012;19:136–144. doi: 10.1038/nsmb.2209. [DOI] [PubMed] [Google Scholar]
- 18.Uhlen M, et al. Tissue-based map of the human proteome. Science (80-. ) 2015;347:1260419–1260419. doi: 10.1126/science.1260419. [DOI] [PubMed] [Google Scholar]
- 19.Slobodin B, et al. Transcription Impacts the Efficiency of mRNA Translation via Co-transcriptional N6-adenosine Methylation. Cell. 2017;169:326–337.e12. doi: 10.1016/j.cell.2017.03.031. [DOI] [PMC free article] [PubMed] [Google Scholar]
- 20.Fustin JM, et al. XRNA-methylation-dependent RNA processing controls the speed of the circadian clock. Cell. 2013;155 doi: 10.1016/j.cell.2013.10.026. [DOI] [PubMed] [Google Scholar]
- 21.O’Connor L, Gilmour J, Bonifer C. The Role of the Ubiquitously Expressed Transcription Factor Sp1 in Tissue-specific Transcriptional Regulation and in Disease. Yale J Biol Med. 2016;89:513–525. [PMC free article] [PubMed] [Google Scholar]
- 22.Geltinger C, Hörtnagel K, Polack A. TATA box and Sp1 sites mediate the activation of c-myc promoter P1 by immunoglobulin kappa enhancers. Gene Expr. 1996;6:113–27. [PMC free article] [PubMed] [Google Scholar]
- 23.Knuckles P, et al. RNA fate determination through cotranscriptional adenosine methylation and microprocessor binding. Nat Struct Mol Biol. 2017;24:561–569. doi: 10.1038/nsmb.3419. [DOI] [PubMed] [Google Scholar]
- 24.Lin S, Choe J, Du P, Triboulet R, Gregory RI. The m6A Methyltransferase METTL3 Promotes Translation in Human Cancer Cells. Mol Cell. 2016;62:335–345. doi: 10.1016/j.molcel.2016.03.021. [DOI] [PMC free article] [PubMed] [Google Scholar]
- 25.Wang X, et al. N6-methyladenosine modulates messenger RNA translation efficiency. Cell. 2015;161:1388–1399. doi: 10.1016/j.cell.2015.05.014. [DOI] [PMC free article] [PubMed] [Google Scholar]
- 26.Lee BH, et al. FLT3 Mutations Confer Enhanced Proliferation and Survival Properties to Multipotent Progenitors in a Murine Model of Chronic Myelomonocytic Leukemia. Cancer Cell. 2007;12:367–380. doi: 10.1016/j.ccr.2007.08.031. [DOI] [PMC free article] [PubMed] [Google Scholar]
- 27.Li W, et al. MAGeCK enables robust identification of essential genes from genome-scale CRISPR/Cas9 knockout screens. Genome Biol. 2014;15:554. doi: 10.1186/s13059-014-0554-4. [DOI] [PMC free article] [PubMed] [Google Scholar]
- 28.Castello A, et al. Insights into RNA Biology from an Atlas of Mammalian mRNA-Binding Proteins. Cell. 2012;149:1393–1406. doi: 10.1016/j.cell.2012.04.031. [DOI] [PubMed] [Google Scholar]
- 29.Kwon SC, et al. The RNA-binding protein repertoire of embryonic stem cells. Nat Struct Mol Biol. 2013;20:1122. doi: 10.1038/nsmb.2638. [DOI] [PubMed] [Google Scholar]
- 30.Gerstberger S, Hafner M, Tuschl T. A census of human RNA-binding proteins. Nat Rev Genet. 2014;15:829–845. doi: 10.1038/nrg3813. [DOI] [PMC free article] [PubMed] [Google Scholar]
- 31.Baltz AG, et al. The mRNA-Bound Proteome and Its Global Occupancy Profile on Protein-Coding Transcripts. Mol Cell. 2012;46:674–690. doi: 10.1016/j.molcel.2012.05.021. [DOI] [PubMed] [Google Scholar]
- 32.Brinkman EK, Chen T, Amendola M, van Steensel B. Easy quantitative assessment of genome editing by sequence trace decomposition. Nucleic Acids Res. 2014;42:e168. doi: 10.1093/nar/gku936. [DOI] [PMC free article] [PubMed] [Google Scholar]
- 33.Fustin J-M, et al. RNA-Methylation-Dependent RNA Processing Controls the Speed of the Circadian Clock. Cell. 2013;155:793–806. doi: 10.1016/j.cell.2013.10.026. [DOI] [PubMed] [Google Scholar]
- 34.Gundry MC, et al. Highly Efficient Genome Editing of Murine and Human Hematopoietic Progenitor Cells by CRISPR/Cas9. Cell Rep. 2016;17:1453–1461. doi: 10.1016/j.celrep.2016.09.092. [DOI] [PMC free article] [PubMed] [Google Scholar]
- 35.Dawson MA, et al. Inhibition of BET recruitment to chromatin as an effective treatment for MLL-fusion leukaemia. Nature. 2011;478:529–533. doi: 10.1038/nature10509. [DOI] [PMC free article] [PubMed] [Google Scholar]
- 36.Li H, Durbin R. Fast and accurate long-read alignment with Burrows–Wheeler transform. Bioinformatics. 2010;26:589–595. doi: 10.1093/bioinformatics/btp698. [DOI] [PMC free article] [PubMed] [Google Scholar]
- 37.Li H, et al. The Sequence Alignment/Map format and SAMtools. Bioinformatics. 2009;25:2078–9. doi: 10.1093/bioinformatics/btp352. [DOI] [PMC free article] [PubMed] [Google Scholar]
- 38.Quinlan AR, Hall IM. BEDTools: a flexible suite of utilities for comparing genomic features. Bioinforma Appl NOTE. 2010;26:841–84210. doi: 10.1093/bioinformatics/btq033. [DOI] [PMC free article] [PubMed] [Google Scholar]
- 39.Zhang Y, et al. Model-based Analysis of ChIP-Seq (MACS) Genome Biol. 2008;9:R137. doi: 10.1186/gb-2008-9-9-r137. [DOI] [PMC free article] [PubMed] [Google Scholar]
- 40.Lawrence M, et al. Software for Computing and Annotating Genomic Ranges. PLoS Comput Biol. 2013;9:e1003118. doi: 10.1371/journal.pcbi.1003118. [DOI] [PMC free article] [PubMed] [Google Scholar]
- 41.Yu G, Wang L-G, He Q-Y. ChIPseeker: an R/Bioconductor package for ChIP peak annotation, comparison and visualization. Bioinformatics. 2015;31:2382–2383. doi: 10.1093/bioinformatics/btv145. [DOI] [PubMed] [Google Scholar]
- 42.Chen H, Boutros PC. VennDiagram: a package for the generation of highly-customizable Venn and Euler diagrams in R. BMC Bioinformatics. 2011;12:35. doi: 10.1186/1471-2105-12-35. [DOI] [PMC free article] [PubMed] [Google Scholar]
- 43.Heinz S, et al. Simple Combinations of Lineage-Determining Transcription Factors Prime cis-Regulatory Elements Required for Macrophage and B Cell Identities. Mol Cell. 2010;38:576–589. doi: 10.1016/j.molcel.2010.05.004. [DOI] [PMC free article] [PubMed] [Google Scholar]
- 44.Trapnell C, et al. Transcript assembly and quantification by RNA-Seq reveals unannotated transcripts and isoform switching during cell differentiation. Nat Biotechnol. 2010;28:511–515. doi: 10.1038/nbt.1621. [DOI] [PMC free article] [PubMed] [Google Scholar]
- 45.Cui X, et al. MeTDiff: a Novel Differential RNA Methylation Analysis for MeRIP-Seq Data. IEEE/ACM Trans Comput Biol Bioinforma. 2015:1–1. doi: 10.1109/TCBB.2015.2403355. [DOI] [PubMed] [Google Scholar]
- 46.Dominissini D, Moshitch-Moshkovitz S, Salmon-Divon M, Amariglio N, Rechavi G. Transcriptome-wide mapping of N6-methyladenosine by m6A-seq based on immunocapturing and massively parallel sequencing. Nat Protoc. 2013;8:176–189. doi: 10.1038/nprot.2012.148. [DOI] [PubMed] [Google Scholar]
- 47.Bailey TL, et al. MEME SUITE: tools for motif discovery and searching. Nucleic Acids Res. 2009;37:W202–8. doi: 10.1093/nar/gkp335. [DOI] [PMC free article] [PubMed] [Google Scholar]
- 48.Xiao Z, Zou Q, Liu Y, Yang X. Genome-wide assessment of differential translations with ribosome profiling data. Nat Commun. 2016;7 doi: 10.1038/ncomms11194. 11194. [DOI] [PMC free article] [PubMed] [Google Scholar]
- 49.Dunn JG, Weissman JS. Plastid: nucleotide-resolution analysis of next-generation sequencing and genomics data. BMC Genomics. 2016;17:958. doi: 10.1186/s12864-016-3278-x. [DOI] [PMC free article] [PubMed] [Google Scholar]
- 50.Panda AC, Martindale JL, Gorospe M. Polysome Fractionation to Analyze mRNA Distribution Profiles. Bio-protocol. 2017;7 doi: 10.21769/BioProtoc.2126. [DOI] [PMC free article] [PubMed] [Google Scholar]
- 51.Love MI, Huber W, Anders S. Moderated estimation of fold change and dispersion for RNA-seq data with DESeq2. Genome Biol. 2014;15:550. doi: 10.1186/s13059-014-0550-8. [DOI] [PMC free article] [PubMed] [Google Scholar]
- 52.Luo W, Friedman MS, Shedden K, Hankenson KD, Woolf PJ. GAGE: generally applicable gene set enrichment for pathway analysis. BMC Bioinformatics. 2009;10:161. doi: 10.1186/1471-2105-10-161. [DOI] [PMC free article] [PubMed] [Google Scholar]
- 53.Wyspiańska BS, et al. BET protein inhibition shows efficacy against JAK2V617F-driven neoplasms. Leukemia. 2014;28:88–97. doi: 10.1038/leu.2013.234. [DOI] [PubMed] [Google Scholar]
Associated Data
This section collects any data citations, data availability statements, or supplementary materials included in this article.


