Abstract
Despite genome scale analyses, high-level relationships among Neoaves birds remain contentious. The placements of the Neoaves superorders are notoriously difficult to resolve because they involve deep splits followed by short internodes. Using our approach, we investigate whether filtering UCE loci on their phylogenetic signal to noise ratio helps to resolve key nodes in the Neoaves tree of life. We find that our analysis of data sets filtered for high signal to noise ratio results in topologies that are inconsistent with unfiltered results but that are congruent with whole-genome analyses. These relationships include the Columbea + Passerea sister relationship and the Phaethontimorphae + Aequornithia sister relationship. We also find increased statistical support for more recent nodes (i.e. the Pelecanidae + Ardeidae sister relationship, the Eucavitaves clade, and the Otidiformes + Musophagiformes sister relationship). We also find instances where support is reduced for well-established clades, possibly due to the removal of sites with moderate signal-to-noise ratio. Our results suggest that filtering on the basis of signal to noise ratio is a useful tool for resolving problematic splits in phylogenomic data sets.
Keywords: Ultraconserved elements, Neoaves, phylogenetic signal, Non-coding DNA
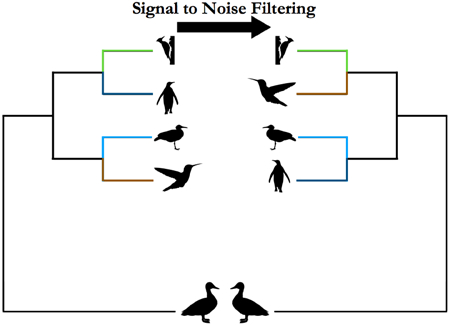
Graphical Abstract
1. INTRODUCTION
Phylogenetic reconstruction has greatly benefitted from the recent increase in genome-wide sequence data available on many taxa. The expectation was that with these data, all phylogenetic relationships not subjected to incomplete lineage sorting (ILS) or horizontal gene transfers could be resolved (Gee 2003; Philippe et al. 2011). Yet there are still numerous phylogenetic relationships that are not certain, reminding us that more data can mean more noise not just more signal. In phylogenies with short internodes, there is little opportunity to observe molecular changes on internode branches that would lead to correct resolution. There is also a greater chance of finding misleading changes on the subtending branches.
In order to enrich their data in signal and reduce noise, researchers conducting phylogenomic studies have explored ways to partition data that only incorporate rates optimal to resolve the phylogenetic relationship in question (Philippe et al. 2011). Assessing markers by their phylogenetic informativeness (PI) is one means of selecting sites across a dataset that are appropriate to resolve a specific phylogenetic question. This approach has the potential to detect which sites will be able to resolve a short internode followed by long branches (Dornburg et al. 2014; Dornburg et al. 2016; Gilbert et al. 2015; Prum et al. 2015; Townsend et al. 2007; Townsend et al. 2010; Townsend et al. 2011). PI tracks the power of a marker of site to resolve a hypothetical, un-rooted, 4 taxon polytomy (Townsend 2007). However, resolution of such a polytomy, and by extension phylogenetic inference of short deep internodes with fast-evolving characters can be heavily impacted by noise (Bleidorn 2017; Brown and Thomson 2017; Townsend and Lopez-Giraldez 2010). Thus Townsend et al. (2012) developed the measures of phylogenetic signal and noise based, again, on the phylogenetic quartet (Bandelt & Dress 1986) and their model applies estimates of nucleotide composition and the evolutionary rates of characters to approximate the probability of phylogenetic signal and noise due to convergent or parallel evolution (Bandelt & Dress 1986; Townsend 2012). Although still infrequently applied, ranking phylogenetic markers or removing sites with low signal to noise ratios, especially when analyzing unresolved nodes (polytomies), has proved successful (Chen et al. 2015).
Ultraconserved elements (UCEs) are small fragments of DNA that are very similar (greater than 80% identical sequence) across distantly related taxa (Bejerano et al. 2004, Siepel et al. 2005). UCEs have quickly gained popularity in phylogenomics because (1) of the computational ease with which they can be designed for non-model organisms, (2) hundreds or thousands of UCEs can quickly be sequenced using high-throughput technology (targeted enrichment or capture array) and (3) nucleotide variation predominantly found in the UCE flanking regions, carries micro and macro evolutionary signal (Faircloth et al. 2012). UCEs consist of a highly invariant core but the regions that flank the core increase in their sequence variation as the distance from the core increases (see Figures 3A and 3B of Faircloth et al. 2012b). Phylogenomic studies using UCEs have improved our understanding of many animal relationships, notably, ray-finned fishes (Faircloth et al. 2013), non-avian reptiles (Crawford et al. 2012), birds (Sun et al. 2014; McCormack et al. 2013; Jarvis et al. 2014), mammals (McCormack et al. 2012), and arthropods (Faircloth et al. 2014). Although earlier studies have shown that the phylogenetic informativeness of UCE loci is on par with the PI of genes used in traditional multi-locus studies (Gilbert et al., 2015), the utility of signal-to-noise filtering has yet to be explored for these markers.
3.
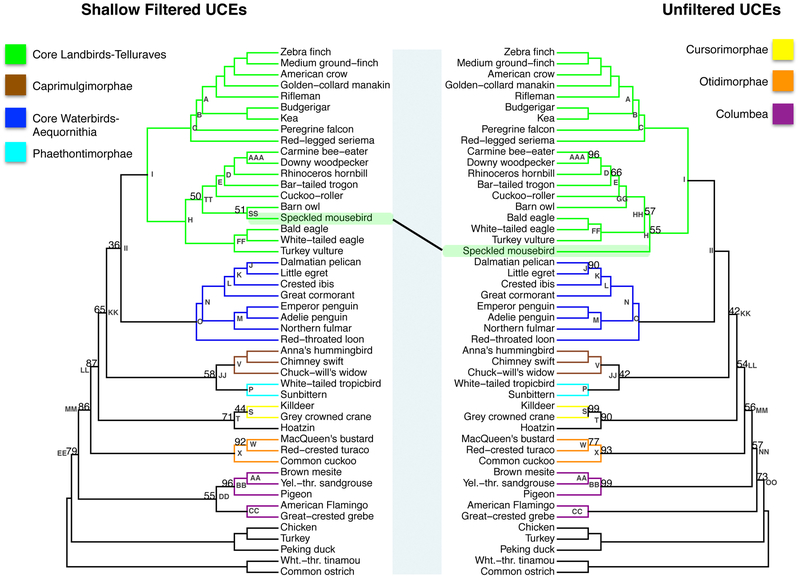
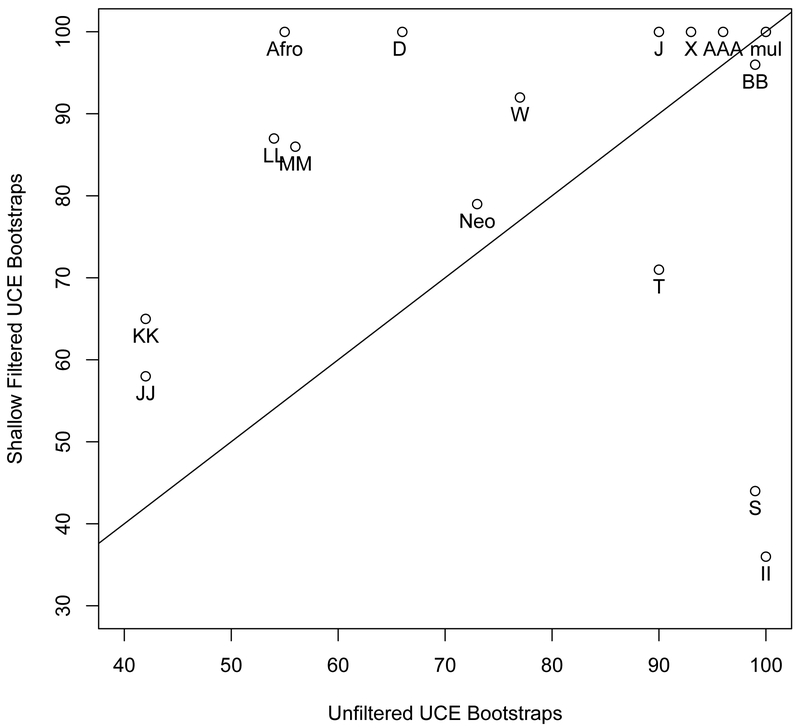
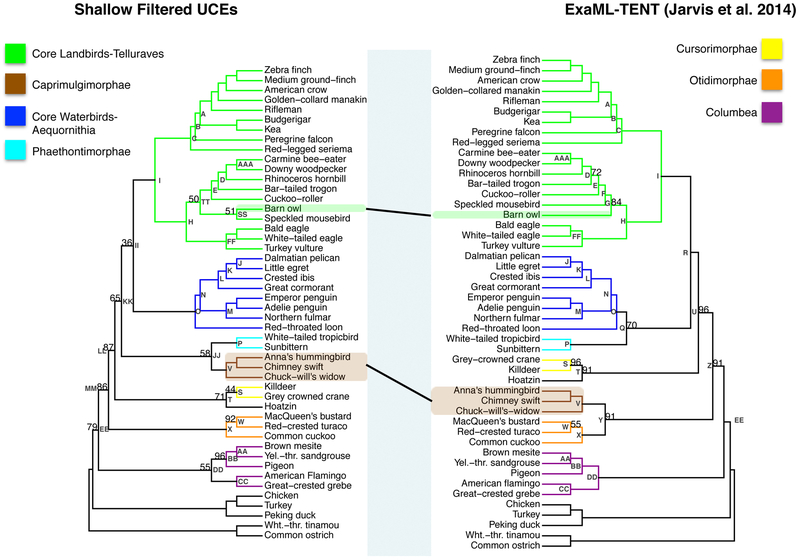
(a) The phylogenetic reconstruction based on UCE nucleotide positions which had phylogenetic signal within in the top 20th percent of the UCE′s adjusted phylogenetic signal score for species divergences between 27-64MYA (shallow filtered, left) and the phylogenetic reconstruction using all nucleotide positions (unfiltered, right). Bootstrap support values less than 100% are shown for each internal node. b. Scatter plot of percent bootstrap support (BS) when the same clade is supported in the shallow filtered UCE phylogeny and the unfiltered UCE phylogeny. The points are labeled with the same node labels as in Fig. 3(a) except for: (1) the label mul, which corresponds to the nodes A, B, C, D, E, I, K, L, M, N, O, P, V, AA, CC, FF, and JJ in Fig. 3(a); (2) the label Afro, which denotes the afroaves node H in the shallow UCE phylogeny and in the unfiltered UCE phylogeny; and (3) the label Neo, which denotes the neoaves nodes EE in the shallow UCE phylogeny and OO in the unfiltered UCE phylogeny.
Some of the deepest branches within Neoaves are poorly resolved (Claramunt et al. 2015, Jarvis et al. 2014; Jetz et al. 2012; Prum et al. 2015; Thomas 2015). Neoaves include all the bird species except for the flightless ‘ratite’ birds and tinamous (Palaeognathae) and the chickens, turkeys, pheasants, megapodes, ducks, geese and swans (Galloanseres). Although the date has been subject to debate (Brown et al. 2007; Cracraft et al. 2015; Ericson et al. 2006; Mitchell et al. 2015) it is believed that nearly all neoavian orders evolved between 50-70MYA (Jarvis et al. 2014). Considerable incomplete lineage sorting (Feducia, 1995; Poe & Chubb, 2004), measured most recently via insertion-deletions (indels) and transposable elements (Suh et al. 2015), were cited as possibly affecting the inference of the deepest branches of Neoaves and Afroaves (Jarvis et al. 2014). Jarvis et al. (2014) also found that phylogenies of 48 bird species constructed using exclusively UCEs exhibited lower resolution on deep branches in Neoaves than the phylogenies constructed using both gene and UCE data. This lower resolution may be the result of not only the reduction in amount of data but also the lower rate of evolution of the UCEs relative to genes (Jarvis et al. 2014).
Here, we reanalyze UCE data for 48 bird species from Jarvis et al. (2014) to calculate phylogenetic signal to noise ratio estimates for selected time periods (Townsend et al., 2012). On the basis of this ratio we filter the UCE data and conduct new phylogenetic analyses. We compare the phylogeny using filtered UCE data to the phylogeny using the unfiltered UCE data and to the total evidence based maximum likelihood phylogeny of Jarvis (ExaML-TENT), a reconstruction based on UCEs, exonic and intronic regions. We also provide our workflow for filtering on the basis of signal to noise ratio as a series of scripts for other applications to genome-scale data.
2. MATERIALS AND METHODS
2.1. Rationale for the Neoaves Nodes Chosen for Signal to Ratio Calculations
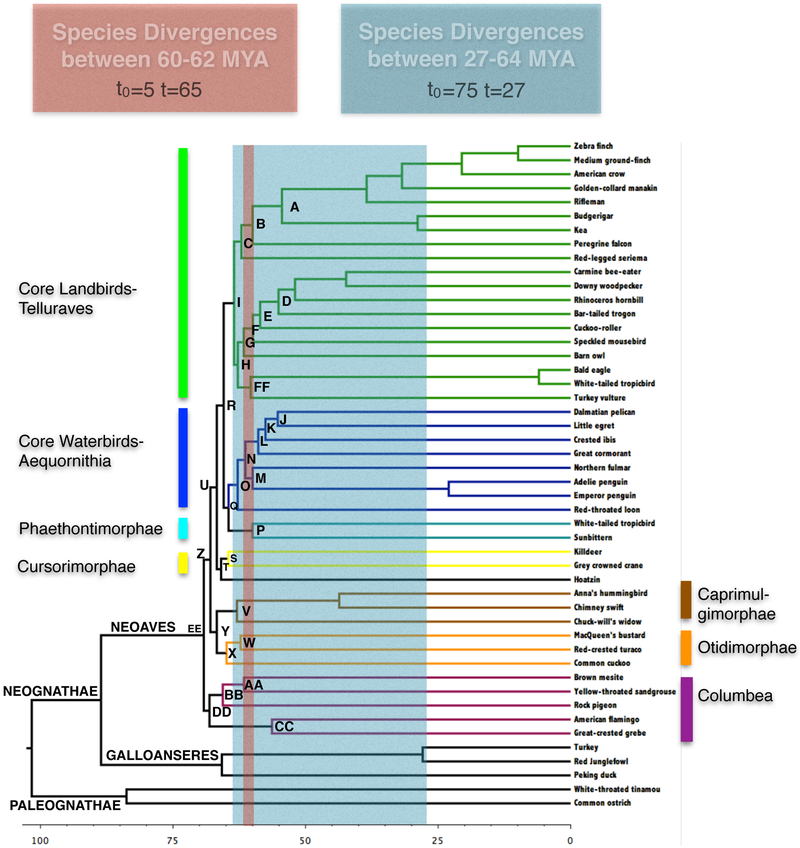
Using the publicly available files (Aberer et al., 2014) we annotated the phylogram (Fig. 1) to reflect the results of Jarvis et al. (2014). Based on these results, we chose two general depths in the phylogeny, one representing a series of deep divergences followed by long branches, the second representing a more recent rapid or shallow radiation with longer internodes between branching events. The deepest branching nodes of Neoaves occurred between 60-70MYA (Fig. 1). Thus, filtering at this depth provides an excellent test case for resolving a deep branching (62MYA) with short internodes (5 million years) problem and is representative of the internodes in the deepest divergences of the Neoaves (e.g. the internode between L and M, Fig. 1, red shading). Henceforth we refer to this case as the deep branching problem. These nodes also exhibited low bootstrap support values in the UCE species phylogeny published in Jarvis et al. (2014).
1.
Regions of the avian phylogeny for which phylogenetic signal, noise and polytomy probabilities were calculated. The red and blue colors denote 60-62 MYA (deep) and 27-64 (shallow) MYA respectively and highlight the avian species divergences occurring these periods. The area between colored bars denotes internode length plus the average subtending branch length of each partition. The time-calibrated phylogeny is from Jarvis et al. (2014).
The second filtering example was selected to focus on subclades of the Neoaves. As an example, Telluraves (node I, Fig. 1), is a recently defined and controversial clade (Yuri et al. 2013). Within Telluraves is node A (Fig. 1), which corresponds to the Eufalconimorphae a clade that includes the Passeriformes, the Psittaformes and the Falconiformes, and node F, which corresponds to the Coraciimorphae a clade that includes the Coliiformes (represented in the data set by the speckled mousebird) and the Cavitaves. In addition to being of intrinsic interest in the understanding of bird systematics, filtering based on this time period provides a second test case for a shallower reconstruction problem: resolving recently evolved clades (27MYA) with moderate internode lengths (spanning 48 million years, beginning 75 million years ago and ending 27 million years ago) (Fig. 1 blue shading). Henceforth we refer to this case as the shallow branching problem.
2.2. Phylogenetic signal to noise analysis
Townsend et al. (2012) developed a model that estimates the probability of phylogenetic signal, the probability of phylogenetic noise (due to convergent or parallel evolution) and the probability of a polytomy for a given locus at a given node. These estimates incorporate the date of the node and the length of the subtending branches following that node. Thus, the model relies on accurate evolutionary rates and estimates of node age and internode length. The evolutionary rate is simply the substitution rate of a character. The character state space is based on the percentage of each nucleotide type and the transition - transversion rates (rTA, rTG, rCA, rCG). The time components of the calculation are defined by the time at which the nodes of interest occur and the length of the descendant branches from that point.
For the deep and shallow branching problems, we calculated the probability of signal (C), probability of noise (N) and the probability of a polytomy (P) for each site in each UCE. Sequence alignment data were downloaded from Aberer et al. (2014). We used Mathematica versions 10.2-10.4 (Wolfram Research, Inc., 2016), modified computer code from Townsend et al. (2012), and Phydesign (Lopez-Giraldez and Townsend, 2011) to calculate these measures. To do so required calculating the transition -transversion rates, the percentage of each nucleotide type and the substitution per site rate of each nucleotide in each UCE, which we did using TAPIR (Faircloth et al. 2012a). TAPIR creates a separate JSON file (Ooms 2014) for each UCE. We processed each JSON file to isolate the required inputs with a computational pipeline, using scripts written in the statistical computing language R. Specifically we removed all information except (1) the transition - transversion rates, (2) the percentage of each nucleotide type and (3) the substitution per site rate of each nucleotide (all scripts are available on Dryad). We then used this information along with the node age and internode length to calculate the probability of C, N and Pfor each site.
For our analysis, we customized Townsend’s Mathematica notebook code (Townsend et al. 2012) in order to calculate C, N and Pfor each site across unfiltered UCEs. Sites with a zero rate of change lead to P= 1 and therefore were excluded from the calculation of phylogenetic C, N, and P Sites with higher than 0.2 substitutions per site were also excluded to eliminate artificially high estimates that resulted from insertions or deletions introduced in UCE sequence alignments in regions of high uncertainty (Supplemental and Appendix Figs., Philippe and Roure 2011). After these two exclusions we had a total of 3,843,061 sites across 3,603 UCEs. Signal to noise (SN) can be defined in several ways (Townsend et al., 2012). We used SN =C/(C+N) which is equivalent to SN = C/(I-P). We looked for sites that sufficiently shifted the distribution of SN towards the maximum (Supplemental Figs. 1-4) and found that these fell within the top 20% of the SN distribution.
2.4. Phylogenetic Reconstruction
We chose to concatenate the UCEs for ease of computation. We used a general time reversible model of evolution with gamma distributed rate variation among sites to compute 20 distinct maximum likelihood topologies starting from 20 distinct randomized maximum parsimony starting topologies (scripts available from DRYAD.org.). We parallelized the computations with 24 threads of execution spread over 12 processing cores in RAxML (Stamatakis 2014). We computed 100 bootstrap alignment replicates under the GTRGAMMA model for the unfiltered data and 200 bootstraps for the filtered data. We then reconciled the best phylogeny (highest GRTGAMMA likelihood score) with the bootstrap replicates. Results were visualized using R (R Core Team, 2016).
2.5. Phylogenetic Comparisons
In order to test the effect of filtering the UCE data we compared the phylogeny reconstructed from the unfiltered UCE with each of the filtered phylogenies (deep and shallow). In order to reduce the possible reasons for topological differences and bootstrap support differences for nodes, we compared our filtered UCE phylogenies to the unfiltered UCE phylogeny we reconstructed (described in the supplemental material) and not the UCE species phylogeny available from Jarvis et al. (2014). We calculated RF symmetric differences to determine how similar two phylogenies are topologically (Robinson and Fouldes, 1981) using the TreeDist option of PHYLIP (version 3.5c, evolution.genetics.washington.edu/phylip.html) available in phylogenetic web platform CompPhy (Fiorini et al. 2014, http://www.atgc-montpellier.fr/compphy/). The smaller the RF, the more similar the topologies with the limiting value that two phylogenies with identical topologies have a RF symmetric difference value of zero. We then identified the particular nodes that represented these differences. For clades found in both phylogenies, we compared bootstrap support values at the recovered node. We used exact test of proportions to compare bootstrap support (BS) for equivalent nodes in the different phylogenies and use p-values to determine significance at a significance level of alpha = 0.05.
3. RESULTS
3.1. UCE Site Characteristics
There were 768,612 unique sites after selecting the top 20% of the SNratio. In comparing the site distribution before and after filtering (in both cases after removal of sites with substitution rates of zero) we find that the filtered sites are more likely to be found in the middle third of the variable sites of the UCE, these sites are likely from the cores or the proximal portion of the flanks. We provide summary statistics for the substitution rates, probability of noise N, probability of polytomy P, probability of signal C, SN and site usage for both deep and shallow filtering in Table 1 and observed distributions for these same quantities in Supplemental Figs 1-4.
Table 1:
Signal to Noise Descriptive Statistics
| Shallow Filtering Question | |||||||
|---|---|---|---|---|---|---|---|
| Min | 1st Quartile | Median | Mean | 3rd Quartile |
Max | SD | |
| Before Filtering | |||||||
| Rate | 0.0219 | 0.0488 | 0.0931 | 0.0969 | 0.138 | 0.1999 | 0.0493 |
|
Prob Noise (N) |
0.0888 | 0.0918 | 0.0932 | 0.0964 | 0.0946 | 0.1144 | 0.00228 |
|
Prob Polytomy (P) |
0.8021 | 0.8871 | 0.8896 | 0.8847 | 0.8927 | 0.8974 | 0.0122 |
|
Prob Signal (C) |
0.0134 | 0.0147 | 0.0162 | 0.0219 | 0.0272 | 0.0901 | 0.0109 |
| SN | 0.1303 | 0.1354 | 0.1486 | 0.1839 | 0.226 | 0.4689 | 0.0653 |
| After Filtering on Top 20% SN | |||||||
| Rate | 0.0219 | 0.0316 | 0.0386 | 0.0377 | 0.0433 | 0.0633 | 0.00636 |
| N | 0.0888 | 0.0938 | 0.0948 | 0.0954 | 0.0965 | 0.1144 | 0.00231 |
| P | 0.8021 | 0.8548 | 0.8663 | 0.864 | 0.874 | 0.8806 | 0.0106 |
| C | 0.0287 | 0.0320 | 0.0376 | 0.0406 | 0.0487 | 0.0901 | 0.00934 |
| SN | 0.2398 | 0.2539 | 0.2812 | 0.2951 | 0.335 | 0.4689 | 0.0448 |
| Sites per UCE | 18 | 154 | 201.5 | 209.40 | 255.8 | 474 | 26.49 |
| Deep Filtering Problem | |||||||
|---|---|---|---|---|---|---|---|
| Min | 1st Quartile | Median | Mean | 3rd Quartile |
Max | SD | |
| Before Filtering | |||||||
| Rate | 0.0219 | 0.0487 | 0.093 | 0.0967 | 0.138 | 0.1999 | 0.0493 |
| N | 0.0892 | 0.0918 | 0.0936 | 0.0936 | 0.0952 | 0.1150 | 0.00233 |
| P | 0.8650 | 0.8900 | 0.8921 | 0.8920 | 0.8942 | 0.8974 | 0.00289 |
| C | 0.0134 | 0.0140 | 0.0144 | 0.0144 | 0.0148 | 0.0200 | 0.00057 |
| SN | 0.1302 | 0.1318 | 0.1329 | 0.1331 | 0.1341 | 0.1504 | 0.00186 |
| After Filtering on Top 20% SN | |||||||
| Rate | 0.0219 | 0.0316 | 0.0407 | 0.0528 | 0.0505 | 0.1999 | 0.0364 |
| N | 0.0921 | 0.0951 | 0.0962 | 0.0964 | 0.0975 | 0.1150 | 0.00171 |
| P | 0.8650 | 0.8871 | 0.8886 | 0.8885 | 0.8899 | 0.8936 | 0.00202 |
| C | 0.0143 | 0.0149 | 0.0152 | 0.0152 | 0.0154 | 0.0200 | 0.00036 |
| SN | 0.1344 | 0.1349 | 0.1356 | 0.1360 | 0.1369 | 0.1504 | 0.00140 |
| Sites per UCE | 1 | 91 | 137 | 213.3 | 236.5 | 1365 | 233.18 |
Only 3 UCEs (0.1% of the total loci) did not contribute sites to the shallow branching problem data after filtering sites for SNin the top 20%. The minimum number of sites per UCE was 18 and the maximum number of sites per UCE was 474 (mean number 209.4; distribution provided as Fig. S6). The SNrange before filtering was 0.1303 to 0.4689 and after filtering was 0.2398 to 0.4689. Filtering increased the mean SNfrom 0.1829 to 0.2951 (Table 1, Fig. S1), mainly a result from a large shift in the probability of signal distribution (mean before filtering = 0.0219, mean after filtering = 0.0406, Table 1 and Fig. S1). Interestingly SNfiltering left the probability of noise virtually unchanged, moderately decreased the probability of polytomy and dramatically decreased the substitution rate (Table 1 and Figs. S1 and S2).
There was at least one site from each of the 3,603 UCEs in the data set after filtering for the deep branching problem. The sites were less evenly distributed across the UCEs in this case than they were in shallow branching problem. There were as few as 1 site from some UCEs, 29 UCEs contributed to 10 or fewer sites and one UCE contributed 1365 sites (mean number = 213.3; distribution provided as Fig. S7). The SNrange was rather tight even before filtering (0.1302 to 0.1504) and had a mean of 0.1331 (Table 1). After filtering for sites in the top 20%, the SNrange was 0.1344 to 0.1504 and the mean increased slightly to 0.1360. The substitution rate and the probability of polytomy distributions tended lower and the probability of noise and probability of signal distributions both tended higher after filtering (Table 1 and Figs. S3 and S4). The narrow range of SN and its relative lack of change with filtering compared to the shallow branching problem is consistent with there being very little phylogenetic information available on a per site basis to resolve a short, deep branch of the phylogeny, although the sheer number of sites can provide sufficient information (Gilbert et al., 2015).
3.2. Unfiltered UCE phylogeny vs. ExaML-TENT (Jarvis et al., 2014) phylogeny
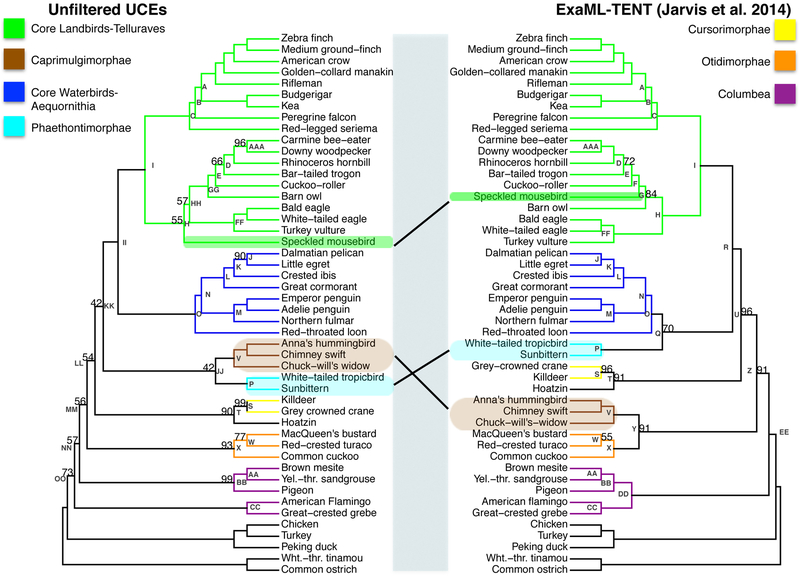
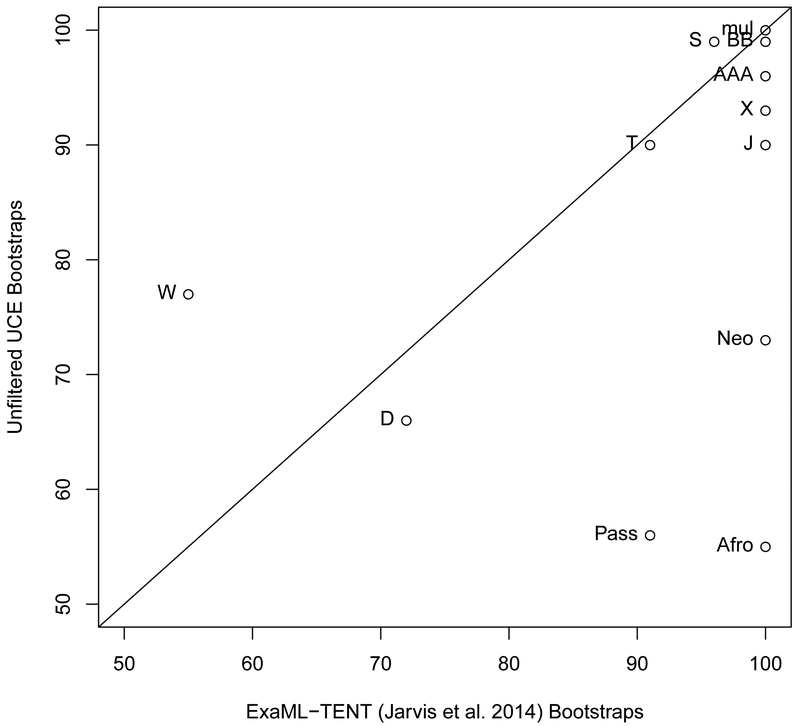
There were a number of differences between our unfiltered UCE phylogeny and the ExaML-TENT phylogeny of Jarvis et al. (2014) (Fig. 2a). The RF symmetric difference value between these two phylogenies was 14. These differences likely occurred because of difference in the data (the ExaML-TENT was based on introns, exons, and UCE datasets) and because of the differences in the assumptions of reconstruction computations, for example, our UCE concatenation in RaXML vs. gene phylogeny/species phylogeny analysis in ExaML. Our unfiltered UCE phylogenetic reconstruction (Node H, left phylogeny, Fig. 2a) placed the speckled mousebird (order Coliiformes) as the outgroup to a clade containing the Cavitaves, Strigiformes and Accipitrimorphae (Node HH, left phylogeny) while the ExaML-TENT analysis from Jarvis et al. (2014) placed the speckled mousebird as sister to the clade Cavitaves (Node F, right phylogeny). The resulting support for the Afroaves clade was reduced in the unfiltered UCE phylogeny relative to its support in the ExaML-TENT phylogeny (Node H, 55% bootstrap support (BS) left phylogeny versus 100% BS, right phylogeny, p<0.00005, Fig. 2a and 2b).
2.
(a) The phylogeny using unfiltered UCEs (left) and the ExaML-TENT phylogeny from Jarvis et al. (2014) (right). Bootstrap support values less than 100% are shown for each internal node. (b) Scatter plot of percent bootstrap support (BS) when the same clade is supported in the unfiltered UCE phylogeny and the ExaML-TENT phylogeny. The points are labelled with node labels as in Fig. 2(a) except for: (1) the label mul, which corresponds to the nodes A, B, C, E, I, J, K, L, M, N, O, P, V, AA, BB, CC, and FF in Fig. 2(a); (2) the label Afro, which denotes the afroaves nodes H in the unfiltered UCE phylogeny and in the ExaML-TENT phylogeny; (3) the label Neo, which denotes the neoaves nodes OO in the unfiltered UCE phylogeny and EE in the ExaML-TENT phylogeny; and (4) Pass, which denotes the Passerea nodes MM in the unfiltered UCE phylogeny and Z in the ExaML-TENT phylogeny.
Other differences between these two phylogenies were in the placement of the Caprimulgimorphae clade (Node V, highlighted in brown, Fig. 2a) and the Phaethontimorphae clade (Node P, highlighted in light blue). In the Jarvis et al. (2014) ExaML-TENT phylogeny Caprimulgimorphae (Node V) was placed sister to the Otidimorphae (Node X) with 91% BS (Node Y) and Phaethontimorphae (Node P) was placed sister to Aequornithia (Node O) with 70% BS (Node Q). However, the unfiltered UCE phylogeny placed Caprimulgimorphae (Node V) sister to Phaethontimorphae (Node P) with 42% BS (Node JJ) and Telluraves (Node I) sister to Aequornithia (Node O) with 100% BS (Node II). Support for the Passerea node was reduced in the unfiltered UCE phylogeny relative to its support in the ExaML-TENT phylogeny (Node MM 56% BS, left phylogeny versus node Z 91% BS, right phylogeny, p<0.00005, Fig. 2a and 2b).
Our unfiltered UCE phylogeny did not recover the highly supported, monophyletic Columbea clade that was found in the ExaML-TENT phylogeny (Node DD, 100% BS right phylogeny, Fig. 2a). Instead the unfiltered UCE phylogeny placed Columbimorphae sister to all Passerea (Node NN, 57% BS) and Columbimorphae + Passerea sister to Phoenicopterimorphae (Node OO, 73% BS). This result, the placement of Phoenicopterimorphae (Node CC) instead of Columbea (Node DD) as the sister to all the remaining Neoaves (Node OO), is the same topology as that found in the UCE species phylogeny from Jarvis et al. (2014) (See Node OO, online appendix supplemental materials Fig. 5).
There were nodes that had the same topology in the two phylogenies for which we observed changes in bootstrap confidence (Fig. 2b). For most of these clades, the confidence remained very high including for nodes AAA, BB, S, and T. Node W showed a large increase (77% BS versus 55%BS, p=0.0002). Three nodes showed dramatically reduced support, the Afroaves, the Passerea (described above) and the notably Neoaves node (Node OO, 73% BS, left phylogeny, versus Node EE, 100% BS, right phylogeny, p<0.00005, Fig. 2a and 2b).
3.3. Comparison of the shallow filtered UCE phylogeny vs. the unfiltered UCE phylogeny
We next compared the phylogeny resulting from the shallow filtered data to the phylogeny resulting from all the UCE data. The RF symmetric difference value between these two phylogenies is 6 indicating close agreement. Examining the phylogenies, we can see that the speckled mousebird (order Coliiformes) was placed sister to the barn owl (order Strigiformes) in the shallow filtered phylogeny (Node SS, left phylogeny, Fig. 3a). This differed from the placement of the speckled mousebird as the sister to all remaining Afroaves in the unfiltered UCE phylogeny (Node H, right phylogeny, Fig. 3a). We note, however, that the bootstrap support was low in both cases (Node SS, 51% BS, left phylogeny vs. Node H, 55% BS, right phylogeny). The most important difference between the two phylogenies lies in the relationship between Columbimorphae and Phoenicopterimorphae (Nodes BB and CC, both highlighted in purple). The shallow filtered UCE sites recover a sister relationship between Columbimorphae and Phoenicopterimorphae (i.e. a monophyletic Columbea clade, Node DD, 55% BS) which fails to be recovered in our unfiltered UCE phylogeny or the unfiltered UCE species phylogeny from Jarvis et al (2014).
For the identical portions of the two phylogenies, we observed multiple instances of increased support due to filtering (Fig. 3b). Most notable increases in support occurred for the Afroaves clades (Afro, Fig. 3b and Node H, Fig. 3a) and Eucavitaves clades (Node D, Fig.3b), the entire Otidimorphae clade (Node X, Fig. 3b) as well as for the sister placement of Otidiformes to Musophagiformes (Node W, Fig. 3b). We also observed an increase in support for major Passerea clades (Node MM, Node LL, KK). Specifically, the Otidimorphae + (Cursorimorphae+ (Caprimulgimorphae+ Phaethontimorphae)+ Aequornithia +Telluraves)(Node MM 86% BS versus 56% BS, p=0.0001, Fig. 3a and 3b), Cursorimorphae + (Caprimulgimorphae+ Phaethontimorphae)+ Aequornithia + Telluraves)(Node LL 87% BS versus 54% BS, p< 0.00005) and (Caprimulgimorphae+ Phaethontimorphae)+ Aequornithia + Telluraves (Node KK 65% BS versus 42% BS, p=0.0002). The support for the Neoaves node (Neo, Fig. 3b) is slightly increased but not significantly so (Node EE, 79% BS left phylogeny versus node OO 73% BS, right phylogeny, p=0.2444, Fig. 3a). We also observed a significant decrease in support for the Cursorimorphae clade (Node S, 99% BS, versus 44% BS, p=< 0.00005) as well as the Cursorimorphae + hoatzin sister relationship (Node T, p=0.000r). The Telluraves + Aequornithia sister relationship support decreased dramatically (Node II, 100% BS versus 36% BS, p< 0.00005).
3.4. Comparison of shallow filtered UCE phylogeny vs. ExaML-TENT phylogeny
We next compared the phylogeny resulting from the shallow filtered data to the ExaML-TENT phylogeny of Jarvis et al. (2014). The RF symmetric difference value between these two phylogenies is 10, which makes the shallow filtered phylogeny more similar to the ExaML-TENT phylogeny than the unfiltered UCE phylogeny is to the ExaML-TENT phylogeny. The differences lie in the placement of the barn owl (Node SS, left phylogeny, Node G, left phylogeny), Phaethontimorphae, labeled as Node P (placement in left phylogeny descending from Node JJ but in right phylogeny descending from Node Q), Caprimulgimorphae labeled as Node V (placement in left phylogeny descending from Node JJ but in right phylogeny descending from Node Y), Otidimorphae labeled Node X (placement in left phylogeny descending from Node MM but in right phylogeny descending from Node Y), and Aequornithia labeled Node O(placement in left phylogeny descending from Node II but in right phylogeny descending from Node Q (Fig. 4a).
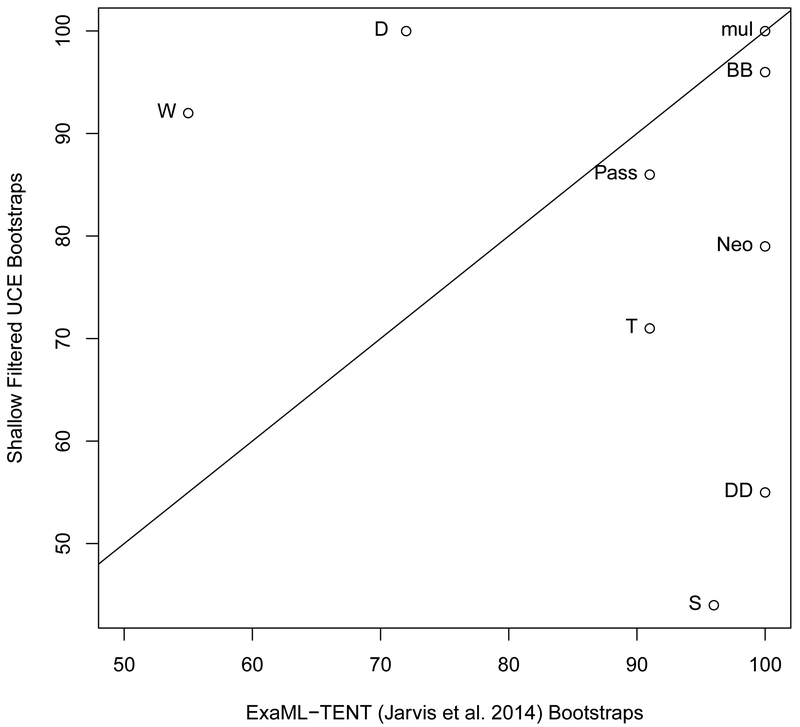
4.
(a) The shallow filtered UCE phylogenetic reconstruction (left) and the ExaML-TENT phylogenetic reconstruction (right). Bootstrap support values less than 100% are shown for each internal node. (b) Scatter plot of percent bootstrap support (BS) when the same clade is supported in the shallow filtered UCE phylogeny and the ExaML-TENT phylogeny. The points are labeled with the same node labels as in Fig. 4(a) except for: (1) the label mul, which corresponds to the nodes A, B, C, D, E, H, J, K, L, M, N, O, P, V, AA, CC, FF and AAA in Fig. 4(a); (2) the label Neo, which denotes the neoaves node EE in the shallow filtered UCE and ExaML-TENT phylogeny; and (3) Pass, which denotes the Passerea nodes MM in the shallow filtered UCE phylogeny and Z in the ExaML-TENT phylogeny.
For the identical portions of the two phylogenies, there was more support for the Eucavitaves (Node D) in the shallow UCE phylogeny than the ExaML-TENT phylogeny (100% BS, left phylogeny versus 72% BS, right phylogeny, p < 0.00005, Fig. 4a and 4b). We also observed increased support for the MacQueen’s bustard (order Otidiformes) as sister to the red-crested turaco (order Musophagiformes) (Node W, 92%BS, left phylogeny versus 55%BS, right phylogeny, p < 0.00005, Fig. 4a and 4b).
There were 6 nodes that had less bootstrap support in the shallow filtered UCE phylogeny than in the ExaML-TENT phylogeny (Fig. 4b). The ExaML-TENT phylogeny and the shallow filtered phylogeny both recovered a monophyletic Columbea clade albeit with decreased support in the shallow filtered phylogeny (Node DD, 55% BS, left phylogeny and 100% BS, right phylogeny, purple branches, p < 0.00005, Fig. 4a and 4b). We also observed a large and statistically significant decrease in support for Cursorimorphae (Node S, 44% BS, left phylogeny versus 96% BS, right phylogeny, p < 0.00005, Fig. 4a and 4b) and a decrease in support for the Cursorimorphae + hoatzin sister relationship (Node T, 71% BS, left phylogeny vs. 91% BS, right phylogeny, p< 0.00005, Fig. 4a and 4b). We observed a slight decrease in support for Columbimorphae (Node BB, 96% BS, left phylogeny vs. 100% BS, right phylogeny, p =0.0073, Fig. 4a and 4b). The Neoaves node support was decreased (labeled as Neo in Fig. 4b; Node EE, 76% BS, left phylogeny versus 100% BS, right phylogeny, p < 0.00005, Fig. 4a). Support for the Passerea node (labeled as Pass in Fig. 4b) was slightly reduced in the shallow filtered UCE phylogeny relative to its support in the ExaML-TENT phylogeny (Node MM 86% BS, left phylogeny versus node Z, 91% BS, right phylogeny, p = 0.1578, Fig. 4a) albeit the arrangement of taxa within the node differs substantially.
3.5. Comparison of the deep filtered UCE phylogeny vs. unfiltered UCE phylogeny
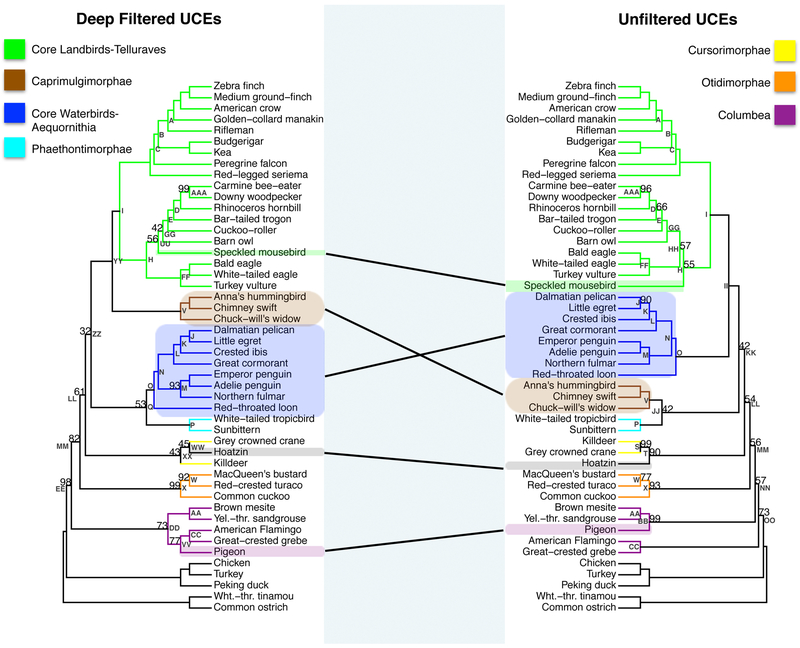
The deep filtered UCE phylogeny and the unfiltered UCE phylogeny had a RF symmetric difference of 12, reflecting more topological differences than we observed between the shallow filtered UCE phylogeny and the unfiltered UCE phylogeny. The specific placement of the speckled mousebird within the Afroaves clade differed in these two phylogenies (Fig. 5a). Our unfiltered UCE phylogenetic reconstruction placed the speckled mousebird as sister to the clade containing Cavitaves, Strigiformes and Accipitrimorphae (the eagles and vultures, Nodes H and FF, right phylogeny, Fig. 5a). In contrast, in the deep filtered phylogeny (left phylogeny, Fig. 5a), Accipitrimorphae (Node FF) was placed sister to a clade containing the barn owl (Node UU), the cuckoo-roller (order Strigiformes, Node GG) and Cavitaves (Node E). The Afroaves node had significantly increased support in the deep filtered phylogeny relative to the unfiltered phylogeny (Node H, 100% BS, left phylogeny versus 55% BS, right phylogeny, p<0.00005, Fig. 5a).
5.
(a) The phylogenetic reconstruction based on nucleotide UCE positions which had phylogenetic signal within in the top 20th percent of the UCE′s adjusted phylogenetic signal score for species divergences between 60-62MYA (deep filtered, left) and the phylogenetic reconstruction using all nucleotide positions (unfiltered, right). Bootstrap support values less than 100% are shown for each internal node. (b) Scatter plot of percent bootstrap support (BS) when the same clade is supported in the deep filtered UCE phylogeny and the unfiltered UCE phylogeny. The points are labeled with the same node labels as in Fig. 5a except for: (1) the label mul, which corresponds to the nodes A, B, C, E, I, K, L, N, O, AA, CC, FF, and II in Fig. 5(a); (2) the label Afro, which denotes the afroaves node H in the deep filtered UCE phylogeny and in the unfiltered UCE phylogeny; (3) the label Neo, which denotes the neoaves nodes EE in the deep filtered phylogeny and OO in the unfiltered UCE phylogeny; and (4) Pass, which denotes the Passerea node MM in Fig. 5(a).
The deep filtered phylogeny placed Caprimulgimorphae (Node V) sister to all Telluraves (Node I) with strong bootstrap support (Node YY, 100%BS, left phylogeny, Fig 5a). In the unfiltered UCE phylogeny, Caprimulgimorphae (Node V) was placed sister to Phaethontimorphae (Node P, the tropicbirds and sunbittern) with low support (Node JJ, 42% BS, right phylogeny, Fig 5a). The deep filtered phylogeny placed Aequornithia (Node O) sister to Phaethontimorphae (Node P) with 53% BS (Node Q, left phylogeny). This result contrasts with Aequornithia's (Node O) placement as sister to the core landbirds (Node I, Telluraves) in the unfiltered UCE phylogeny (Node II, 100% BS, right phylogeny).
Another change in Passerea was that in the deep filtered phylogeny, the hoatzin (order Opisthocomiformes) was placed sister to the grey crowned crane (order Gruiformes) with 45% BS (Node WW, left phylogeny, Fig. 5a). In the unfiltered phylogeny, the hoatzin is placed sister to Cursorimorphae (Node T, 90% BS, right phylogeny, Fig 5a), a clade that includes grey crowned crane and killdeer (order Charadriiformes) (Node S, 99% BS, right phylogeny).
The deep filtered phylogeny placed the pigeon (order Columbiformes) sister to Phoenicopterimorphae (Node VV, 77% BS, left phylogeny, Fig. 5a), which includes American flamingo (order Phoenicopteriformes) and great-crested grebe (order Podicipediformes). In the unfiltered UCE phylogeny the pigeon is placed sister to the brown mesite (order Mesitornithiformes) and the yellow throated sandgrouse (order Pterocliformes, Node AA), a clade referred to as Columbimorphae (Node BB, 99% BS, right phylogeny). This recovers a monophyletic Columbea clade (Node DD, 73% BS, left phylogeny).
As illustrated in Fig. 5b, for portions of the deep filtered and unfiltered phylogenies with identical topologies, we observed nine nodes with increased bootstrap support and two nodes with decreased support. The Neoaves node has significantly increased support in the deep filtered phylogeny relative to the unfiltered phylogeny (labeled as Neo in Fig. 5b; Node EE, 98% BS, left phylogeny versus OO, 73% BS, left phylogeny, p<0.00005; Fig 5a.). The Afroaves node also had significantly increased support and is described in detail in a preceding paragraph (Fig. 5a).
Besides the increased support for the Neoaves and the Afroaves nodes, we found dramatically increased support for the placement of the bar-tailed trogon (order Trogoniformes) within the clade Eucavitaves (Node D, 100% BS, left phylogeny, versus 66% BS, right phylogeny, p < 0.00005, Fig. 5a and 5b). We found 100% BS support for the Dalmatian pelican-little egret sister relationship (order Pelecaniformes, Node J, Fig. 5a and 5b) while this relationship was only recovered with 90% BS in the unfiltered UCE dataset (p< 0.00005). We observed an increase in support for the sister placement of the MacQueen’s bustard and red-crested turaco by deep filtering relative to no filtering (Node W, 92% BS, left phylogeny, versus 77% BS, right phylogeny, p <0.00005, Fig. 5a and 5b). We also observed very significant increase in support for the Passerea backbone node splitting Otidimorphae from all remaining extant Passerea (labeled as Pass in Fig. 5b; Node MM, 82% BS left phylogeny, versus 56% BS, right phylogeny p<0.00005; Fig. 5a). However, within the Afroaves, we observed a dramatic decrease in support for the Cavitaves + Strigiformes sister relationship (Node GG, 42% BS left phylogeny, versus 100 % BS, right phylogeny, p <0.00005, Fig. 5a and 5b). Within the core waterbirds (Node O) we observed a slight decrease in support for the Procellariimorphae clade (Node M, 93% BS, left phylogeny, versus 100% BS, right phylogeny, p=0.0062, Fig. 5a and 5b).
3.6. Comparison of the deep filtered UCE phylogeny vs. ExaML-TENT phylogeny
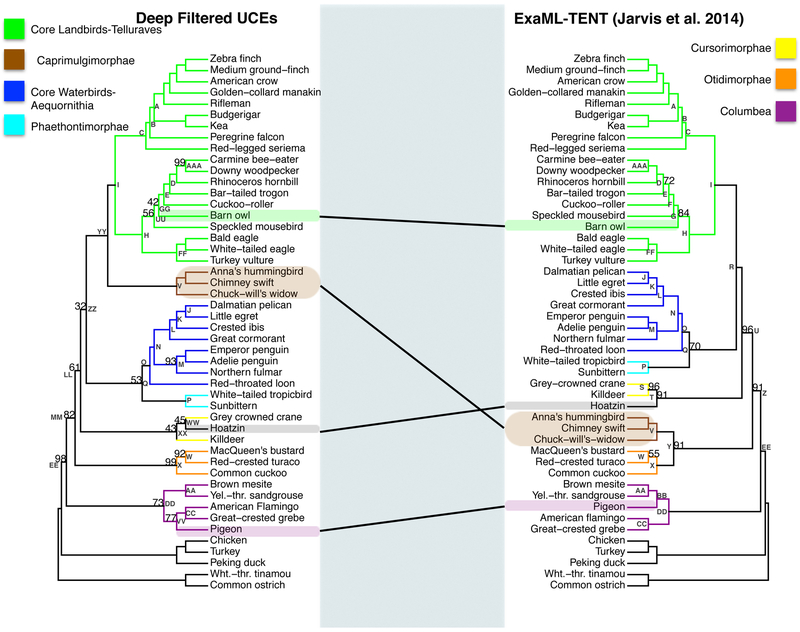
The RF symmetric difference value for the deep filtered UCE phylogeny versus the ExaML-TENT phylogeny is 12 indicating that the topologies are less similar than the shallow phylogeny is to the ExaML-TENT phylogeny but more similar than the unfiltered phylogeny is to the ExaML-TENT phylogeny. Within Telluraves (Node I, Fig. 6a), we found low support for the paraphyly of Coraciimorphae (Node UU, 56% BS, left phylogeny). We found low support for the inclusion of the barn owl (order Strigiformes, Node GG, 42% BS, left phylogeny), which was not included within Coraciimorphae by Jarvis et al. (2014) (Node G, 84% BS right phylogeny). Consequently, the Coraciimorphae+ Strigiformes clade had decreased support when compared to the equivalent ExaML-TENT grouping (Node UU, 56% BS, left phylogeny versus Node G, 84% BS, right phylogeny, p<0.00005). Second, the deep filtered phylogeny did not recover the sister relationship of Caprimulgimorphae (Node V, left phylogeny) to Otidimorphae (Node X, left phylogeny) as was found in ExaML-TENT phylogeny (Node Y, 91% BS, right phylogeny). Third, in the deep filtered phylogeny the placement of the hoatzin (Node WW, 45% BS, left phylogeny) split the sister relationship of the killdeer and grey crowned crane (Node XX, 43% BS, left phylogeny), a clade which was highly supported in the ExaML-TENT phylogeny (Node S, 96% BS, right phylogeny). The placement of the pigeon (Node VV, 77% BS, left phylogeny) as sister to the aquatic Phoenicopterimorphae (Node CC) also differs from its placement in the ExaML-TENT phylogeny (Node BB, 100% BS, right phylogeny).
6.
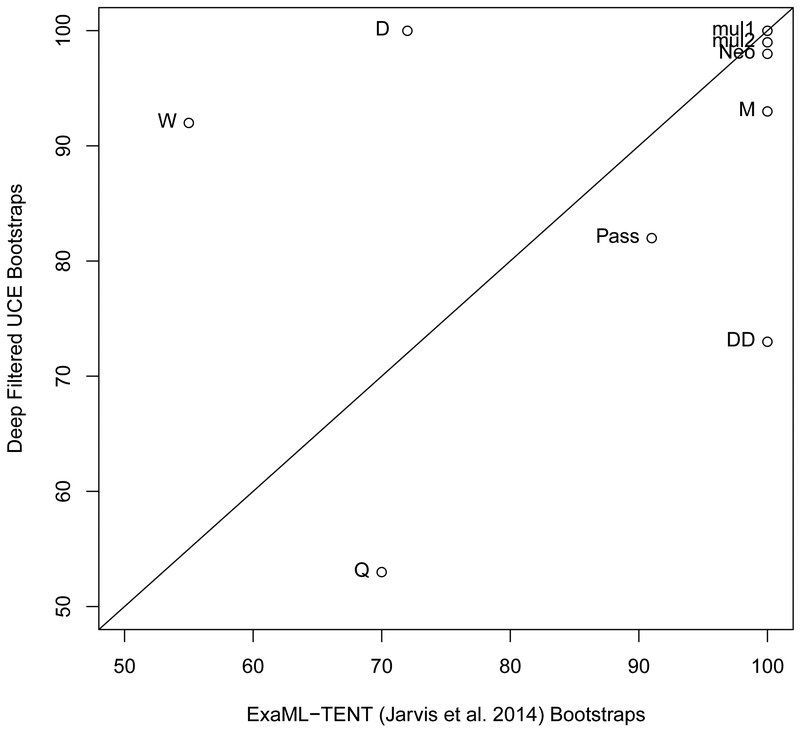
(a) The deep filtered phylogenetic reconstruction (left) and the ExaML-TENT phylogenetic reconstruction. Bootstrap support values less than 100% are shown for each internal node. (b) Scatter plot of percent bootstrap support (BS) when the same clade is supported in the deep filtered UCE phylogeny and the ExaML-TENT phylogeny. The points are labeled with the same node labels as in Fig. 6(a) except for: (1) the label muh, which corresponds to the nodes A, B, C, E, H, J, K, L, N, O, CC, and FF as in Fig. 6(a); (2) the label mul2, which corresponds to the nodes AAA and X in Fig. 6(a) (3) the label Neo, which denotes the neoaves node EE in the deep filtered and the ExaML-TENT phylogeny; and (5) Pass, which denotes the Passerea node MM in the deep filtered phylogeney and Z in the ExaML-TENT phylogeny in Fig. 6(a).
Of the nodes in common, a number of nodes showed no or little change in their strong support (mulI and mu12, Fig. 6b) and 4 nodes exhibited meaningfully decreased support in the deep filtered phylogeny such as the Aequornithia + Phaethontimorphae sister relationship (Node Q, 53% BS, left phylogeny vs. 70% BS, right phylogeny, p=0.0007, Fig. 6b). Within Aequornithia, the core water birds, we also see a slight but significant decrease in support for Procellariimorphae (Node M, 93% BS, left phylogeny vs. 100% BS, right phylogeny, p = 0.0001) as well as a large and significant decrease in support for Columbea (Node DD, 73% BS, left phylogeny vs. 100% BS, right phylogeny, p<0.00005). Two nodes exhibited higher bootstrap support values in the deep filtered phylogeny than the ExaML-TENT phylogeny (Fig. 6a and 6b). These nodes are Node D (100% BS versus 72% BS p-value <0.00005) and Node W (92% BS versus 55% BS p-value < 0.00005).
4. DISCUSSION
Here we find that filtering UCE data can recover relationships originally found with much larger amounts of data and intense computation, but that are not recovered when using the unfiltered UCE data.Relationships recovered include the Columbea + Passerea sister relationship and the Phaethontimorphae + Aequornithia sister relationship. We also find increased statistical support for more recent nodes such as the Pelecanidae + Ardeidae sister relationship, the Eucavitaves clade, and the Otidiformes + Musophagiformes sister relationship.
We were able to recover these relationships because we developed a pipeline that can be used on with large scale genomic datasets to increase the ability of those data to resolve phylogenetically difficult problems. We use this pipeline to find sites in the UCEs that are most appropriate for answering specific questions in neoavian evolution (Fig. 1). The pipeline is available from github.com [https://github.com/PrincessG/Gilbert_et_al_2018]. With the data resulting from our pipeline, we found increased bootstrap support for a number of clades after filtering our UCE data for both deep, and shallow time spans including Eucavitaves, and the Otidiformes + Musophagiformes sister relationship as well as decreases in node support for the Hoatzin+Cursorimorphae clade, the Columbea clade and Passerea (Fig.4b and 6b). These same clades were also found in the much larger and more exhaustive total evidence based ExaML-TENT phylogeny of Jarvis et al. (2014). For clades recovered with high support in both filtered phylogenies we believe, that for these specific clades, we were able to remove sites that carried higher amounts phylogenetic noise.
There were also changes that were not consistently supported by both filtered datasets but which were biologically compelling. The support for the Phaethontimorphae + Aequornithia sister relationship in our deep filtered phylogeny (Node Q, Fig. 5a and 6a) was not observed in the shallow filtered or unfiltered phylogenies. Phaethontimorphae include the tropicbirds and sunbittern while Aequornithia includes the majority of all neoavian waterbirds and together these clades share similar aquatic behaviors and habitats. Additionally, this relationship was also found in the total evidence based phylogeny from Jarvis et al. (2014) and Prum et al. (2015). We suspect deep filtering the UCE sites “turned down the noise” that essentially resolved this relationship incorrectly due to homoplasy or convergence.
Another change that was found in the deep filtered phylogeny but not the shallow filtered, unfiltered or the ExaML phylogenies was the strong placement of Caprimulgimorphae (the hummingbirds, swifts and nightjars) as sister to the all core landbirds, Telluraves (Node YY, Fig. 5a and 6a). This increased support for the Caprimulgimorphae + Telluraves sister relationship contradicts the Aequornithia + Telluraves sister relationship (Node II) recovered in shallow filtered phylogeny (Fig. 3a and 4a). This relationship is intriguing, however, as with all our findings, we acknowledge that this outcome is sensitive to the dates for which we selected the highest signal. Contradictions between our two filtered phylogenies are to be expected as the underlying datasets these topologies are built upon are targeting different time periods. Thus, these topological discrepancies highlight the importance of accurate species divergence estimations, as these estimations heavily impact the subsequently optimized dataset and the resulting phylogenetic reconstructions.
Little is known about filtering non-exonic phylogenomic datasets such as a collection of UCEs to decrease the effects of systematic bias during phylogeny reconstruction. Our study is a step in better understanding how non-exonic sequences can be used. We have shown that filtering UCEs at the base pair level for their signal to noise ratio can increase signal resolution for particular nodes within a target time period. However, it is unclear how support for nodes outside of the targeted range should be interpreted. Being able to resolve divergences at multiple depths across a phylogeny is a strength of UCEs but they, as well as other genome-wide markers, are not immune to the lack of resolution for certain nodes. Some arrangements might be intractable even with large amounts of data if there are too many rapid divergences outside the target region. Likewise, clades with especially patchy fossil records (like birds) reduce the accuracy of their time-calibrated phylogenies and thus the effectiveness of filtering. Bootstrap support depends both on the strength of the relationships and the amount of data used to infer the relationships, so it is possible to filter too aggressively and reduce bootstrap confidence in a correctly inferred clade by leaving too few sites (bases in our case). Another caveat to remember is that filtering and especially eliminating all the invariant sites will likely bias the branch lengths but our focus in this study is on better resolving the topology.
We have shown that by implementing our pipeline and partitioning data on the signal to noise ratio (Townsend et al. 2012), it is possible to increase bootstrap support and recover relationships that otherwise would require much larger datasets. Independent and genomically exhaustive bodies of evidence also supported these recovered relationships. For example, we found the Phaethontimorphae + Aequornithia sister relationship in the deep filtered phylogeny (Node Q) which was not found in the unfiltered phylogeny but was observed in the ExaML phylogeny and independently in Prum et al (2015). But we also have demonstrated that incongruent topologies can be found when datasets composed of sites selected for different target eras are used to answer the same phylogenetic questions. As with exonic data, a non-trivial number of UCE sites have rates that are too fast or too slow to resolve certain nodes.
We did not fully explore what would be the optimum time frame to use in the signal to noise analysis. The filtered data sets we used are not expected to be optimal for all questions. It may be that the deep filtered dataset was too narrow a time span to yield statistically strong improvements in resolving most relationships. Likewise, the shallow filtered dataset may have been too wide. For future studies, we recommend investigating the level of partitioning required to yield high supported, fully resolved nodes along every time span of given phylogeny. A comparison study of filtered UCE data at each important neoavian node could help better resolve evolutionary patterns within Neoaves, especially along those backbone nodes that have undergone a rapid radiation. A more exhaustive sampling of nodes across Neoaves would be helpful. More generally, we find that filtering on signal to noise ratio offers a potentially powerful means for amplifying the strength of phylogenomic data sets to resolve contentious nodes on the tree of life. Given the persistence of these nodes even in the face of whole-genome analyses, we believe that filtering approaches will have important utility in future studies.
Supplementary Material
Noise, polytomy, signal probabilities and adjusted signal (signal to noise ratio) for each UCE nucleotide before and after filtering for sites with the highest adjusted phylogenetic signal during species divergences 27-64MYA.
Substitution rate per site for each UCE nucleotide before and after filtering for sites with the highest adjusted phylogenetic signal during species divergences 27-64MYA.
Noise, polytomy, signal probabilities and adjusted signal (signal to noise ratio) for each UCE nucleotide before and after filtering for sites with the highest signal during species divergences 60-62MYA.
Substitution rate per site for each UCE nucleotide before and after filtering for sites with the highest adjusted phylogenetic signal during species divergences 60-62MYA.
The phylogenetic reconstruction using unfiltered UCEs (left) and the UCE species tree of the 48 bird species from Jarvis et al. (2014) (right). Bootstrap support values less than 100% are shown for each internal node.
Histogram of the fraction of sites selected per UCE for the shallow filtering problem.
Histogram of the fraction of sites selected per UCE for the deep filtering problem.
5. ACKNOWLEDGEMENTS
The authors would like to thank Ms. Tina Marcroft, Dr. Janet Buckner, Mr. David Cerny, and Dr. David A. Gold. PSG is funded by National Institute of Health-Genomic Analysis Training Program T32HG002536. JSS is funded by NIH grant GM053275 and NSF grant DMS 1264153. The programs are available at github [https://github.com/PrincessG/Gilbert_et_al_2018]. The bird silhouettes are available from a free online resource, Super Coloring website (www.supercoloring.com/silhouettes). The author of the woodpecker and penguin was Bob Comix. The author of the hummingbird was Katerina Ryabtseva. The author of the duck was Natasha Sinegina. These works are licensed under a Creative Commons Attribution-Share Alike 4.0 License. The sunbittern drawing is from a free online resource, Wikipedia (https://commons.wikimedia.org/wiki/File:Sunbittern_RWD_white_background.jpg). The author was Dick Daniels (http://carolinabirds.org/) and the work was licensed under a Creative Commons Attribution-Share Alike 3.0 Unported License.
REFERENCES
- Aberer AJ, Alfaro-Nunez A, Braun EL, Burt DW, Cracraft J, da Fonseca RR, Edwards SV, Ellegren H, Faircloth BC, Gilbert MP, Ho SY, Houde P, Howard JT, Jarvis ED, Li C, Liu L, Mindell DP, Mirarab S, Nabholz B, Narula N, Stamatakis A, Suh A, Wang J, Warnow T, Weber CC, Zhang G GigaScience Database. doi: 10.5524/101041 [DOI] [Google Scholar]
- Bandelt H, Dress A, 1986. Reconstructing the shape of a tree from observed dissimilarity data. Adv. Appl. Math 7, 309–343. [Google Scholar]
- Bejerano G, Pheasant M, Makunin I, Stephen S, Kent WJ, Mattick JS, Haussler D, 2004. Ultraconserved Elements in the Human Genome. Science 5675, 1321–1325. [DOI] [PubMed] [Google Scholar]
- Bleidorn C, 2017. Sources of Error and Incongruence in Phylogenomic Analyses, in: Phylogenomics. pp.173–193 [Google Scholar]
- Brown JW, Payne RB, Mindell DP, 2007. Nuclear DNA does not reconcile ‘rocks’ and ‘clocks’ in Neoaves: a comment on Ericson et al. Biol. Lett, 3 257–260. doi: 10.1098/rsbl.2006.0611 [DOI] [PMC free article] [PubMed] [Google Scholar]
- Brown JM, Thomson RC, 2017. Bayes Factors Unmask Highly Variable Information Content, Bias, and Extreme Influence in Phylogenomic Analyses. Syst. Biol 66, 517–530. [DOI] [PubMed] [Google Scholar]
- Chen M, Liang D, Zhang P, 2015. Selecting Question-Specific Genes to Reduce Incongruence in Phylogenomics: A Case Study of Jawed Vertebrate Backbone Phylogeny. Syst. Biol 64, 1104–1120. doi: 10.1093/sysbio/syv059 [DOI] [PubMed] [Google Scholar]
- Claramunt S, Cracraft J, 2015. A new time tree reveals Earth history’s imprint on the evolution of modern birds. Sci. Adv 1, e1501005. [DOI] [PMC free article] [PubMed] [Google Scholar]
- Cracraft J, Houde P, Ho SY, Mindell DP, Fjeldså J, Lindow B, Edwards SV, Rahbek C, Mirarab S, Warnow T, Gilbert MT, Zhang G, Braun EL, Jarvis ED 2015. Response to Comment on “Whole-genome analyses resolve early branches in the tree of life of modern birds”. Science 349, 1460. doi: 10.1126/science.aab1578. [DOI] [PubMed] [Google Scholar]
- Crawford NG, Faircloth BC, McCormack JE, Brumfield RT, Winker K, Glenn TC, 2012. More than 1000 ultraconserved elements provide evidence that turtles are the sister group of archosaurs. Biol. Lett 8,783–786. pmid: doi: 10.1098/rsbl.2012.0331. [DOI] [PMC free article] [PubMed] [Google Scholar]
- Dornburg A, Fisk JN, Tamagnan J, Townsend JP, 2016. PhyInformR: phylogenetic experimental design and phylogenomic data exploration in R. BMC Evol. Biol 16, 262–269. doi: 10.1186/S12862-016-0837-3 [DOI] [PMC free article] [PubMed] [Google Scholar]
- Dornburg A, Townsend JP, Friedman M, Near TJ, 2014. Phylogenetic informativeness reconciles ray-finned fish molecular divergence times. BMC Evol. Biol 14, 169–183. URL http://www.biomedcentral.com/1471-2148/14/169 [DOI] [PMC free article] [PubMed] [Google Scholar]
- Ericson GP, Anderson CL, Britton T, Elzanowski A, Johansson US, Källersjö M, Ohlson JI, Parsons TJ, Zuccon D, Mayr G, 2006. Diversification of Neoaves: integration of molecular sequence data and fossils. Biol. Lett 2, 543–547 doi: 10.1098/rsbl.2006.0523. [DOI] [PMC free article] [PubMed] [Google Scholar]
- Faircloth BC, Branstetter MG, White ND, Brady SG, 2014. Target enrichment of ultraconserved elements from arthropods provides a genomic perspective on relationships among Hymenoptera. Mol. Ecol. Res 15, 489–501. 10.1111/1755-0998.12328. [DOI] [PMC free article] [PubMed] [Google Scholar]
- Faircloth BC, Chang J, Alfaro ME, 2012a. TAPIR Enables High-throughput Estimation and Comparison of Phylogenetic Informativeness using Locus specific Substitution Models. arXiv preprint arXiv:12021215 2012, 1215. [Google Scholar]
- Faircloth BC, McCormack JE, Crawford NG, Harvey MG, Brumfield RT, Glenn TC, 2012b. Ultraconserved Elements Anchor Thousands of Genetic Markers Spanning Multiple Evolutionary Timescales. Syst Biol 61, 717–726. pmid: doi: 10.1093/sysbio/sys004. [DOI] [PubMed] [Google Scholar]
- Faircloth BC, Sorenson L, Santini F, Alfaro ME, 2013. A Phylogenomic Perspective on the Radiation of Ray-Finned Fishes Based upon Targeted Sequencing of Ultraconserved Elements (UCEs). PLoS ONE 8, e65923. doi: 10.137i/journal.pone.0065923. [DOI] [PMC free article] [PubMed] [Google Scholar]
- Feduccia A, 1995. Explosive evolution in tertiary birds and mammals. Science 267, 637–638. [DOI] [PubMed] [Google Scholar]
- Fiorini N, Lefort V, Chevenet F, Berry V, Chifolleau AM, 2014. CompPhy: a web-based collaborative platform for comparing phylogenies. BMC Evol. Biol 253 pmid: doi: 10.1186/S12862-014-0253-5 [DOI] [PMC free article] [PubMed] [Google Scholar]
- Ghee H, 2003. Evolution: ending incongruence. Nature 425, 782. [DOI] [PubMed] [Google Scholar]
- Gilbert PS, Chang J, Pan C, Sobel EM, Sinsheimer JS, Faircloth BC, Alfaro ME, 2015. Genome-wide ultraconserved elements exhibit higher phylogenetic informativeness than traditional gene markers in percomorph fishes. Mol. Phylogen. Evol 92,140–146. [DOI] [PMC free article] [PubMed] [Google Scholar]
- Green RE, Braun EL, Armstrong J, Earl D, Nguyen N, Hickey G, Vandewege MW, St John JA, Capella-Gutiérrez S, Castoe TA, Kern C, Fujita MK, Opazo JC, Jurka J, Kojima KK, Caballero J, Hubley RM, Smit AF, Platt RN, Lavoie CA, Ramakodi MP, Finger JW Jr., Suh A, Isberg SR, Miles L, Chong AY, Jaratlerdsiri W, Gongora J, Moran C, Iriarte A, McCormack J, Burgess SC, Edwards SV, Lyons E, Williams C, Breen M, Howard JT, Gresham CR, Peterson DG, Schmitz J, Pollock DD, Haussler D, Triplett EW, Zhang G, Irie N, Jarvis ED, Brochu CA, Schmidt CJ, McCarthy FM, Faircloth BC, Hoffmann FG, Glenn TC, Gabaldón T, Paten B, Ray DA, 2014. Three crocodilian genomes reveal ancestral patterns of evolution among archosaurs. Science 346,1335–1346. [DOI] [PMC free article] [PubMed] [Google Scholar]
- Hackett SJ, Kimball RT, Reddy S, Bowie RC, Braun EL, Braun MJ, Chojnowski JL, Cox WA, Han KL, Harshman J and Huddleston CJ, 2008. A phylogenomic study of birds reveals their evolutionary history. Science 320,1763–1768. [DOI] [PubMed] [Google Scholar]
- Jarvis ED, Mirarab S, Aberer AJ, Li B, Houde P, Li C, Ho SYW, Faircloth BC, Nabholz B, Howard JT, Suh A, Weber CC, da Fonseca RR, Li J, Zhang F, Li H, Zhou L, Narula N, Liu L, Ganapathy G, Boussau B, Bayzid MS, Zavidovych V, Subramanian S, Gabaldón T, Capella-Gutiérrez S, Huerta-Cepas J, Rekepalli B, Munch K, Schierup M, Lindow B, Warren WC, Ray D, Green RE, Bruford MW, Zhan X, Dixon A, Li S, Li N, Huang Y, Derryberry EP, Bertelsen MF, Sheldon FH, Brumfield RT, Mello CV, Lovell PV, Wirthlin M, Schneider M.P.l.C., Prosdocimi F, Samaniego JA, Velazquez AMV, Alfaro-Núñez A, Campos PF, Petersen B, Sicheritz-Ponten T, Pas A, Bailey T, Scofield P, Bunce M, Lambert DM, Zhou Q, Perelman P, Driskell AC, Shapiro B, Xiong Z, Zeng Y, Liu S, Li Z, Liu B, Wu K, Xiao J, Yinqi X, Zheng Q, Zhang Y, Yang H, Wang J, Smeds L, Rheindt FE, Braun M, Fjeldsa J, Orlando L, Barker FK, Jnsson KA, Johnson W, Koepfli K-P, O′Brien S, Haussler D, Ryder OA, Rahbek C, Willerslev E, Graves GR, Glenn TC, McCormack J, Burt D, Ellegren H, Alstrm P, Edwards SV, Stamatakis A, Mindell DP, Cracraft J, Braun EL, Warnow T, Jun W, Gilbert MTP, Zhang G, 2014. Whole-genome analyses resolve early branches in the tree of life of modern birds. Science 346, 1320–1331. [DOI] [PMC free article] [PubMed] [Google Scholar]
- Jetz W, Thomas GH, Joy JB, Hartmann K, Mooers AO, 2012. The global diversity of birds in space and time. Nature 491, 444–448. [DOI] [PubMed] [Google Scholar]
- Lopez-Giraldez F, Townsend JP, 2011. PhyDesign: an online application for profiling phylogenetic informativeness. BMC Evol. Biol 11, 152. [DOI] [PMC free article] [PubMed] [Google Scholar]
- McCormack JE, Faircloth BC, Crawford NG, Gowaty PA, Brumfield RT, Glenn TC, 2012. Ultraconserved Elements Are Novel Phylogenomic Markers that Resolve Placental Mammal Phylogeny when Combined with Species Tree Analysis. Genome Res 22, 746–754. pmid: doi: 10.1101/gr.125864.111. [DOI] [PMC free article] [PubMed] [Google Scholar]
- McCormack JE, Harvey MG, Faircloth BC, Crawford NG, Glenn TC, Brumfield RT, 2013. A Phylogeny of Birds Based on Over 1,500 Loci Collected by Target Enrichment and High-Throughput Sequencing. PLoS ONE 8, e54848 pmid: doi: 10.1371/journal.pone.0054848. [DOI] [PMC free article] [PubMed] [Google Scholar]
- Mitchell KJ, Cooper A, Phillips MJ, 2015. Science 349, 1460. doi: 10.1126/science.aab1062 [DOI] [PubMed] [Google Scholar]
- Ooms J, 2014. The jsonlite Package: A Practical and Consistent Mapping Between JSON Data and R Objects. arXiv:1403.2805 [stat.CO] URL http://arxiv.org/abs/1403.2805. [Google Scholar]
- Philippe H, Brinkmann H, Lavrov DV, Littlewood DTJ, Manuel M, Worheide G and Baurain D, 2011. Resolving difficult phylogenetic questions: why more sequences are not enough. PLoS Biol, 9, e1000602. doi: 10.1371/journal.pbio.1000602 [DOI] [PMC free article] [PubMed] [Google Scholar]
- Philippe H, Roure B, 2011. Difficult phylogenetic questions: more data, maybe; better methods, certainly. BMC Biology 9, 91–95. http://www.biomedcentral.com/1741-7007/9/91 [DOI] [PMC free article] [PubMed] [Google Scholar]
- Poe S, Chubb AL, 2004. Birds in a bush: Five genes indicate explosive evolution of avian orders. Evolution, 58, 404–415. doi: 10.1111/j.0014-3820.2004.tb01655.x [DOI] [PubMed] [Google Scholar]
- Pond SL, Frost SD, Muse SV, 2005. HyPhy: hypothesis testing using phylogenies. Bioinformatics 21, 676–679. [DOI] [PubMed] [Google Scholar]
- Prum RO, Berv JS, Dornburg A, Field DJ, Townsend JP, Lemmon EM, Lemmon AR, 2015. A comprehensive phylogeny of birds (Aves) using targeted next-generation DNA sequencing. Nature 526, 569–573. [DOI] [PubMed] [Google Scholar]
- R Core Team, 2016. R: A language and environment for statistical computing R Foundation for Statistical Computing, Vienna, Austria: http://www.r-project.org/. [Google Scholar]
- Robinson DR, Fouldes LR, 1981. Comparison of Phylogenetic Trees, Math. Biosci 53, 131–137. [Google Scholar]
- Siepel A, Bejerano G, Pedersen JS, Hinrichs AS, Hou M, Rosenbloom K, Clawson H, Spieth J, Hillier LW, Richards S, Weinstock GM, Wilson RK, Gibbs RA, Kent WJ, Miller W, Haussler D, 2005. Evolutionarily conserved elements in vertebrate, insect, worm, and yeast genomes. Genome Res 15, 1034–1050. [DOI] [PMC free article] [PubMed] [Google Scholar]
- Stamatakis A, 2014. RAxML version 8: a tool for phylogenetic analysis and post-analysis of large phylogenies. Bioinformatics 30, 1312–1313. doi: 10.1093/bioinformatics/btu033 [DOI] [PMC free article] [PubMed] [Google Scholar]
- Suh A, Smeds L, Ellegren H, 2015. The Dynamics of Incomplete Lineage Sorting across the Ancient Adaptive Radiation of Neoavian Birds. PLoS Biol 13, e1002224. doi: 10.1371/journal.pbio.1002224 [DOI] [PMC free article] [PubMed] [Google Scholar]
- Sun K, Meiklejohn KA, Faircloth BC, Glenn TC, Braun EB, Kimball RT, 2014. The evolution of peafowl and other taxa with ocelli (eyespots): A phylogenomic approach. Proc. R. Soc. Lond. B Biol. Sci 281, 20140823. doi: 10.1098/rspb.2014.0823. [DOI] [PMC free article] [PubMed] [Google Scholar]
- Thomas GH, 2015. Evolution: An avian explosion. Nature, 526, 516–517. doi: 10.1038/nature15638. [DOI] [PubMed] [Google Scholar]
- Townsend JP, 2007. Profiling phylogenetic informativeness. Syst. Biol 56, 222–231 [DOI] [PubMed] [Google Scholar]
- Townsend JP, Lopez-Giraldez F, 2010. Optimal selection of gene and ingroup taxon sampling for resolving phylogenetic relationships. Syst Biol, 59, 446–457 doi: 10.1093/sysbio/syq025 [DOI] [PubMed] [Google Scholar]
- Townsend JP and Leuenberger C, 2011. Taxon sampling and the optimal rates of evolution for phylogenetic inference. Syst. Biol, 60, 358–365. [DOI] [PubMed] [Google Scholar]
- Townsend JP, Su Z, Tekle YI, 2012. Phylogenetic Signal and Noise: Predicting the Power of a Data Set to Resolve Phylogeny. Syst. Biol 61, 835–849. [DOI] [PubMed] [Google Scholar]
- Wolfram Research, Inc., 2016. Mathematica, Version 10.4, Champaign, IL. [Google Scholar]
- Yu G, Smith D, Zhu H, Guan Y, Lam TT, 2017. ggtree: an R package for visualization and annotation of phylogenetic trees with their covariates and other associated data. Methods in Ecol. and Evol 8, 28–36. doi: 10.1111/2041-210X.12628 [DOI] [Google Scholar]
- Yuri T, Kimball RT, Harshman J, Bowie RC, Braun MJ, Chojnowski JL, Han KL, Hackett SJ, Huddleston CJ, Moore WS, Reddy S, Sheldon FH, Steadman DW, Witt CC, Braun EL, 2013. Parsimony and Model-Based Analyses of Indels in Avian Nuclear Genes Reveal Congruent and Incongruent Phylogenetic Signals. Biology 2, 419–44. doi: 10.3390/biology2010419 [DOI] [PMC free article] [PubMed] [Google Scholar]
Associated Data
This section collects any data citations, data availability statements, or supplementary materials included in this article.
Supplementary Materials
Noise, polytomy, signal probabilities and adjusted signal (signal to noise ratio) for each UCE nucleotide before and after filtering for sites with the highest adjusted phylogenetic signal during species divergences 27-64MYA.
Substitution rate per site for each UCE nucleotide before and after filtering for sites with the highest adjusted phylogenetic signal during species divergences 27-64MYA.
Noise, polytomy, signal probabilities and adjusted signal (signal to noise ratio) for each UCE nucleotide before and after filtering for sites with the highest signal during species divergences 60-62MYA.
Substitution rate per site for each UCE nucleotide before and after filtering for sites with the highest adjusted phylogenetic signal during species divergences 60-62MYA.
The phylogenetic reconstruction using unfiltered UCEs (left) and the UCE species tree of the 48 bird species from Jarvis et al. (2014) (right). Bootstrap support values less than 100% are shown for each internal node.
Histogram of the fraction of sites selected per UCE for the shallow filtering problem.
Histogram of the fraction of sites selected per UCE for the deep filtering problem.


