

Abstract
Development of the skull bones requires the coordination of two stem progenitor populations, the cranial neural crest cells (CNCC) and head paraxial mesoderm (PM), to ensure cell fate selection and morphogenesis. The epigenetic methyltransferase, Ezh2, plays a role in skull bone formation, but the spatiotemporal function of Ezh2 between the CNCC- and PM-derived bone formation in vivo remains undefined. Here, using a temporally-inducible conditional deletion of Ezh2 in both the CNCC- and PM-derived cranial mesenchyme between E8.5–E9.5, we find a reduction of the CNCC-derived calvarial bones and a near complete loss of the PM-derived calvarial bones due to an arrest in calvarial bone fate commitment. In contrast, deletion of Ezh2 after E9.5 permits PM-derived skull bone development, suggesting that Ezh2 is required early to guide calvarial bone progenitor commitment. Furthermore, exposure to all-trans Retinoic acid at E10.0 can mimic the Ezh2 mutant calvarial phenotype, and administration of the pan retinoic acid receptor (RAR) antagonist, BMS-453, to Ezh2 mutants partially restores the commitment to the calvarial bone lineage and PM-derived bone development in vivo. Exogenous RA signaling activation in the Ezh2 mutants leads to synergistic activation of the anti-osteogenic factors in the cranial mesenchyme in vivo. Thus, RA signaling and EZH2 can function in parallel to guide calvarial bone progenitor commitment by balancing the suppression of anti-osteogenic factors.
Keywords: cell fate selection, skull, mesenchyme stem cells, BMS453, incoherent feedforward loop
Introduction:
The cranial mesenchymal stem cells (CM) give rise to the bones of the head and face and originate from two different cellular origins: the cranial neural crest cells (CNCC) and the paraxial mesoderm (PM) (Jiang et al., 2002; Yoshida et al., 2008). The mammalian CNCC gives rise to the frontal, medial portion of the interparietal, temporal, and some of the facial bones. The PM primarily gives rise to the parietal, lateral portion of the interparietal, and occipital bones (Jiang et al., 2002; Yoshida et al., 2008). The calvarial bone primordia originates from a population of CM located directly above the eye in the supraorbital arch (SOA) and consists of mesenchymal stem cells from both the CNCC and PM. From E12.5 onwards, the SOA-CM expands apically over the brain, and differentiates into the frontal and parietal bones (Ishii et al., 2015; Jiang et al., 2002; Karsenty, 2008; Roybal et al., 2010; Tran et al., 2010; Yoshida et al., 2008). The calvarial bones ossify through intramembranous ossification, which is achieved through the “bone initiation program”. The bone initiation program involves the sequential expression of multiple factors beginning with Msh Homeobox 1 (Msx1) and 2 (Msx2), then Runt-Related Transcription Factor 2 (Runx2), and finally Osterix (Osx/Sp7). Msx1 and 2 expression in CM marks calvarial skeletal mesenchyme, which includes dermal and bone precursors (Han et al., 2007; Satokata and Maas, 1994; Satokata et al., 2000). Runx2 expression leads to cell fate selection into bone progenitors, and Osx expression leads to a commitment of the bone progenitors to a skeletogenic fate (Karsenty and Wagner, 2002; Komori et al., 1997; Nakashima et al., 2002; Nishio et al., 2006). The developmental timing and mechanisms governing the bone initiation program and lineage restriction of the CM in vivo is not fully elucidated.
Multiple signaling pathways are required for the formation and differentiation of the calvarial bone in vivo, including Fibroblast Growth Factor (FGF), Bone Morphogenetic Protein (BMP), Wnt/β-catenin, and Retinoic Acid (RA) signaling (Ishii et al., 2015; Liu et al., 2016). For example, mutations in Wnt/β-catenin signaling lead to a loss of calvarial bone and ectopic chondrogenesis (Goodnough et al., 2012). Disruptions in various BMP and FGF signaling components can lead to numerous skull bone defects ranging from loss of structures to fused bones (Graf et al., 2016; Moosa and Wollnik, 2016; Ornitz and Marie, 2002; Pfaff et al., 2016). Among these pathways, RA signaling is a critical regulator of skull bone development. Modulation of RA signaling levels leads to an inhibition of bone growth, and it is often associated with negatively regulating targets of the Wnt, BMP, and FGF pathways. (Abe et al., 2008; Jiang et al., 2002; Kochhar et al., 1998; Lohnes et al., 1994; Maclean et al., 2009; Morkmued et al., 2017; Savory et al., 2014). The specific mechanism by which RA inhibits skull bone formation is unclear.
The Polycomb Repressive Complex 2 (PRC2) is an important epigenetic regulator in the head and face and requires RA for recruitment to specific genes (Kumar and Duester, 2014). PRC2 mediates the trimethylation of histone 3 on lysine 27 (H3K27me3) and provides positional identity of facial structures by transcriptionally poising many genes required for craniofacial development and cell fate (Lund and Van Lohuizen, 2004; Minoux et al., 2017a; Schuettengruber et al., 2017; Simon and Kingston, 2009). Mutations in the human EZH2 gene, the catalytic component of PRC2, leads to Weaver syndrome, which is characterized by craniofacial defects including domed head and smaller mandible (Gibson et al., 2012; Tatton-Brown et al., 2011). In mice, conditional deletion of the Ezh2 gene in embryos leads to varying craniofacial bone defects depending on the timing and tissue of deletion, demonstrating a developmental-stage specific role for PRC2 (Dudakovic et al., 2015; Schwarz et al., 2014).
In order to understand the function of EZH2 in calvarial bone development at different developmental stages, we conditionally deleted Ezh2 in a stage-specific manner in vivo. We found that Ezh2 is required early and transiently to promote bone progenitor commitment. Inhibition of RA signaling in Ezh2 mutants in vivo rescues calvarial bone development, and RA signaling activation in an E8.5-CMEzh2 background leads to synergistic activation of anti-osteogenic factors. Our results suggest that RA signaling and Ezh2 can function in parallel to balance the suppression of anti-osteogenic factors to permit later differentiation events in the calvarial bone lineage program.
Results:
Inducible deletion of Ezh2 in cranial mesenchyme stem cells leads to stage-specific skull bone defects.
To address the stage-specific role of Ezh2 during the CNCC- and PM-derived skull bone development, we used the tamoxifen-inducible PdgfrαCreER to conditionally activate the Rosa26Reporter (R26R) and delete Ezh2 in the CM prior to skull bone cell fate selection (PdgfrαCreER/+; R26R/+; Ezh2fl/fl). We initiated deletion of Ezh2 in the CM by administering tamoxifen by oral gavage at E8.5 and E9.5 (E8.5-CMEzh2) or E9.5 and E10.5 (E9.5-CMEzh2) (Fig. 1A). Cre-recombination typically occurs within 24 hours after oral administration of tamoxifen. Thus, we estimate that Ezh2 is deleted between E8.5–E9.5 in the E8.5-CMEzh2 mutants and between E9.5–E10.5 in the E9.5-CMEzh2 mutants. β-galactosidase lineage-marked cells were present in the majority of the CNCC-derived (plane I) and PM-derived (plane II) CM by E10.5 and E13.5 (Fig. 1B,C). Both the E8.5-CMEzh2 and E9.5-CMEzh2 gavage regimens were sufficient to induce extensive β-galactosidase expression in the entire cranial mesenchyme containing calvarial bone, dermal fibroblasts, and meningeal progenitors at E13.5 resulting in a dramatic reduction in H3K27me3 positive cells (Fig. S1A-C). In addition, lineage marked cells were also present throughout the facial and dentary mesenchyme. By E13.5, a whole mount phenotype was apparent in the E8.5-CMEzh2 mutants in the form of a reduced mandible and frontonasal prominence leading to severe craniofacial defects by E17.5 (Fig. S2A,B).
Figure 1: Inducible and conditional deletion of Ezh2 at E8.5 in both the CNCC-derived and PM- derived CM.
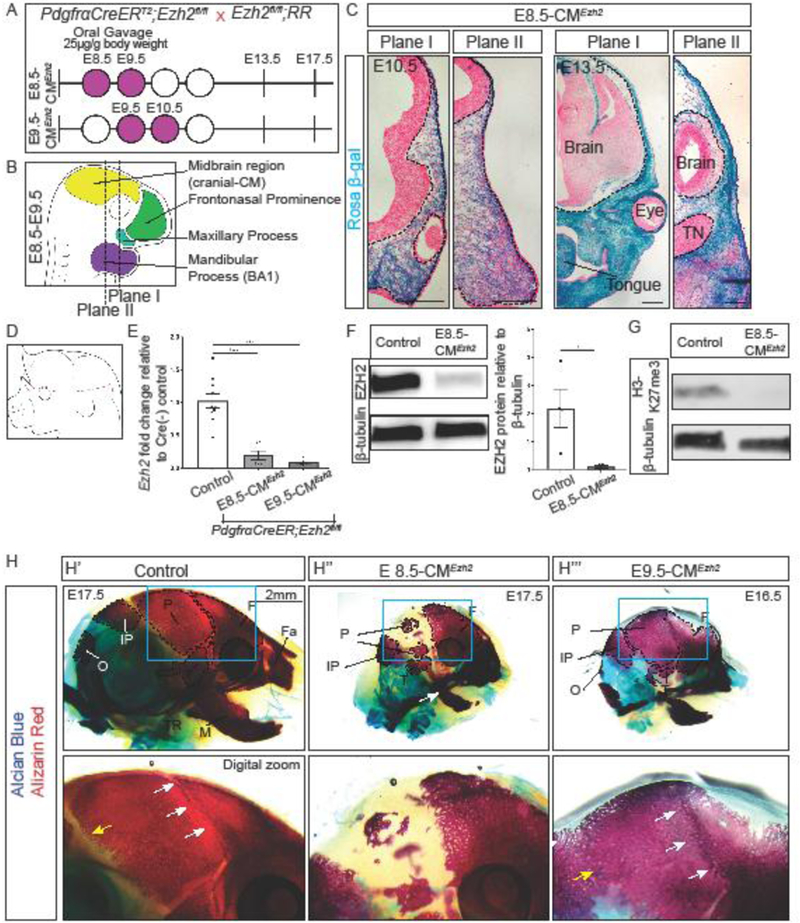
(A) Mating strategy and gavage regimen for conditional Ezh2 deletion for E8.5-CMEzh2 and E9.5-CMEzh2 mutants. Tamoxifen was administered by oral gavage starting at E8.5 or E9.5 (purple shaded) at a concentration of 25µg/g mouse body weight. (B) Anatomy of mouse embryo between E8.5 and E9.5. PdgfrαCreER is active in the CM, frontonasal prominence, maxillary process, and BA1. Plane I corresponds to the future frontal bone, and plane II corresponds to the future parietal bone. (C) PdgfrαCreER/+;Ezh2fl/fl Rosa 26 Reporter lineage-marked CM in coronal sections. E8.5+E9.5 gavages is sufficient to induce Cre-ER recombination in cranial mesenchyme in frontal bone and parietal bone primordia in plane I and plane II, respectively (scale bar = 200µm). (D) Schematic representing manual enrichment of the cranial mesenchyme (CM). The ectoderm was manually removed and all the CM above the eye was collected. (E) RT-qPCR for Ezh2 in the manually enriched CM at E13.5. (F) Western blot for EZH2 in the manually enriched cranial mesenchyme. Band intensities were quantified using ImageJ/Fiji. (G) Western blot for H3K27me3 in manually enriched CM. (H) Whole mount skeletal staining of controls and E8.5-CMEzh2 and E9.5-CMEzh2 mutants at E17.5. All embryos were imaged at the same magnification. White arrows mark the coronal suture and yellow arrow marks the lambdoid suture. F = frontal bone; P = parietal bone; T= temporal; IP = interparietal bone; O = occipital bone; Fa = facial bones; M = mandible, Tympanic ring = TR; TN = Trigeminal neurons.
To quantify the extent of Ezh2 loss, we assayed for Ezh2 mRNA and protein in E8.5-CMEzh2 mutants. We obtained manually-enriched CM by removal of the ectoderm and isolation of the CM leaving the brain intact (Fig. 1D). E13.5 marks the earliest time point by which a sufficiently pure CM population can be isolated by manual dissection for subsequent analyses. Compared to E13.5 controls, we found an 80% reduction in relative amounts of Ezh2 mRNA in E8.5-CMEzh2 and 90% reduction in E9.5-CMEzh2 mutants (Fig. 1E). We obtained 94% reduction in EZH2 protein in E8.5-CMEzh2 mutants (n=4 from 2 litters) (Fig. 1F). To further confirm the loss of EZH2 methyltransferase function, we examined the bulk level of H3K27me3, the repressive histone modification catalyzed by EZH2. Compared to E13.5 Cre-negative control CM, we found a near complete loss of bulk H3K27me3 protein in the CM of E8.5-CMEzh2 mutants (n=4 from 2 litters) (Fig. 1G).
At E17.5, the E8.5-CMEzh2 mutants maintained the reduced mandible and nasal region along with a domed cranium compared to controls (Fig. 1H”). In addition, E8.5-CMEzh2 mutants exhibit shortened limbs, hemorrhaging of larger and smaller blood vessels, and omphalocele of the ventral body wall (Fig. S2C). In order to verify absence of embryonic lethality in our genetic cross, we calculated and obtained the expected ratio of mutants by Mendelian genetics (data not shown, n=39). These results show that E8.5-CMEzh2 leads to pleiotropic effects on multiple structures and craniofacial deformities. Surprisingly, unlike the E8.5-CMEzh2 mutants, the PM-derived skull bones were not lost in the E9.5-CMEzh2 mutant (Fig. 1H”’). We observed ossification in the region of the parietal and occipital bone, suggesting that Ezh2 is not required for the ossification of the PM-derived bones after E10.5. The coronal and lambdoidal suture were not readily visible in the E9.5-CMEzh2 mutants; therefore, we were unable to accurately identify and quantify the area of the frontal, parietal, and interparietal bones individually. It is worth noting, the temporal bone and the tympanic ring were still disrupted in the E9.5-CMEzh2 mutants (Fig. 1H). In addition, the facial bones and mandible remained truncated and the maxilla and premaxilla bones remained fused as previously observed in the E8.5-CMEzh2 mutants.
Together, these phenotypes suggest a developmental stage-specific and transient role of Ezh2 in the formation of the skull bones. Furthermore, these results imply a temporal window between E9.5–10.5 for which Ezh2 is required to promote the formation of PM-derived skull bone formation.
E8.5-CMEzh2 mutants have decreased craniofacial bone volume and size.
To further characterize the skull bone defects following loss of Ezh2, we performed micro-computed tomography (microCT) and morphometric analysis on the skulls of E17.5 controls and E8.5-CMEzh2 mutants. Focusing our analysis on the bones of the calvaria and the dentary bones of the face at E17.5, we found malformations and truncations in most of the - craniofacial bones with a 65% decrease in overall relative bone volume in the mutants (control: 1.0+0.09, mutant: 0.36+0.11; n=3 controls, 4 mutants) (Fig. 2A-C).
Figure 2: E8.5-CMEzh2 leads to truncation of CNCC-derived bones and a severe reduction in PM-derived bones.
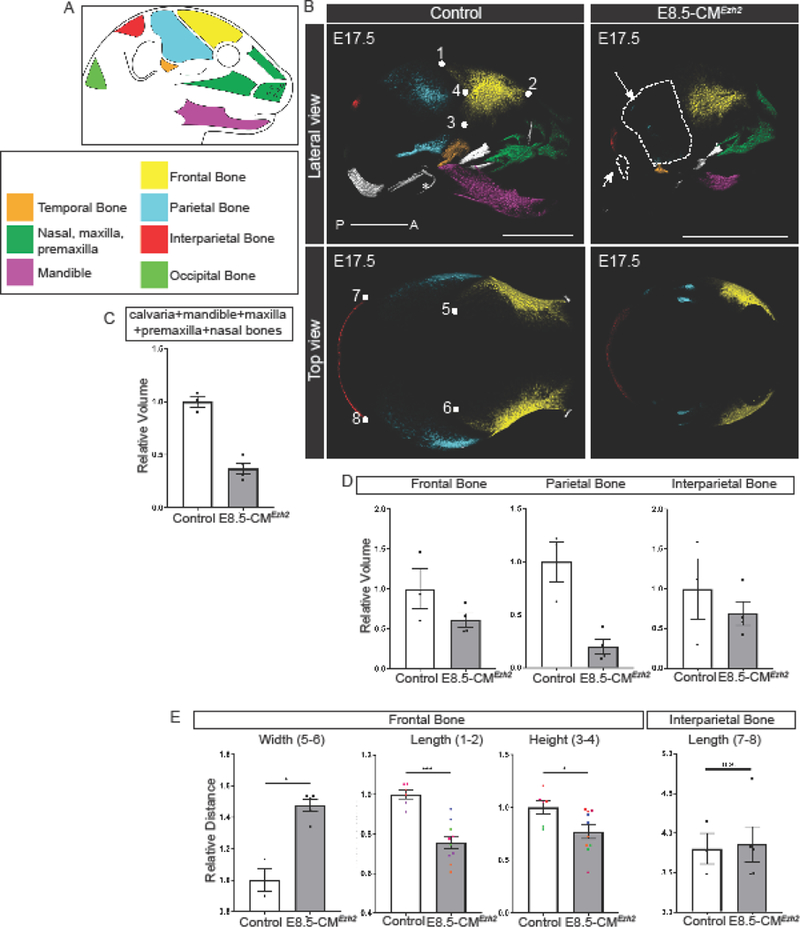
(A) Schematic and key representing the primary bones examined in E8.5-CMEzh2 embryos. (B) Psuedo-colored 3D images from microCT at E17.5 of E8.5-CMEzh2 embryos. * indicates ear bones which are lost in the mutants. Arrows point to the reduced/lost PM-derived bones. Numbers represent landmarks used for morphometric measurements (scale bar = 2mm). (C) Quantification of changes in combined bone volume of the calvaria, mandible, maxilla, premaxilla, and nasal bones. (D) Quantification of changes in bone volume in the bones of the calvaria. (E) Morphometric analysis of the frontal and interparietal bone. Both the left and right frontal bones were measured and plotted. Pairs of colored dots correspond with each left-right pair. Definition of landmarks: (1,5,6) Most posterior-superior point of the frontal bone (2) Most anterior-superior point of the frontal bone (3) Most posterior-inferior point of the frontal bone (4) Most posterior-lateral intersection of the frontal and parietal bone (7,8) Lateral points of the parietal bone.
To quantify the craniofacial bone deformities in more detail, we used the recently described embryonic craniofacial bones landmarks (Ho et al., 2015). The facial bones such as the mandible, maxilla, pre-maxilla, and nasal bones were present, but their morphology was compromised (Fig. 2B, Fig. S3A,B). Relative to the control, the overall length of the mandible (mm) from the most posterior point of the condylar process to the most anterior point of the mandible was decreased by 60% (control: 1.0+0.11, mutant: 0.42+0.05 p=0.04), and bone volume (mm3) was reduced by 83% (control: 1.0+0.04, mutant: 0.17+0.12; n=3 controls, 4 mutants) (Fig. S3A). The combined relative length of maxilla and premaxilla from the posterior-medial point of the palatine process of the maxilla to the most distal point was decreased by 28% in the mutant (control: 1.04+0.08, mutant: 0.74+0.09; p=0.04). The combined relative volume of the nasal, premaxilla and maxilla region was reduced by 42% in the E8.5-CMEzh2 mutant (control: 1.0 +0.28, mutant: 0.61+0.11; n=3 controls, 4 mutants) (Fig. S3B). It is worth noting, we could not clearly identify a separate maxilla and premaxilla bone, and it was unclear whether the premaxilla was missing or if it was fused with the maxilla.
Interestingly, in the calvaria, the some of the CNCC- and most of the PM-derived bones were differentially reduced, indicating variable sensitivity to the deletion of Ezh2. The morphology of the CNCC-derived frontal bone was compromised, and the relative volume was diminished by 39% (control: 0.94+0.43, mutant:0.57+0.17; n=3 controls, 4 mutants). In contrast, the PM-derived parietal bone relative volume was decreased by 85% (control: 1.2+0.33, mutant: 0.16+0.14; n= 3 controls, 4 mutants) and the PM-derived occipital bone was nearly absent in the mutant (Fig. 2B,D). The interparietal bone, which has contributions from both the CNCC and PM, has similar morphology between the controls and mutants, but the relative volume was decreased by 45% in the mutant (control: 1.1+0.66, mutant: 0.61+0.30; n=3 controls, 4 mutants) (Fig. 2D, Fig. S3C). In addition, CNCC-derived temporal bone, inner ear bones, and the tympanic ring were absent in the E8.5-CMEzh2 and E9.5-CMEzh2 (Fig. 2B, 1H). These results demonstrate a sensitivity of the posterior structures, primarily PM-derived, to Ezh2 expression between E9.5 and E10.5.
To further analyze the morphology of the CNCC-derived frontal bone and interparietal bone, we performed morphometric measurements to quantify changes in the relative dimensions of the frontal and interparietal bones (Fig. 2B,E). Relative to the controls, both the length (mm) and height (mm) of the frontal bone were reduced by roughly 25% (length: control: 1.0+0.06, mutant: 0.76+0.10; p=0.0005; height: control: 1.1+0.16, mutant: 0.79+0.2; p=0.03) in the E8.5-CMEzh2 mutants. In addition, the distance (width) between the most posterior-superior points of the left and right frontal bones was increased by 1.5 fold (control: 0.97+0.12, mutant: 1.5+0.08; p=0.04) in the mutants indicating a larger fontanelle. The interparietal bone, despite a decrease in overall volume (Fig. 2D), did not exhibit major changes in morphology with a 4% decrease in relative length in the mutant compared to the control (control: 0.99+0.09, mutant: 0.96+0.05; p=n.s.) (Fig. 2E).
Varying levels of deformities in the mandible, the snout region, and the calvarial bones in the E8.5-CMEzh2 mutant demonstrates the differential effect of Ezh2 deletion in bone formation of different tissue origins. Considering the anterior skull is CNCC-derived and the interparietal bone has contributions from both the CNCC and PM, the greater disruption of the purely PM-derived parietal and occipital bones indicates a sensitivity of the PM to the deletion of Ezh2.
Cell survival and proliferation is not dramatically altered in E8.5-CMEzh2 mutants at E10.5.
Conditional mutants lacking Ezh2 exhibit an overall decrease in bone size and volume in late fetal stages. To examine changes in cell survival and proliferation, we quantified changes in active Caspase-3 and EdU in E8.5-CMEzh2 mutants. At E10.5, quantification of the cells positive for activated Caspase-3 in the CM revealed a modest 2.6% significant increase in plane I (frontal bone primordia) only and comparable numbers to control in plane II (parietal bone primordia) in E8.5-CMEzh2 mutants without significant changes in total cell number in all the examined regions (n=5 controls and 6–8 mutants, 2 litters) (Fig. S4A,B,D). In the frontonasal process, quantification of activated Caspase-3 positive cells showed a more dramatic 8% increase in E8.5-CMEzh2 mutants which could account for the facial bone defects (n=5–7) (Fig. S4E). The cell proliferation index at E10.5, as detected by 5-ethynyl-2´-deoxyuridine (EdU) incorporation, was comparable in all regions (n=5–7, 2–3 litters) (Fig. S4C-E). Additionally, we did not find significant changes in cell survival, proliferation, and total cell number in the CM and in the frontonasal mass at E11.5 and E13.5 (data not shown). In the E9.5-CMEzh2 mutants at E11.5, the total number of cells expressing activated Casapse-3 revealed a 2.6% significant increase in plane I and was comparable in plane II (Fig S4F). Considering both E8.5-CMEzh2 and E9.5-CMEzh2 exhibit small changes in cell survival in the frontal and parietal bone primordia roughly 24 hours after deletion of Ezh2, we deduce that changes in cell survival and proliferation do not fully account for the loss of the parietal bone in the E8.5-CMEzh2 mutants. These results indicate that the loss of calvarial bones is not due to changes in cell survival and proliferation, and that the mechanism by which Ezh2 regulates skull bone formation may differ between individual bones or structures.
E8.5-CMEzh2 mutants exhibit defects in the differentiation of the calvarial bone progenitors.
To further investigate the role of Ezh2 in regulating bone formation in the CM, we next wanted to determine if the defects in the frontal and parietal bones in the E8.5-CMEzh2 mutants result from an arrest in cell fate selection and commitment. Therefore, we examined the expression of genes in the calvarial bone initiation program, which consists of the expression of MSX1/2, RUNX2, and OSX, in the frontal (plane I) and parietal bone (plane II) primordia (n=3–5, from 2 litters) (Fig. 3A) (Karsenty, 2008; Roybal 2010). At E11.5, the cranial mesenchyme marker MSX1/2 which is required for cranial bone had comparable expression domains in both plane I and plane II with a similar number of cells expressing MSX1/2 between controls and E8.5-CMEzh2 mutants (Fig. 3B) (Roybal 2010). At E13.5, the morphology of the RUNX2 domain was shifted ventrally in the frontal bone and less compacted in the parietal bone primordia in the E8.5-CMEzh2 mutants. RUNX2 expression is first step in lineage selection and the establishment of bone progenitors (Karsenty, 2008; Komori et al., 1997). The number of RUNX2 positive cells in plane I and plane II was slightly diminished in the mutants but did not approach statistical significance (Fig. 3C). In addition, the expression domain of bone progenitor markers, alkaline phosphatase (AP), was comparable in both plane I and plane II in the controls and E8.5-CMEzh2 mutants (S5A). These results suggest the disruption in bone formation in E8.5-CMEzh2 mutants was not due to failure to establish the bone progenitors. Next, we examined the expression domain of OSX protein, which is downstream of RUNX2, and is required for cell fate commitment of the bone progenitors to osteoblasts (Karsenty, 2008; Nakashima et al., 2002). In the E8.5-CMEzh2 mutants at E13.5, we found that the OSX-positive expression domain and the number of OSX positive cells were diminished in plane I and nearly absent in plane II (Fig. 3D). In comparison to the E8.5-CMEzh2 mutants, the E9.5-CMEzh2 mutants do not show a noticeable disruption in the establishment of the AP and OSX-positive domains (Fig. S5B and data not shown). Our studies show that Ezh2 is not required for the early specification of the bone progenitors, but for the establishment of OSX positive osteoblasts. In addition, these results further refine the previous models describing the role of EZH2 in skull bone development by identifying a defined developmental window in which Ezh2 is required (Dudakovic et al., 2015; Ferguson et al., 2017; Schwarz et al., 2014).
Figure 3: Arrest during bone differentiation in PM-derived parietal bone in E8.5-CMEzh2 mutants.
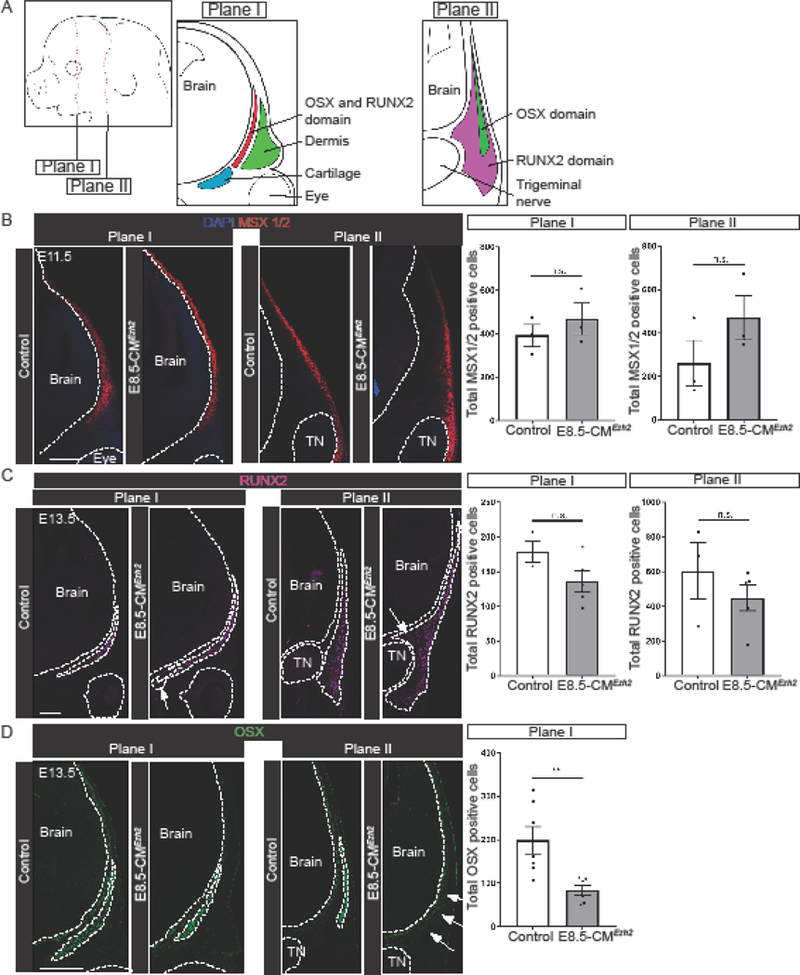
(A) Schematic of E13.5 mouse embryo and coronal sections. Plane I refers to future frontal bone and plane II refers to future parietal bone. (B) Immunofluorescence of bone precursor marker MSX1/2 in E11.5 coronal sections. Quantification of total number of cells positive for MSX1/2 in plane I and plane II. (C) Immunofluorescence for bone progenitor marker RUNX2 in E13.5 coronal sections. Arrows indicate expanded domains. Quantification of total number of cells positive for RUNX2 in plane I and plane II. (D) Immunofluorescence for bone progenitor marker OSX in E13.5 coronal sections. Arrows indicate lost expression in plane II. Quantification for total number of cells positive for OSX in plane I. Quantification in plane II was not performed due to lost expression in the mutant. TN: Trigeminal nerve. Scale bars = 200µm.
Retinoic acid inhibits skull bone formation and is required for Ezh2 expression in the cranial mesenchyme
Since Ezh2 is required between E9.5 and E10.5 for the expression of OSX at E13.5, we next sought to determine if intermediate signaling factors are required for the regulation of the frontal and parietal bones by Ezh2. We queried the literature and found that administration of all-trans RA (at-RA) at E10.0 leads to craniofacial defects strikingly similar to the E8.5-CMEzh2 mutants (Jiang et al., 2002). In addition, mice lacking Cyp26b1, which is required for breakdown of RA, leads to a severe reduction in the skull bones (Maclean et al., 2009). To examine the effects of RA signaling on Ezh2 transcription and E8.5-CMEzh2 phenotype, we took a pharmacological approach to generate conditions of increased RA-signaling in vivo. Consistent with previous studies, administration of all-trans retinoic acid (at-RA) by oral gavage at E10.0 to Cre- control mice resulted in a reduction in the skull bones (Fig. 4A). In E13.5 CM, relative mRNA expression level of HoxA1, a positively regulated transcriptional target of RA signaling, was upregulated nearly 10 fold after oral gavage of at-RA, demonstrating increased activation of RA-signaling (Williams et al., 2005) (Fig. 4B). We found the relative mRNA levels of Ezh2 were upregulated by 5 fold in response to at-RA exposure. Relative to the other PRC2 components, changes in expression levels were specific to Ezh2, as the expression levels of Suz12 and Eed exhibited a modest or no change respectively following administration of at-RA (Fig. 4C). At E17.5, we found reduced area of mineralized frontal and parietal bones. Quantification of the total area of each bone revealed a 60% decrease in the frontal bone and 80% decrease in the parietal bone in the at-RA treated embryos relative to untreated controls. In addition, the facial bones were truncated and the embryos were overall smaller (Fig. 4D; S6A).
Figure 4: Activation of retinoic acid signaling inhibits skull bone formation and positively regulates Ezh2.
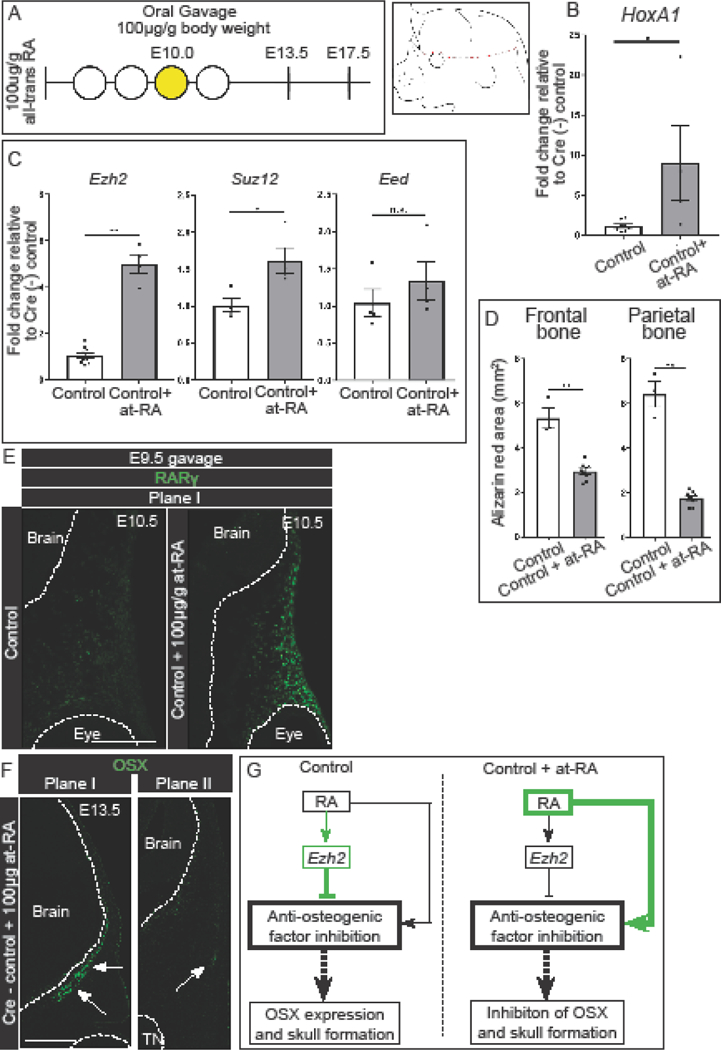
(A) Gavage regimen for at-RA (yellow shaded) in cre- control embryos and schematic for obtaining manually enriched E13.5 CM. At-RA was administered at E10.0. (B) Up regulation of known RA-signaling target, HoxA1, in manually enriched E13.5 CM. (C) Expression levels of PRC2 components in manually enriched CM. (D) Quantification of total area of the frontal and parietal bones in E17.5 skeletal staining. (E) Immunofluorescence for RARγ in the frontal bone primordia of E10.5 at-RA treated cre- control embryos. Embryos were administered at-RA at E9.5. (F) Immunofluorescence for OSX in the frontal and parietal bone primordia of at-RA treated embryos. At-RA was administered at E9.5. White arrows mark OSX+ domain. (G) Summary of the regulation of skull bone formation by Ezh2 and at-RA by which Ezh2 maintain a balance of activation and suppression of anti-osteogenic genes. Following administration of at-RA, the balance is shifted towards activation of anti-osteogenic genes.
We next examined any changes in cell fate commitment following administration of at-RA. Noting that sufficient Cre-recombination in the E8.5-CMEzh2 mutants occurs around E9.5, we next administered at-RA by oral gavage to Cre- controls at E9.5. Administration of at-RA at E9.5 resulted in higher protein expression by immunofluorescence of the RA-sensitive gene, Retinoic Acid Receptor Gamma (RARγ), demonstrating increased RA-signaling in the CM (Fig. 4E) (Balmer and Blomhoff, 2002). Similar to the E8.5-CMEzh2 mutants, administration of at-RA lead to a reduction in OSX expression in the parietal bone (Fig. 4F). This is noteworthy as the disruption of OSX expression is similar E8.5-CMEzh2 mutants, but occurs in samples with increased Ezh2 mRNA levels (Fig4C). Together, these results demonstrate excess RA signaling at E9.5 and 10.0 can mimic the E8.5-CMEzh2 mutant phenotypes, allowing us to test the hypothesis that RA signaling positively regulates and EZH2 negatively regulates the expression of anti-osteogenic factors to promote skull bone formation in a incoherent type-1 feedforward model (I1-FFL) where two arms act in opposition (Alon U, 2007)(Fig. 4G).
In vivo inhibition of retinoic acid signaling partially restores skull bones.
To generate a loss of RA-signaling model, we used a small molecule inhibitor to neutralize RA-signaling at the receptor level. Because RAR-γ is the most abundantly expressed RAR in the CM, and is unaffected by deletion of Ezh2 (n=4), we administered the small molecule inhibitor, BMS-453, by oral gavage to E8.5-CMEzh2 mutants (Fig. 5A; S6B). BMS-453 is an efficient bioavailable antagonist of Retinoic Acid Receptor Alpha (RAR-α) and RAR-γ in vivo with a higher affinity to RAR-γ (Chen et al., 1995; Chung et al., 2011; Matt et al., 2003). At E13.5, in manually enriched CM following administration of BMS-453, we found a dose-dependent decrease in the mRNA levels of the RA signaling target gene, Cellular retinoic acid binding protein2 (Crabp2), in both controls and E8.5-CMEzh2 mutants (n=3–5 from two litters) (Fig. S6C) (Williams et al., 2005). At the 3.5µg/g body weight dosing regimen of BMS-453, the relative level of Crapb2 mRNA was diminished by 50% without prominent drug induced defects as seen with 5µg/g body weight dose (Compare Fig. S6D with S2B). In agreement with the up regulation of Ezh2 expression levels following at-RA treatment (Fig. 4C), administration of 3.5µg/g BMS-453 resulted in a 70% decrease in Ezh2 expression levels in E13.5 manually isolated CM (Fig. 5B). At E17.5, administration of 3.5µg/g BMS-453 treated E8.5-CMEzh2 mutants revealed a partial rescue of the parietal and occipital bone relative to untreated E8.5-CMEzh2 mutants (n=9 from two litters) (Fig. 5C compared to Fig. 1H). Quantification of the relative area of alizarin red stained bone also confirmed the recovery of the parietal bone (Fig. 5D, n=9). We also observed improvement in the extension of the mandible and maxilla bones and partial recovery of the inner ear bones in some treated mutants. In the three E17.5 litters analyzed, the E8.5-CMEzh2 mutants showed a range of rescue of parietal and occipital bone in E8.5-CMEzh2 mutants (Fig. 5C’’, C’’’). In addition, the quantification revealed a small, but statistically significant, decrease in area of the frontal bone of the E8.5-CMEzh2 mutant embryos treated with BMS-453.
Figure 5: Pharmacological inhibition of RA signaling partially rescues the E8.5-CMEzh2 mutant phenotype and restores the PM-derived bones.
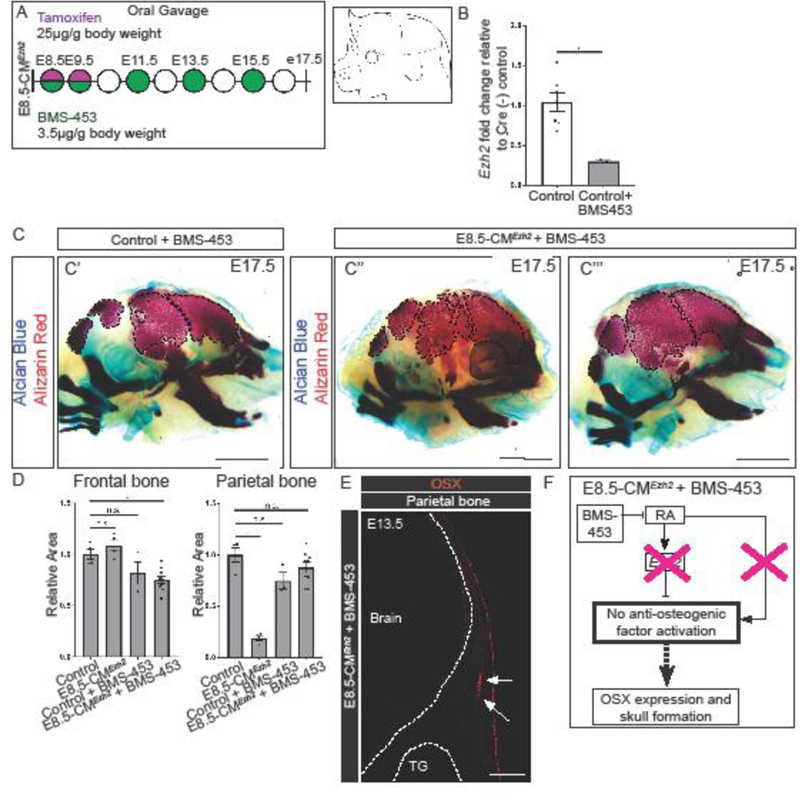
(A) Gavage regimen for tamoxifen and RA-antagonist BMS-453 in E8.5-CMEzh2 mutants and schematic of obtaining manually enriched CM without the ectoderm. (B) RT-qPCR for Ezh2 in Cre- control and BMS-453 treated embryos from E13.5 manually enriched CM. (C) Skeletal staining of E17.5 3.5µg/gm BMS-453 treated Ezh2 mutants. C' and C'' represent two different litters. Alcian blue marks cartilage and alizarin red marks bone (scale bar = 2mm). (D) Quantification of the Alizarin Red stained area outlined in (C) using ImageJ/Fiji. (E) Immunofluorescence of OSX in the parietal bone at E13.5. Arrows indicate partial restoration of OSX (scale bar = 200µm). (F) Schematic with proposed model by which, in the absence of Ezh2, inhibition of RA-signaling prevents the activation of the anti-osteogenic genes restoring OSX expression and skull bone formation.
To determine if BMS-453 treatment restored differentiation of the bone progenitors at E13.5, we examined OSX expression in the parietal bone primordia. Compared to untreated E8.5-CMEzh2 mutants, which lack OSX expression in the parietal bone primordia (Fig. 3D), E8.5-CMEzh2 mutants treated with BMS-453 showed a partial restoration of OSX expression, (Fig. 5E, n=6). The restoration of the posterior PM-derived calvaria bone formation in E8.5-CMEzh2 by RA signaling inhibition, indicate that simultaneous inhibition of the positive and negative arms of I1-FFL is able to partially rescue Osx expression and posterior calvarial bone formation (Fig. 5F). Together, these results demonstrate that tight control of RA-signaling levels is required to ensure skull bone formation, and that Ezh2 transcription is sensitive to RA-signaling.
Deletion of Ezh2 or activation of RA-signaling leads to the up regulation of anti-osteogenic factors.
To identify anti-osteogenic factors regulated by EZH2 and RA, we took a candidate approach to identify changes in gene expression in E8.5-CMEzh2 mutants. (Balmer and Blomhoff, 2002; Creuzet et al., 2002; Hunt et al., 1991; Krumlauf, 1994; Lee et al., 2014; Savory et al., 2014) (Bracken et al., 2006; Mirzamohammadi et al., 2016; Schwarz et al., 2014). In E13.5 manually enriched CM of E8.5-CMEzh2 mutants (Fig. S7A), we did not find significant changes in mRNA levels of Sprouty2, Serpine1, Id1, or Axin2 which are readouts for FGF, TGF-β, BMP, and Wnt signaling pathways, respectively (n=3–8 from two litters) (Fig. S7B). In addition, we did not see changes in the expression of RA signaling pathway components, such as Rar-γ, Stra6, and Crabp2, between controls and E8.5-CMEzh2 mutants at 13.5, suggesting the RA pathway components are not altered in the absence of Ezh2 (Fig. S6B; S7C) (Table S1) (Balmer and Blomhoff, 2002). Surprisingly, of all the other candidate genes queried, only a subset exhibited considerable increase (>10 fold). These include the following: the regional identity Hox genes, the cell cycle regulator, Cyclin-dependent kinase Inhibitor 2a (Cdkn2a), and Hedgehog signaling regulator and positional identity gene, Heart and neural crest derivatives expressed 2 (Hand2) (Table S1). Among the Hox genes queried, we identified HoxA1 and HoxC8 as the most upregulated Hox genes with a ~250-fold and 6–12-fold increase in mRNA levels, respectively (Fig. 6A. S7D) (Table S1) (Dudakovic et al., 2015; Minoux et al., 2017a; Schwarz et al., 2014). Cdkn2a is a known cell cycle regulator, and due to no significant changes in cell proliferation in the CM in E8.5-CMEzh2 mutants, we focused on the Hox genes and Hand2. Both the Hox genes and Hand2 have been shown to be positively regulated by RA and inhibit osteogenesis, highlighting them as potential anti-osteogenic factors responsible for the disruption in the skull bone in the E8.5-CMEzh2 mutants (Fig6A) (Balmer and Blomhoff, 2002; Carroll and Capecchi, 2015; Firulli et al., 2005; Funato et al., 2009; Krumlauf, 1994; Lee et al., 2014).
Figure 6: Ezh2 and RA-signaling maintain a balance of anti-osteogenic genes in the CM.
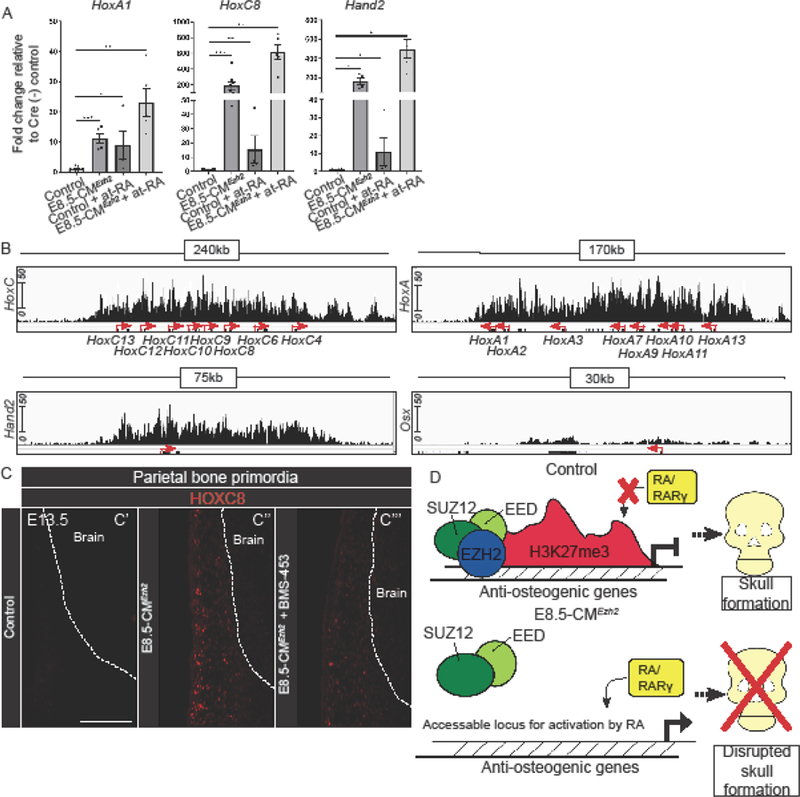
(A) Relative mRNA quantity for HoxA1, HoxC8 and Hand2 expression levels in E13.5 manually enriched CM in Cre- control, E8.5-CMEzh2 mutant, 100µg/gm body weight at-RA exposure at E10.0 in Cre- control, and E8.5-CMEzh2 mutants treated with 100µg/gm at-RA. (B) Integrated Genome Viewer representation of H3K27me3 ChiP-seqencing of E13.5 cranial mesenchyme control. (C) Protein expression of HOXC8 in in the parietal bone primordia of E13.5 control, E8.5-CMEzh2, and 3.5ug/gm body weight treated BMS-453 at E8.5, 9.5, and 11.5. embryo. Scale bars: 200µm. (D) Hypothetical model explaining that EZH2 and RA signaling balance the inhibition of anti-osteogenic factors to ensure calvarial bone commitment and development.
To test if the up regulation of Hox genes and Hand2 following deletion of Ezh2 works independently or synergistically with RA-signaling activation in this context, we administered 100ug/gm body weight of exogenous at-RA to pregnant females carrying wild-type, Cre-control embryos, or E8.5-CMEzh2 at 10.0 (Jiang et al., 2002). At-RA exposure led to significant up regulation of HoxA1, HoxC8, and Hand2, but at lower levels than E8.5-CMEzh2 mutants. Importantly, administration of at-RA to E8.5-CMEzh2 mutants consistently compounded the increase of HoxA1, HoxC8, and Hand2, mRNA levels (Fig. 6A).
To further demonstrate that these anti-osteogenic factors were direct targets of PRC2 in the CM, we analyzed the H3K27me3 enrichment on HoxA1, HoxC8, and Hand2 from our previously published H3K27me3 chromatin immunoprecipitation followed by DNA sequencing (ChIP-seq) dataset (GSE96872) (Ferguson et al., 2017). In E13.5 control CM, the HoxA and HoxC clusters, and Hand2 genes had a blanket H3K27me3 modification across the entire loci in E13.5 cranial mesenchyme (Fig. 6B), indicating they are directly regulated by PRC2. Furthermore, the Osx locus had minimal enrichment of H3K27me3 further supporting the hypothesis that changes in OSX expression in the E8.5-CMEzh2 mutants is due to an indirect mechanism. These results suggest that EZH2 indirectly affects OSX expression. These results also show that RA-signaling and EZH2 can work in parallel to synergistically regulate the expression of specific anti-osteogenic factors in vivo (Balmer and Blomhoff, 2002; Carroll and Capecchi, 2015; Krumlauf, 1994; Lee et al., 2014).
In order to decipher the putative mechanism of the rescued mutants, we tested if ectopic HoxC8 gene expression in E8.5-CMEzh2 mutants was attenuated in the rescued BMS-453-treated E8.5-CMEzh2 mutants. As expected, at E13.5, HOXC8 protein expression was below the levels of detection in untreated and BMS-453-treated control embryos in the region of parietal bone primordia (Fig. 6C’). In contrast, we detected ectopic HOXC8+ cells in the region of parietal bone primordia E8.5-CMEzh2 and in the facial mesenchyme. (Fig. 6C’’ n=4, data not shown). In a comparable region, we observed a qualitatively diminished number of HOXC8+ cells in the rescued BMS-453-treated E8.5-CMEzh2 mutants (Fig. 6C’’’, n=3). These results indicate that RA signaling inhibition can lead to decreased expression of the anti-osteogenic factor, HoxC8, in the E8.5-CMEzh2 mutants and may contribute to rescuing calvarial bone development.
Taken together, these data suggest that EZH2 and RA-signaling must maintain strict balance in activity to synergistically regulate anti-osteogenic factors in order to allow for the commitment to the calvarial bone lineage. Thus, the overlapping phenotypes of E8.5-CMEzh2 mutants and RA pathway mutants suggest they share similar functions in calvarial bone formation allowing us to build a proposed hypothetical model by which Ezh2 promotes skull bone formation (Fig. 6D).
Discussion:
In this study, we examined the basis of the anti-osteogenic effects of Ezh2 deletion and RA signaling activation during calvarial bone differentiation. We found a stage-specific requirement of Ezh2 for OSX expression and directing osteoblast fate commitment in the calvaria. Considering OSX is required for intramembranous ossification in the skull and in the periosteum of long bones, our results highlight a specific role of Ezh2 in intramembranous ossification (Nakashima et al., 2002). We show a restoration of PM-derived skull bones in Ezh2 mutants by inhibiting RA signaling, demonstrating that EZH2 functions to repress anti-osteogenic factors that are poised to be regulated by RA signaling in an incoherent feedforward loop. The critical timing of repression ensures commitment and differentiation of calvarial bone progenitors. We discuss the implications of our findings in more detail below.
The transient role of Ezh2 in impacting the lineage-commitment of calvarial bone progenitors.
The distinct phenotypes at different developmental stages in conditional Ezh2 mutants reveal a developmental stage-specific role of Ezh2 in skull bone formation. Three plausible explanations of this effect are: First, the posterior skull bones develop at a later developmental-stage than the anterior bones. In the SOA, Msx1 and 2 can first be detected in the frontal bone primordia at E10.5 with ossification at E14.0. In comparison, in the parietal bone region, expression of Msx2 only can first be detected in the parietal bone primordia at E11.5 with ossification at E14.5 (Han et al., 2007). Other published conditional mouse Ezh2 mutants support its developmental-stage specific role in impacting the calvarial bone lineage. Loss of Ezh2 in pre-migratory CNCC prior to E8.5 using Wnt1Cre leads to a near complete loss of the CNCC-derived facial and frontal bones (Schwarz et al., 2014). In contrast, loss of Ezh2 in the CNCC and PM from E9.5 using Dermo1Cre does not lead to depletion of H3K27me3 modification and loss of the CNCC and PM-derived bones (Ferguson et al., 2017).
The second possibility is that the anti-osteogenic factors exhibit varying levels of sensitivity to RA-signaling. In vitro, different genes have been demonstrated to have different levels of sensitivity to RA-signaling (Balmer and Blomhoff, 2002; Williams et al., 2005). It is possible the anti-osteogenic are sufficiently up-regulated after the establishment of the bone progenitors and Runx2 expression. As a result, we do not observe changes in the bone initiation program until the OSX expression is disrupted in the CM. Thus, deletion of Ezh2 prior to E10.5 is required to enable sufficient up-regulation of the anti-osteogenic factors. Alternatively, our result does not rule out the distant possibility of a temporal lag in depletion of H3K27me3 modifications and dysregulation of anti-osteogenic factors after the onset of RUNX2 expression. However, the acute changes in cell survival of the frontonasal process mesenchyme at E10.5 in the E8.5-CMEzh2 mutants suggest rapid changes in gene expression following deletion of Ezh2.
A third possibility is that lineage selection of calvarial bone precursors in the CM occurs prior to lineage-specific marker expression. By comparing E8.5-CMEzh2 and E9.5-CMEzh2 mutants, the critical window of lineage-selection of parietal bone progenitors would occur between E9.5 and E10.5, prior to Msx2 expression at E11.5 in the parietal bone primordia. The restricted timing of RA signaling activation and rescue lends evidence to support to this critical temporal window. The concept of lineage selection and restriction before lineage-specific marker expression has also been observed in the premigratory trunk NC in multiple organisms (Dorsky et al., 2000; Krispin et al., 2010; Schilling and Kimmel, 1994). Additional genetic studies with temporally-induced clonal lineage analysis will be required to demonstrate if Ezh2 functions in lineage selection and restriction in the CM before the onset of Msx1 and 2.
Taken together, our results with temporally inducible conditional deletions of Ezh2 reveal a defined temporal window for the commitment to the calvarial bone lineage and further refines the previous model of Ezh2 in craniofacial bone differentiation (Schwarz et al., 2014).
Loss of Ezh2 and increased in RA-signaling synergistically promotes expression of anti-osteogenic factors in the CM in an incoherent feedforward loop.
Previous studies have demonstrated a wide range of craniofacial phenotypes that result from positive and negative modulation of RA signaling. RARα;RARγ compound null mouse mutants have a range of phenotypes from exencephaly to underdeveloped skull bones (Lohnes et al., 1994). Loss of Cyp26B1, a retinoic acid catabolic enzyme, results in truncation of facial and frontal bones and a lack of ossification of the parietal and interparietal bones at E17.5 (Maclean et al., 2009). In our study, at-RA exposure at E10.0 led to a more diminished parietal than frontal bone, which is consistent with previous RA signaling gain of function studies (Jiang et al., 2002; Maclean et al., 2009).
RA signaling activation in the E8.5-CMEzh2 mutant background leads to a compounded increase in target genes with known anti-osteogenic function; thereby, indicating that RA signaling activation and Ezh2 have opposing functions in calvarial bone formation. Interestingly, we also found that activation of RA-signaling increases Ezh2 mRNA expression levels. These results indicate that a balance of RA-signaling and Ezh2 expression is required to maintain skull bone lineage commitment. In agreement with this hypothesis, RA has been shown to recruit PRC2 components and H3K27me3 modification to a Retinoic Acid Responsive Element (RARE) near the promoter of Fgf8 and HoxB1 leading to transcriptional repression (Kumar and Duester, 2014). The binding of RA to a RARE element can mediate transcriptional repression by recruiting PRC2 to specific genes (Kumar and Duester, 2014). In the context of the CM, RA signaling can function with EZH2 in an I1-FFL, where the two arms of the loop can function in opposition (Alon, 2007). In one arm, RA recruits PRC2 to anti-osteogenic factors, resulting in H3K27me3 enrichment and transcriptional repression. In the absence of EZH2, RA can function as a transcriptional activator and induce the expression of anti-osteogenic factors on the other arm. Particularly, I1FFL can generate a pulse effect which can be used to explain the transient and stage-specific role of RA signaling and EZH2 in the commitment of calvarial bone progenitors (Basu et al., 2006). Additional genetic studies with RAR mutants and chromatin immunoprecipitation of CM will be required to tease apart the epistatic and mechanistic relationships between these two major regulators.
The exact mechanism by which RAR antagonism partially rescues E8.5-CMEzh2 mutants is unclear and our results offer clues. We detected substantial increase in a class of known targets genes which appear to be poised to respond dramatically to exogenous RA signaling in the CM, such as HoxA1, HoxC8, and Hand2, in E8.5-CMEzh2 mutants (Balmer and Blomhoff, 2002; Williams et al., 2005; Zhao et al., 2009). Our data suggest RAR signaling inhibition in the E8.5-CMEzh2 mutant can decrease the ectopic expression of well-characterized anti-osteogenic factors such as HoxC8. Additional studies with RARE reporters and Mass-spectroscopy will be required to visualize and quantify the changes in RA signaling in the CM.
In order to determine the anti-osteogenic role of HoxA1, HoxC8, and Hand2, future studies using functional mouse genetics and gene expression profiling in CNCC- and PM-specific CM of E8.5-CMEzh2 mutants are required. The Hox genes are a well-established target of PRC2 mediated transcriptional repression in multiple cell types in vitro and in the CM in vivo (Dudakovic et al., 2015; Ferguson et al., 2017; Minoux et al., 2017b; Schwarz et al., 2014). In addition, numerous Hox genes are well known targets of RA-signaling (http://www.uniprot.org/uniprot/Q15910) (Balmer and Blomhoff, 2002; Krumlauf, 1994). In our E8.5-CMEzh2 mutants, we identified an up regulation of multiple Hox genes in the E13.5 CM, which is Hox-negative in controls. It is possible that the ectopic expression of a specific Hox gene or multiple Hox genes may lead to a change in regional identity and results in the loss of skull bones. Out of the Hox genes queried, HoxC8 was the most significantly increased Hox gene which may have an anti-osteogenic function in calvarial bone. In vivo, conditional misexpression of HoxC8 in the head and face CM leads to a near complete loss of skull bones and a truncation of the face resembling our E8.5-CMEzh2 mutants (Carroll and Capecchi, 2015). We also observed attenuated expression of HOXC8 protein expression in the CM of the parietal bone region following inhibition of RA signaling. Future studies that genetically alter HoxC8 gene dosage in E8.5-CMEzh2 mutants would be required to demonstrate that up regulation of a single, regionally expressed Hox gene mediates the phenotype in E8.5-CMEzh2 mutants. Follow up biochemical and proteomic studies will also be required to reveal the anti-osteogenic mechanism of HOXC8. Alternatively, the combinatorial effect of the ectopic expression of multiple Hox genes could lead to the bone defects observed in our E8.5-CMEzh2 mutants. In addition to HoxC8, we also observed an up regulation of multiple other Hox genes that could negatively affect skull bone development in our E8.5-CMEzh2 mutants. For example, HoxA1 −/− mutants have craniofacial defects and HoxA1 transcription is responsive to retinoic acid in CM (Fig. S7) (Balmer and Blomhoff, 2002; Boylan et al., 1993; Boylan et al., 1995). In zebrafish, HoxA1 overexpression or exogenous administration of at-RA leads to an identity switch of the first branchial arch (Alexandre et al., 1996; Hill et al., 1995). It is worth noting, HoxA2, the Hox gene often associated with bone inhibition, was not significantly upregulated in our E8.5-CMEzh2 mutants (Fig. S7) (Grammatopoulos et al., 2000; Trainor and Krumlauf, 2001).
HAND2 is a basic helix-loop-helix transcription factor that may function as a negative regulator of intramembranous bone formation. HAND2 protein has been shown to directly bind to RUNX2 protein and prevent its transactivation function (Funato et al., 2009). Hand2 transcription is positively regulated by teratogenic doses of RA signaling, and HAND2 protein can function as an upstream regulator of Hedgehog signaling which can negatively regulate bone (Abzhanov et al., 2007; Charité et al., 2000; Galli et al., 2010; Zhao et al., 2009). Thus, future studies focusing on reducing the dosage of Hand2 in our E8.5-CMEzh2 mutants will be required to demonstrate if HAND2 is a key component of an anti-osteogenic network that is repressed by EZH2 during intramembranous bone differentiation. Along with the Hox genes and Hand2, the dysregulation of additional unidentified anti-osteogenic factors could result in a loss of skull bones in the Ezh2 mutants. A systematic effort will be required to identify new anti-osteogenic targets of Ezh2 in CNCC- and PM-derived CM using developmental stage-specific mutants with new inducible lineage-specific genetic tools.
In this study, we show that stage-specific conditional loss of Ezh2 in the CM can be neutralized by small molecule antagonism of RAR, providing evidence that EZH2 in the CM is required for repressing the expression of anti-osteogenic factors that are poised to respond to RA signaling in a I1FFL. Our data provide new insights into the dynamic formation of calvarial bones highlighting the spatial and temporal differences in successful progression of osteogenesis during intramembranous bone formation.
Methods:
Mice:
PdgfrɑCreER (JAX stock #018280) (Rivers et al., 2008), Rosa26 Reporter (AX stock #003309) (Soriano,1999), and Ezh2 floxed (Ezh2fl) (JAX stock #022616) (Shen et al., 2008). For timed matings, PdgfrɑCreER;Ezh2fl/fl males were crossed with R26R/R26R; Ezh2fl/fl females overnight. Mice were checked for vaginal plugs and then separated in the morning. Vaginal plug day was assigned as embryonic (E) 0.5. CreER recombination was induced by oral gavage at 25ug Tamoxifen/g body weight (BW) (Sigma T5648) to pregnant dams. Tamoxifen was dissolved in corn oil and administered at 5 p.m. of the designated day. For each experiment, a minimum of five mutants with litter-matched Cre negative controls from two to three litters were studied unless otherwise noted. Case Western Reserve University Institutional Animal Care and Use Committee approved all animal procedures in accordance with AVMA guidelines (Protocol 2013–0156, Animal Welfare Assurance No. A3145–01).
Histology, β-Galactosidase, and Immunohistochemistry:
Heads of E10.5–13.5 embryos were drop-fixed in 4% paraformaldehyde (PFA) for 20–35 min, respectively, at 40C and cryopreserved as previously described (Atit et al., 2006). Embryos were cryosectioned at 10 microns in the coronal plane in the frontal and parietal bone primordia. β-galactosidase staining on cryosections was performed as previously described (Rivera-Perez et al., 1999).
For immunofluorescence on cryosections, sections were dried at room temperature, washed in 1x PBS and blocked in goat serum or donkey serum. For mouse raised antibodies, block buffer from the Vector M.O.M Kit (BMK-2202) was used. Primary antibodies were incubated overnight at 4°C, washed next day in 1x PBS, incubated with species- specific secondary antibody (below) for one hour at room temperature, and then washed with DAPI 0.5µg/mL, and mounted with Fluoroshield (Sigma F6057).
For immunofluorescence, the following primary antibodies were used: rabbit anti-H3K27me3 (1:1000; Cell Signaling 9733, Antibody registry: AB_26160629), Rabbit anti-Caspase3 (1:250; Abcam13847, Antibody registry: AB_443014), Rabbit anti-OSX (1:1000 Abcam ab94744, Antibody registry: AB_10674971), mouse anti-MSX1/2 (DSHB 4G1, Antibody registry: AB_531788 ), goat anti-RUNX2 (1:250 R&D AF2006, Antibody registry: AB_2184528) rabbit anti-HOXC8 (1:500, Abcam ab86236, Antibody registry: AB_1925078), rabbit anti-RARG (1:1000, Cell Signaling D3A4, Antibody registry: AB_10998934). Appropriate species-specific Alexafluor secondary antibodies were used (1:500; Invitrogen). Images were captured using the Olympus BX60 microscope and Olympus DP70 digital camera using DC controller software. Confocal images were captured on the Leica TCS SP8 (Leica Biosystems) using Application Suite X software (Leica Biosystems). Images were processed in Adobe Photoshop and Fiji/ImageJ (Schindelin et al., 2012; Schneider et al., 2012).
For alkaline phosphatase staining, sections were then washed in PBS-T (0.1% Tween-20 in PBS) for 10 minutes, then TBS-T (0.1% Tween-20 in TBS) for 10 minutes, then washed in NTMT (100mM Tris, pH 9.4, 100mM NaCl, 60mM NgCl2, and 0.02% Tween-20) for 10 minutes. Embryos were stained 20µl/mL NBT/BCIP (Roche 11681451001) in the dark for 20 min. at RT. Slides were then washed in PBS and mounted with aqueous mounting medium.
RT-qPCR:
At E13.5, the supraorbital cranial mesenchyme was isolated by manual dissection. Following manual removal of the ectoderm, an incision was made around the circumference of the neurocranium, and the tissue covering the brain was manually disassociated. The CM isolated consists of the neural crest and mesoderm derived cranial mesenchyme. RNA was isolated as previously described (Hamburg-Shields et al., 2015). Relative mRNA expression was quantified using 5 ng of cDNA on a StepOne Plus Real-Time PCR System (Life Technologies) and the ΔΔCT method (Schmittgen and Livak, 2008). Commercially available TaqMan probes (Life Technologies) specific to each gene were used (Table S1). CT values were normalized to β-actin (Invitrogen 4352663). ΔΔCT values were obtained by normalizing the ΔCT values to the average ΔCT values of the controls. Relative mRNA fold change was determined using the ΔΔCT values.
Protein Isolation and immunoblotting
E13.5 cranial mesenchyme was enriched and collected by manual dissection as described above. Protein was isolated using RIPA buffer. Proteins were separated by SDS-PAGE using Mini-PROTEAN TGC gels (BioRad #456–1084). Western Blots were performed with the following primary antibodies: rabbit anti-H3K27me3 (1:1000, Cell Signaling 9733) and rabbit anti-EZH2 (1:500, Cell Signaling #5246). Species-specific HRP-conjugated secondary antibodies were used at 1:10,000. Immunoblots were probed with anti-β-TUBULIN (1:400, Santa Cruz 9104) as a loading control. Protein was detected using an Amersham ECL Western Blotting Analysis System (GE Healthcare RPN2109), and imaged using an Odyssey FC Imaging System (Li-Cor). Relative protein levels were quantified using Image J/ Fiji.
MicroCT:
E17.5 heads were fixed and stored in 95% ethanol for at least 24 hours. Heads were then re-hydrated overnight in PBS for 24 hours prior to imaging. MicroCT images were acquired using a Bruker SkyScan1172 (Bruker MicroCT, Kontich, Belgium) with an 11 MPix camera at an isotropic voxel size of 20 µm3 employing an 0.5mm-thick aluminum filter. An applied x-ray tube voltage of 50 kV with an x-ray intensity of 100 µA was applied over 180 degrees of rotation with acquisition every 0.7 degrees. Camera pixel binning of 4×4 was applied. Reconstruction was carried out with a modified Feldkamp algorithm using the SkyScan NRecon software (Feldkamp et al., 1984; Yan et al., 2008). Ring artifact reduction of 5 and beam hardening correction of 10 were applied. MicroCT 3D images were visualized using CTvox (BrukerMicroCT). Images were pseudo-colored in Adobe Photoshop. Quantification was performed using Amira 6.01 (Thermo Fisher Scientific) using the “Materials Statistics” tool.
Whole mount skeletal preparation:
All steps were performed at room temperature. Embryos were fixed in 95 % ethanol overnight. Samples were then placed in acetone overnight. Embryos were then placed in alcian blue (Sigma A5268) dissolved in 80 % ethanol, 20 % (glacial) acetic acid at a concentration of 0.03 % overnight. The embryos were then de-stained by two thirty minute washes in 70 % ethanol and then incubated them in 95 % ethanol overnight. The embryos were pre-cleared in a 1 % potassium hydroxide (KOH) (Fisher Scientific 1310–58-3) solution for one hour. Embryos were then placed in a 0.005 % alizarin red (Sigma A5533) dissolved in 1% KOH overnight. The embryos were then placed in a 50 % glycerol (Fisher 56-81-5): 50 % (1 %) KOH solution until clear. The average time was one week to become fully cleared. Once cleared, the embryos were then placed in 100% glycerol for long-term storage and imaging. Skeletal preparations were imaged Leica MZ16F stereoscope and Leica DFC490 camera with Leica software.
Cell Proliferation/Death Assay:
Mice were administered 250µg EdU in PBS/10g mouse weight by intraperitoneal injection one hour prior to sacrifice. Embryos were then collected and prepared for cryopreservation as stated above. EdU was detected using Click-iTEdU Alexa Fluor 488 Imaging Kit (Invitrogen #C10337) according to manufacturer’s protocol. Images were captured using the Olympus BX60 microscope and Olympus DP70 digital camera using DC controller software. The percent of EdU positive cells was quantified using ImageJ/Fiji. Cell death was detected using activated Caspase-3 (stated previously) by immunofluorescence. For quantification, images were converted to 8-bit and background was removed with a 10 pixel “rolling ball”. A signal threshold was auto set. Individual cells were determined using “watershed” and cells were then counted using “count particles”.
Retinoic acid signaling activation and inhibition:
At-RA (Sigma R2625) was reconstituted in DMSO at 100mg/ml and diluted in peanut oil, and administered at 100µg/gm of body weight by oral gavage on E9.5 or E10.0. BMS-453 (Cayman Chemical, #19076) was administered by oral gavage to pregnant dams carrying embryos at E8.5, E9.5, E11.5, E13.5, and E15.5. BMS-453 was reconstituted in DMSO at 10µg/µl, diluted in corn oil, and administered at 3.5µg/gm or 5µg/gm of body weight of mouse. For oral gavage on day of tamoxifen administration, the corn oil used to dilute also contained tamoxifen.
Statistics:
All graphs and statistical analysis were generated using Prism 6 (GraphPad Software). Data are presented as mean ± SEM in all graphs. All pairwise sample comparisons were performed using a Mann-Whitney test. The p-values for statistical tests in all figures are represented as: * = P < 0.05, ** = P < 0.01, and *** = P < 0.001.
Supplementary Material
Highlights:
Ezh2 is required in a development stage-specific manner in the mouse cranial mesenchyme to promote calvarial bone lineage commitment.
RA signaling inhibitors can partially rescue the loss of calvarial bones in Ezh2 mutants
Ezh2 is required to suppress the expression of anti-osteogenic factors which are poised to be induced by Retinoic acid signaling in an incoherent type-1 feedforward loop(I1-FFL).
Acknowledgments:
Thanks to previous and current members of the Atit laboratory, Drs. Veronique Lefebvre, Edward Greenfield, and Clay Spencer for excellent discussion and advice. We thank Sai Thulabandu for his assistance with mouse work and experiments. We thank Gregg DiNuoscio for genotyping, immunostaining, and technical assistance, and Samuel Pan and Vidhi Mendpara for their assistance with sectioning tissues. We thank Bryan Hausman in the CWRU Orthopedics department for microCT imaging. We thank the CWRU SOM Light Microscopy Core Facility.
Funding: This work was supported by the following grants: NIH National Institute of Dental and Craniofacial Research R01 DE-01870 (R.P.A.), National Institutes of Health (NIH) T32 AR-007505 (J.F.), the Case Western Reserve University ENGAGE (M.D.) and SOURCE Programs (M.D.), and NIH Grant S10-OD016164 (CWRU SOM Light Microscopy Core Facility).
Footnotes
Publisher's Disclaimer: This is a PDF file of an unedited manuscript that has been accepted for publication. As a service to our customers we are providing this early version of the manuscript. The manuscript will undergo copyediting, typesetting, and review of the resulting proof before it is published in its final citable form. Please note that during the production process errors may be discovered which could affect the content, and all legal disclaimers that apply to the journal pertain.
Conflict of interest: The authors declare that they have no competing interests.
References:
- Abe M, Maeda T and Wakisaka S (2008). Retinoic acid affects craniofacial patterning by changing Fgf8 expression in the pharyngeal ectoderm. Dev. Growth Differ 50, 717–729. [DOI] [PubMed] [Google Scholar]
- Abzhanov A, Rodda SJ, McMahon AP and Tabin CJ (2007). Regulation of skeletogenic differentiation in cranial dermal bone. Development 134, 3133–3144. [DOI] [PubMed] [Google Scholar]
- Alexandre D, Clarke JDW, Oxtoby E, Yan Y-L, Jowett T and Holder N (1996). Ectopic expression of Hoxa-1 in the zebrafish alters the fate of the mandibular arch neural crest and phenocopies a retinoic acid-induced phenotype. Development 122, 735–746. [DOI] [PubMed] [Google Scholar]
- Alon U (2007). Network motifs: theory and experimental approaches. Nature Rev Genetics 8, 450–461. [DOI] [PubMed] [Google Scholar]
- Atit R, Sgaier SK, Mohamed OA, Taketo MM, Dufort D, Joyner AL, Niswander L and Conlon RA (2006). β-Catenin Activation Is Necessary and Sufficient To Specify the Dorsal Dermal Fate in the Mouse. Dev. Biol 296, 164–176. [DOI] [PubMed] [Google Scholar]
- Balmer JE and Blomhoff R (2002). Gene expression regulation by retinoic acid. J. Lipid Res 43, 1773–808. [DOI] [PubMed] [Google Scholar]
- Basu S, Mehreja R, Thiberge S, Chen MT and Weiss R (2004) Spatiotemporal control of gene expression with pulse-generating networks. Proc. Natl. Acad.Sci. USA 101, 6355–6360. [DOI] [PMC free article] [PubMed] [Google Scholar]
- Boylan JF, Lohnes D, Taneja R, Chambon P and Gudas LJ (1993). Loss of retinoic acid receptor gamma function in F9 cells by gene disruption results in aberrant Hoxa-1 expression and differentiation upon retinoic acid treatment. Proc. Natl. Acad. Sci. U. S. A 90, 9601–5. [DOI] [PMC free article] [PubMed] [Google Scholar]
- Boylan JF, Lufkin T, Achkar CC, Taneja R, Chambon P and Gudas LJ (1995). Targeted disruption of retinoic acid receptor alpha (RAR alpha) and RAR gamma results in receptor-specific alterations in retinoic acid-mediated differentiation and retinoic acid metabolism. Mol. Cell. Biol 15, 843–51. [DOI] [PMC free article] [PubMed] [Google Scholar]
- Bracken AP, Dietrich N, Pasini D, Hansen KH and Helin K (2006). Genome-wide mapping of polycomb target genes unravels their roles in cell fate transitions. Genes Dev 20, 1123–1136. [DOI] [PMC free article] [PubMed] [Google Scholar]
- Carroll LS and Capecchi MR (2015). HOXC8 initiates an ectopic mammary program by regulating Fgf10 and Tbx3 expression, and Wnt/β-catenin signaling. Development dev 128298-. [DOI] [PMC free article] [PubMed]
- Charité J, McFadden DG and Olson EN (2000). The bHLH transcription factor dHAND controls Sonic hedgehog expression and establishment of the zone of polarizing activity during limb development. Development 127, 2461–2470. [DOI] [PubMed] [Google Scholar]
- Chen JY, Penco S, Ostrowski J, Balaguer P, Pons M, Starrett JE, Reczek P, Chambon, and Gronemeyer H (1995). RAR-specific agonist/antagonists which dissociate transactivation and AP1 transrepression inhibit anchorage-independent cell proliferation. EMBO J 14, 1187–1197. [DOI] [PMC free article] [PubMed] [Google Scholar]
- Chung SSW, Wang X, Roberts SS, Griffey SM, Reczek PR and Wolgemuth DJ (2011). Oral administration of a retinoic acid receptor antagonist reversibly inhibits spermatogenesis in mice. Endocrinology 152, 2492–2502. [DOI] [PMC free article] [PubMed] [Google Scholar]
- Creuzet S, Couly G, Vincent C and Le Douarin NM (2002). Negative effect of Hox gene expression on the development of the neural crest-derived facial skeleton. Development 129, 4301–4313. [DOI] [PubMed] [Google Scholar]
- Dorsky RI, Moon RT and Raible DW (2000). Environmental signals and cell fate specification in premigratory neural crest. BioEssays 22, 708–16. [DOI] [PubMed] [Google Scholar]
- Dudakovic A, Camilleri ET, Xu F, Riester SM, McGee-Lawrence ME, Bradley EW, Paradise CR, Lewallen EA, Thaler R, Deyle DR, et al. (2015). Epigenetic control of skeletal development by the histone methyltransferase Ezh2. J. Biol. Chem 290, 27604–27617. [DOI] [PMC free article] [PubMed] [Google Scholar]
- Feldkamp LA, Davis LC and Kress JW (1984). Practical cone-beam algorithm. J. Opt. Soc. Am. A 1, 612–619. [Google Scholar]
- Ferguson J, Devarajan M, DiNuoscio G, Saiakhova A, Liu C-F, Lefebvre V, Scacheri P and Atit RP (2017). PRC2 is Dispensable in Vivo for β-Catenin-Mediated Repression of Chondrogenesis in Mouse Embryonic Cranial Mesenchyme. G3: Genes|Genomes|Genetics 8, g3.300311.2017. [DOI] [PMC free article] [PubMed] [Google Scholar]
- Firulli BA, Krawchuk D, Centonze VE, Vargesson N, Virshup DM, Conway SJ, Cserjesi P, Laufer E and Firulli AB (2005). Altered Twist1 and Hand2 dimerization is associated with Saethre-Chotzen syndrome and limb abnormalities. Nat. Genet 37, 373–81. [DOI] [PMC free article] [PubMed] [Google Scholar]
- Funato N, Chapman SL, McKee MD, Funato H, Morris JA, Shelton JM, Richardson JA and Yanagisawa H (2009). Hand2 controls osteoblast differentiation in the branchial arch by inhibiting DNA binding of Runx2. Development 136, 615–625. [DOI] [PubMed] [Google Scholar]
- Galli A, Robay D, Osterwalder M, Bao X, Bénazet JD, Tariq M, Paro R, Mackem S and Zeller R (2010). Distinct roles of Hand2 in initiating polarity and posterior Shh expression during the onset of mouse limb bud development. PLoS Genet 6,. [DOI] [PMC free article] [PubMed] [Google Scholar]
- Gibson WT, Hood RL, Zhan SH, Bulman DE, Fejes AP, Moore R, Mungall AJ, Eydoux P, Babul-Hirji R, An J, et al. (2012). Mutations in EZH2 cause weaver syndrome. Am. J. Hum. Genet 90, 110–118. [DOI] [PMC free article] [PubMed] [Google Scholar]
- Goodnough LH, Chang A, Treloar C, Yang J, Scacheri PC and Atit RP (2012). Twist1 mediates repression of chondrogenesis by β-catenin to promote cranial bone progenitor specification. Development 139, 4428–4438. [DOI] [PMC free article] [PubMed] [Google Scholar]
- Graf D, Malik Z, Hayano S and Mishina Y (2016). Common mechanisms in development and disease: BMP signaling in craniofacial development. Cytokine Growth Factor Rev 27, 129–139. [DOI] [PMC free article] [PubMed] [Google Scholar]
- Grammatopoulos G. a, Bell E, Toole L, Lumsden a and Tucker a S. (2000). Homeotic transformation of branchial arch identity after Hoxa2 overexpression. Development 127, 5355–5365. [DOI] [PubMed] [Google Scholar]
- Han J, Ishii M, Bringas P, Maas RL, Maxson RE and Chai Y (2007). Concerted action of Msx1 and Msx2 in regulating cranial neural crest cell differentiation during frontal bone development. Mech. Dev 124, 729–745. [DOI] [PMC free article] [PubMed] [Google Scholar]
- Hill J, Clarke JDW, Vargesson N, Jowett T and Holder N (1995). Exogenous retinoic acid causes specific alterations in the development of the midbrain and hindbrain of the zebrafish embryo including positional respecification of the Mauthner neuron. Mech. Dev 50, 3–16. [DOI] [PubMed] [Google Scholar]
- Ho TV, Iwata J, Ho HA, Grimes WC, Park S, Sanchez-Lara PA and Chai Y (2015). Integration of comprehensive 3D microCT and signaling analysis reveals differential regulatory mechanisms of craniofacial bone development. Dev. Biol 400, 180–190. [DOI] [PMC free article] [PubMed] [Google Scholar]
- Hunt P, Gulisano M, Cook M, Sham MH, Faiella A, Wilkinson D, Boncinelli E and Krumlauf R (1991). A distinct Hox code for the branchial region of the vertebrate head. Nature 353, 861–4. [DOI] [PubMed] [Google Scholar]
- Ishii M, Sun J, Ting MC and Maxson RE (2015). The Development of the Calvarial Bones and Sutures and the Pathophysiology of Craniosynostosis 1st ed. Elsevier Inc. [DOI] [PubMed] [Google Scholar]
- Jiang X, Iseki S, Maxson RE, Sucov HM and Morriss-Kay GM (2002). Tissue origins and interactions in the mammalian skull vault. Dev. Biol 241, 106–16. [DOI] [PubMed] [Google Scholar]
- Karsenty G (2008). Transcriptional Control of Skeletogenesis. Annu. Rev. Genomics Hum. Genet 9, 183–196. [DOI] [PubMed] [Google Scholar]
- Karsenty G and Wagner EF (2002). Reaching a genetic and molecular understanding of skeletal evelopment. Dev. Cell 2, 389–406. [DOI] [PubMed] [Google Scholar]
- Kochhar DM, Jiang H, Penner JD, Johnson AT and Chandraratna RA . (1998). The use of a retinoid receptor antagonist in a new model to study vitamin A-dependent developmental events. Int. J. Dev. Biol 42, 601–608. [PubMed] [Google Scholar]
- Komori T, Yagi H, Nomura S, Yamaguchi A, Sasaki K, Deguchi K, Shimizu Y, Bronson R , Gao Y-H, Inada M, et al. (1997). Targeted Disruption of Cbfa1 Results in a Complete Lack of Bone Formation owing to Maturational Arrest of Osteoblasts. Cell 89, 755–764. [DOI] [PubMed] [Google Scholar]
- Krispin S, Nitzan E, Kassem Y and Kalcheim C (2010). Evidence for a dynamic spatiotemporal fate map and early fate restrictions of premigratory avian neural crest. Development 137, 585–595. [DOI] [PubMed] [Google Scholar]
- Krumlauf R (1994). Hox genes in vertebrate development. Cell 78, 191–201. [DOI] [PubMed] [Google Scholar]
- Kumar S and Duester G (2014). Retinoic acid controls body axis extension by directly repressing Fgf8 transcription. Development 141, 2972–2977. [DOI] [PMC free article] [PubMed] [Google Scholar]
- Lee Y, Lee J-Y and Kim MH (2014). PI3K/Akt pathway regulates retinoic acid-induced Hox gene expression in F9 cells. Dev. Growth Differ 56, 518–25. [DOI] [PubMed] [Google Scholar]
- Liu L, Liu X, Ren X, Tian Y, Chen Z, Xu X, Du Y, Jiang C, Fang Y, Liu Z, et al. (2016). Smad2 and Smad3 have differential sensitivity in relaying TGFβ signaling and inversely regulate early lineage specification. Sci. Rep 6, 21602. [DOI] [PMC free article] [PubMed] [Google Scholar]
- Lohnes D, Mark M, Mendelsohn C, Dolle P, Dierich A, Gorry P, Gansmuller A and Chambon P (1994). Function of the retinoic acid receptors (RARs) during development (I). Craniofacial and skeletal abnormalities in RAR double mutants. Development 120, 2723– 2748. [DOI] [PubMed] [Google Scholar]
- Lund AH and Van Lohuizen M (2004). Polycomb complexes and silencing mechanisms. Curr. Opin. Cell Biol 16, 239–246. [DOI] [PubMed] [Google Scholar]
- Maclean G, Dollé P and Petkovich M (2009). Genetic disruption of CYP26B1 severely affects development of neural crest derived head structures, but does not compromise hindbrain patterning. Dev. Dyn 238, 732–745. [DOI] [PubMed] [Google Scholar]
- Matt N, Ghyselinck NB, Wendling O, Chambon P and Mark M (2003). Retinoic acid-induced developmental defects are mediated by RARbeta/RXR heterodimers in the pharyngeal endoderm. Development 130, 2083–93. [DOI] [PubMed] [Google Scholar]
- Minoux M, Holwerda S, Vitobello A, Kitazawa T, Kohler H, Stadler MB and Rijli FM (2017a). Gene bivalency at Polycomb domains regulates cranial neural crest positional identity. Science (80-. ) 355, eaal2913. [DOI] [PubMed] [Google Scholar]
- Minoux M, Holwerda S, Vitobello A, Kitazawa T, Kohler H, Stadler MB and Rijli FM (2017b). Gene bivalency at Polycomb domains regulates cranial neural crest positional identity. Science 355, eaal2913. [DOI] [PubMed] [Google Scholar]
- Mirzamohammadi F, Papaioannou G, Inloes JB, Rankin EB, Xie H, Schipani E, Orkin SH and Kobayashi T (2016). Polycomb repressive complex 2 regulates skeletal growth by suppressing Wnt and TGF-β signalling. Nat. Commun 7, 12047. [DOI] [PMC free article] [PubMed] [Google Scholar]
- Moosa S and Wollnik B (2016). Altered FGF signalling in congenital craniofacial and skeletal disorders. Semin. Cell Dev. Biol 53, 115–125. [DOI] [PubMed] [Google Scholar]
- Morkmued S, Laugel-Haushalter V, Mathieu E, Schuhbaur B, Hemmerl� J, Doll� P, Bloch-Zupan A and Niederreither K (2017). Retinoic acid excess impairs amelogenesis inducing enamel defects. Front. Physiol 7, 1–14. [DOI] [PMC free article] [PubMed] [Google Scholar]
- Nakashima K, Zhou X and Al. GK et (2002). The novel zinc fingercontaining transcription factor Osterix is required for osteoblast 12 BioMed Research International differentiation and bone formation. Cell 108, 17–29. [DOI] [PubMed] [Google Scholar]
- Nishio Y, Dong Y, Paris M, O'Keefe ,RJ, Schwarz ,EM and Drissi H (2006). Runx2-mediated regulation of the zinc finger Osterix/Sp7 gene. Gene 372, 62–70. [DOI] [PubMed] [Google Scholar]
- Ornitz DM and Marie PJ (2002). FGF signaling pathways in endochondral and intramembranous bone development and human genetic disease. Genes Dev 16, 1446– 1465. [DOI] [PubMed] [Google Scholar]
- Pfaff MJ, Xue K, Li L, Horowitz MC, Steinbacher DM and Eswarakumar JVP (2016). FGFR2c-mediated ERK-MAPK activity regulates coronal suture development. Dev. Biol 415, 242–250. [DOI] [PMC free article] [PubMed] [Google Scholar]
- Rivera-Perez JA, Wakamiya M and Behringer RR (1999). Goosecoid acts cell autonomously in mesenchyme-derived tissues during craniofacial development. Development 126, 3811–3821. [DOI] [PubMed] [Google Scholar]
- Rivers LE, Young KM, Rizzi M, Jamen F, Psachoulia K, Wade A, Kessaris N and Richardson WD (2008). PDGFRA/NG2 glia generate myelinating oligodendrocytes and piriform projection neurons in adult mice. Nat. Neurosci 11, 1392–1401. [DOI] [PMC free article] [PubMed] [Google Scholar]
- Roybal PG, Wu NL, Sun J, Ting M chun, Schafer CA and Maxson RE (2010). Inactivation of Msx1 and Msx2 in neural crest reveals an unexpected role in suppressing heterotopic bone formation in the head. Dev. Biol 343, 28–39. [DOI] [PMC free article] [PubMed] [Google Scholar]
- Satokata I and Maas R (1994). Msx1 deficient mice exhibit cleft palate and abnormalities of craniofacial and tooth development. Nat. Genet 6, 348–356. [DOI] [PubMed] [Google Scholar]
- Satokata I, Ma L, Ohshima H, Bei M, Ian W, Nishizawa K, Maeda T, Takano Y, Uchiyama M, Heaney S, et al. (2000). Msx2 deficiency in mice causes pleiotropic defects in bone growth and ectodermal organ formation. Nat. Genet 24, 391–395. [DOI] [PubMed] [Google Scholar]
- Savory JGA, Edey C, Hess B, Mears AJ and Lohnes D (2014). Identification of novel retinoic acid target genes. Dev. Biol 395, 199–208. [DOI] [PubMed] [Google Scholar]
- Schilling TF and Kimmel CB (1994). Segment and cell type lineage restrictions during pharyngeal arch development in the zebrafish embryo. Development 120, 483–94. [DOI] [PubMed] [Google Scholar]
- Schindelin J, Arganda-Carreras I, Frise E, Kaynig V, Longair M, Pietzsch T, Preibisch S, Rueden C, Saalfeld S, Schmid B, et al. (2012). Fiji: an open-source platform for biological-image analysis. Nat. Methods 9, 676–82. [DOI] [PMC free article] [PubMed] [Google Scholar]
- Schmittgen TD and Livak KJ (2008). Analyzing real-time PCR data by the comparative CT method. Nat. Protoc 3, 1101–1108. [DOI] [PubMed] [Google Scholar]
- Schneider C, Rasband WS and Eliceiri KW (2012). NIH Image to ImageJ: 25 years of image analysis. Nat. Methods 9, 671–675. [DOI] [PMC free article] [PubMed] [Google Scholar]
- Schuettengruber B, Bourbon HM, Di Croce L and Cavalli G (2017). Genome Regulation by Polycomb and Trithorax: 70 Years and Counting. Cell 171, 34–57. [DOI] [PubMed] [Google Scholar]
- Schwarz D, Varum S, Zemke M, Schöler A, Baggiolini A, Draganova K, Koseki H, Schübeler D and Sommer L (2014). Ezh2 is required for neural crest-derived cartilage and bone formation. Development 141, 867–77. [DOI] [PubMed] [Google Scholar]
- Shen X, Liu Y, Hsu YJ, Fujiwara Y, Kim J, Mao X, Yuan GC and Orkin SH (2008). EZH1 Mediates Methylation on Histone H3 Lysine 27 and Complements EZH2 in Maintaining Stem Cell Identity and Executing Pluripotency. Mol. Cell 32, 491–502. [DOI] [PMC free article] [PubMed] [Google Scholar]
- Simon J. a and Kingston RE (2009). Mechanisms of polycomb gene silencing: knowns and unknowns. Nat. Rev. Mol. Cell Biol 10, 697–708. [DOI] [PubMed] [Google Scholar]
- Tatton-Brown K, Hanks S, Ruark E, Zachariou A, Duarte SDV, Ramsay E, Snape K, Murray A, Perdeaux ER, Seal S, et al. (2011). Germline mutations in the oncogene EZH2 cause Weaver syndrome and increased human height. Oncotarget 2, 1127–33. [DOI] [PMC free article] [PubMed] [Google Scholar]
- Trainor PA and Krumlauf R (2001). Hox genes, neural crest cells and branchial arch patterning. Curr. Opin. Cell Biol 13, 698–705. [DOI] [PubMed] [Google Scholar]
- Tran TH, Jarrell A, Zentner GE, Welsh A, Brownell I, Scacheri PC and Atit R (2010). Role of canonical Wnt signaling/β-catenin via Dermo1 in cranial dermal cell development. Development 137, 3973–3984. [DOI] [PMC free article] [PubMed] [Google Scholar]
- Williams SS, Mear JP, Liang H-C, Potter SS, Aronow BJ and Colbert MC (2005). Large-scale reprogramming of cranial neural crest gene expression by retinoic acid exposure. Physiol. Genomics 19, 184–197. [DOI] [PubMed] [Google Scholar]
- Yan G, Tian J, Zhu S, Dai Y and Qin C (2008). Fast cone-beam CT image reconstruction using GPU hardware. J. Xray. Sci. Technol 16, 225–234. [Google Scholar]
- Yoshida T, Vivatbutsiri P, Morriss-Kay G, Saga Y and Iseki S (2008). Cell lineage in mammalian craniofacial mesenchyme. Mech. Dev 125, 797–808. [DOI] [PubMed] [Google Scholar]
- Zhao X, Sirbu IO, Mic FA, Molotkova N, Molotkov A, Kumar S and Duester G (2009). Retinoic Acid Promotes Limb Induction through Effects on Body Axis Extension but Is Unnecessary for Limb Patterning. Curr. Biol 19, 1050–1057. [DOI] [PMC free article] [PubMed] [Google Scholar]
Associated Data
This section collects any data citations, data availability statements, or supplementary materials included in this article.