

Abstract
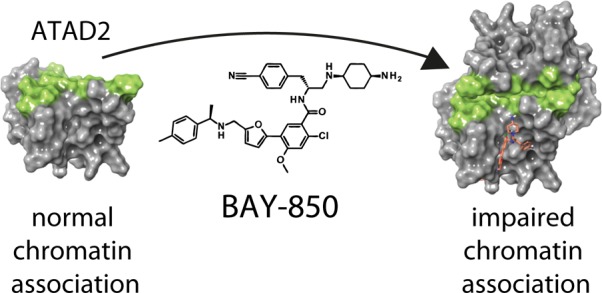
ATAD2 (ANCCA) is an epigenetic regulator and transcriptional cofactor, whose overexpression has been linked to the progress of various cancer types. Here, we report a DNA-encoded library screen leading to the discovery of BAY-850, a potent and isoform selective inhibitor that specifically induces ATAD2 bromodomain dimerization and prevents interactions with acetylated histones in vitro, as well as with chromatin in cells. These features qualify BAY-850 as a chemical probe to explore ATAD2 biology.
ATPase family AAA-domain containing protein 2 (ATAD2, or ANCCA) is an epigenetic regulator that associates with chromatin via its bromodomain (BD); a conserved structural motif specialized in acetyl-lysine recognition.1 ATAD2 has been proposed to act as a cofactor for oncogenic transcription factors such as ERα, AR, E2F, and Myc.2,3 Furthermore, we have recently reported a novel role for ATAD2 during DNA replication, uncovering interactions between ATAD2 and histone acetylation marks on newly synthesized histone H4.4 High expression of ATAD2 strongly correlates with poor patient prognosis in multiple tumor types,2,3 yet the link to cancer remains poorly understood.
Comprehensive validation of ATAD2 as a therapeutic target, including a dissection of the specific roles of the ATPase domain and BD has been hampered by the lack of isoform-selective, potent, and cellularly active ATAD2 inhibitors. A systematic assessment of crystal structures of the BD-containing protein family predicted that development of ATAD2 inhibitors would be challenging.5 In line with this forecast, only limited progress toward lead compounds targeting ATAD2 has been reported so far.6 A few notable exceptions relied on fragments as starting points, and the first molecules resulting from the approach showed weak potency, insufficient selectivity, permeability limitations, or modest cellular activity.7 Very recently, these compounds were further optimized toward a chemical probe with significantly improved properties.8
In this work, we embarked on a screening program to identify an isoform-selective ATAD2 inhibitor from a differentiated chemical class with enhanced cellular activity to further support the functional exploration of ATAD2. To this end, we explored the chemical space represented in 11 DNA-encoded chemical libraries (DELs)9 amounting to 65 billion compounds (Figure 1A). A two-round DEL selection process using GST-tagged ATAD2 BD followed by deep sequencing of the affinity-mediated selection output revealed a cluster of structurally related building block combinations from a single sublibrary of 110-million formyl acid derivatives (Figure 1B). Off-DNA synthesis of the most highly enriched member of this cluster followed by testing in biochemical and biophysical assays confirmed these novel compounds as bona fide ATAD2 inhibitors with single digit micromolar potency (Figure 1C).
Figure 1.

Discovery of BAY-850. (A) Overview of the DEL selection process to identify the starting points leading to BAY-850 and the inactive control BAY-460. Affinity-mediated selection of a 100 and 10-million three-cycle DNA-encoded chemical library was initiated by incubation in solution with GST-ATAD2 in a model cytosolic buffer. Subsequently, the protein was captured along with associated library members using an immobilized glutathione matrix, and after extensive washing, the enriched library was eluted at 85 °C. After two successive selection rounds, the eluted library was amplified, clustered, and sequenced using the Illumina platform. Subsequently, sequence data were translated back into encoded chemical and corresponding statistical information. (B) Graphical representation of the screening results for the library containing the initial hits. Cycle B and C building block identities are represented on the x and y axes, the z axis representing BC disynthon enrichment, and point size representing BCD trisynthon enrichment with each point randomly displaced by up to 0.5%. The red cluster contains the indicated combinations of related coenriched building block combinations including the initial hit and coenriched variants. (C) Schematic representation of the SAR exploration, starting from the most potent DNA encoded library hit. Major learnings regarding necessary core elements and absolute configuration toward BAY-850 are indicated in the text.
During hit-to-lead optimization, the essential elements from this unique BD inhibitor structure were defined, and the potency and physicochemical properties of the following compounds were significantly improved (Figure 1C). Both stereogenic centers with the absolute configuration as found in the primary hit are essential for inhibitory activity. The geometry of the meta substituted furanyl benzoic acid was identified as the second essential element for remaining activity. Changes in the northern hemisphere to lipophilic basic substituents led to a major potency improvement, and to BAY-850. The inactive congener BAY-460 (Supporting Information Figure 2) was obtained by inverting one stereogenic center and additional fine-tuning. The synthesis of both compounds starts with the construction of the central furanyl benzoic acid core followed by a reductive amination to the chiral benzyl amine and an amide coupling to the benzyl alanine portion, the two key steps which were also the basis for library design and synthesis (Supporting Information Figures 1 and 2).
BAY-850 competed with the binding of a monoacetylated histone H4 N-terminal peptide to ATAD2 BD with an IC50 of 166 nM measured in TR-FRET assay (Figure 2A). Under similar conditions, the compound displaced a tetra-acetylated H4 peptide with an IC50 of 22 nM. A similar shift between the two assays was observed for all related compounds tested (Supporting Information Figure 4A). This was consistent with the fact that the K12 monoacetylated peptide had previously been shown to have higher binding efficacy in this assay.4 In orthogonal binding competition assays such as Alphascreen and BROMOscan, BAY-850 displaced the tetra-acetylated peptide with an IC50 of 157 nM and a KD of 115 nM, respectively, confirming that the effects shown by the compound were independent of the readout technology used to measure them (Figure 2A). Furthermore, the compound inhibited tetra-acetylated H4 peptide binding to a larger ATAD2 construct including the ATPase domain (Supporting Information Figure 4D). The negative control compound, BAY-460, was inactive at the same concentrations in all assays where it was tested.
Figure 2.

Potency and selectivity of BAY-850. (A) Biochemical potency of BAY-850 and BAY-460 in binding competition assays. Effects of increasing concentrations of BAY-850 (full symbols) and BAY-460 (open symbols) on ATAD2 binding to acetylated histone H4 peptides were quantified with TR-FRET (black symbols for monoacetylated peptides, blue symbols for tetra-acetylated peptides), Alphascreen (red symbols), and the Bromoscan qPCR-based readout (green symbols). Normalized signals (y axis) were plotted against the compound dose (x axis) and fitted to a four-parameter logistic equation (solid lines) in order to obtain the potency values shown in Supporting Information Table 1). (B) Characterization of BAY-850 binding to ATAD2 with MST. Thermophoresis traces of fluorescence-labeled GST-ATAD2 incubated with vehicle or increasing concentrations of BAY-850 were recorded in real time (inset), and averaged steady-state MST signals (y axis) were plotted against the compound dose (x axis). Fit of the results to a 1:1 binding model (solid line) delivered the KD value shown in Supporting Information Table 1. (C) Characterization of BAY-850 and BAY-460 binding to ATAD2 with TSA. Thermal melting curves of untagged ATAD2 BD previously incubated with SYPRO Orange and increasing concentrations of compound (indicated by colors). Temperature ramping is indicated in the x axis, and fluorescence intensity is shown in the y axis. The inset shows the experiment corresponding to the inactive control BAY-460. Melting points at 25 μM compound are shown in Supporting Information Table 1. (D) TREEspot representation of the bromodomain selectivities of BAY-850 and BAY-460 in the Bromoscan panel. Spot size accounts for compound effects as indicated by the legend. (E) Bromodomain selectivity profile of BAY-850 in Tm panel. Circles on the BD family phylogenetic tree represent members for which TSA melting curves were acquired in the presence of 10 μM BAY-850 or vehicle. Size and color of the circles account for compound effects as indicated by the legend.
Next, we set out to confirm the biochemical activity of BAY-850 by detecting direct binding of the compound to ATAD2 with biophysical techniques. First, protein-observed NMR spectroscopy confirmed specific ATAD2 engagement by a close congener of BAY-850 (Supporting Information Figure 3). In a microscale thermophoresis (MST) assay, BAY-850 exhibited dose-dependent, saturatable effects on the ATAD2 hydration shell (Figure 2B), from which a KD of 85 nM was calculated. This value is in agreement with the potencies described above, a feature that could be shown for all compounds profiled with MST (Supporting Information Figure 4B). Furthermore, in a thermal shift assay (TSA) BAY-850 -unlike BAY-460- increased the melting temperature of ATAD2 in a dose-dependent fashion (Figure 2C). This assay also showed a trend to stronger thermal stabilization with increasing biochemical potencies of members of the same chemical series (Supporting Information Figure 4C). The selectivity profile of BAY-850 and BAY-460 was initially investigated in the BROMOscan panel, where the first compound exclusively hit ATAD2 but -surprisingly- not the closely related ATAD2B, while the latter did not show significant effects at the same concentrations (Figure 2D and Supporting Information Figure 5A). These results were confirmed in a TSA panel, where the effect of BAY-850 on the thermal stability of ATAD2 was not observed for other members of the BD family when the compound was tested at 10 μM (Figure 2E and Supporting Information Figure 5B). In addition, BAY-850 showed no inhibitory activity in a panel of 354 kinases and had only modest effects at high concentrations on a few GPCRs (Supporting Information Tables 2 and 3).
The unprecedented isoform selectivity of BAY-850 suggested a different mode of action to those exhibited by canonical BD inhibitors.5 This interpretation was reinforced by isothermal calorimetry (ITC) analysis (Supporting Information Figure 4E), in which weak heat signals for the interaction could only be recorded at 37 °C, and the stoichiometry was uncharacteristic when compared to orthosteric ligands.1 A closer examination of BAY-850’s dose titration in TSA revealed that ATAD2 melting curves transitioned from a monophasic to a biphasic shape with increasing concentrations of the compound, suggesting the appearance of a new protein species with a differentiated melting profile upon saturation with BAY-850 (Figure 2C). These observations prompted us to conduct an in-depth investigation of the BAY-850 binding mode using nondenaturing or native mass spectrometry (MS), a well-established method to investigate protein–ligand interactions,10 which delivers information about the multimeric character and the conformation of a protein by its charge-state distribution in the mass spectrum. The native mass spectrum of tag-free ATAD2 is dominated by two signals derived from monomeric ATAD2 with charge states +6 and +7, respectively, two minor signals derived from dimeric ATAD2 with charge states +9 and +10, respectively, and signals of partially unfolded ATAD2 in the m/z range between 1100 and 2000 (Figure 3A). Next, we acquired the native mass spectrum of ATAD2 incubated with BAY-850. To our surprise, the spectrum was dominated by signals derived from a complex where one BAY-850 molecule binds to an ATAD2 dimer (Figure 3B), with no binding observed for monomeric ATAD2. In contrast, the inactive control BAY-460 showed no binding to monomeric or dimeric ATAD2. The dimer-inducing effect of BAY-850 is concentration-dependent, suggesting a specific process (Figure 3C and Supporting Information Figure 6A). These observations were confirmed by analytical size exclusion chromatography (SEC) analysis, where we observed a compound-induced shift from the ATAD2-monomer to ATAD2-dimer form in the elution profile (Figure 3D). Importantly, BAY-850 was not able to induce further multimerization of GST dimers when the experiments were performed with GST-tagged ATAD2 (Figure 3D, inset), confirming that this effect originates from an interaction between the compound and ATAD2 and not with the GST tag. Competition native MS experiments showed weak binding of a single monoacetylated histone H4 peptide molecule to the inhibitor-bound ATAD2 dimer. In contrast, in the absence of BAY-850, clear 1:1 binding of the same peptide to monomeric ATAD2 and 2:2 binding to dimeric ATAD2 was observed (Supporting Information Figure 6B).
Figure 3.

Characterization of BAY-850’s mode of action. (A) Characterization of BAY-850 and BAY-460 binding to ATAD2 with native MS. Raw nano-ESI spectra of untagged ATAD2 BD (10 μM) incubated with 1% DMSO (top spectrum), with 5 μM BAY-850 (middle spectrum), and with 5 μM of inactive control BAY-460 (lower spectrum) obtained under native conditions. (B) Deconvoluted nano-ESI spectra of dimeric ATAD2 BD. Measurements were performed under native conditions in the presence of BAY-850 (top spectrum) and BAY-460 (lower spectrum). Mass shifts induced by ligand binding are shown with arrows (blue, BAY-850; red, BAY-460). (C) Quantification of BAY-850-induced dimerization of ATAD2 by native MS. Relative intensities of monomeric and dimeric signals considering all charge states were used to calculate the percentage of dimerized ATAD2 with increasing ligand concentrations (blue, BAY-850; red, BAY-460). (D) SEC analysis of BAY-850:ATAD2A complexes. Elution profiles of untagged ATAD2 BD in the presence of either BAY-850 (blue lines) or vehicle (red lines) showing a mass shift upon compound treatment corresponding to ATAD2 dimers. The inset shows results of a similar experiment conducted with GST-ATAD2 BD.
BAY-850 and BAY-460 have overall acceptable physicochemical and in vitro pharmacokinetics profiles with moderate permeability as determined using a Caco-2 assay (Supporting Information Table 4). These properties allowed for the determination of in-cell target engagement. We used fluorescence recovery after photobleaching (FRAP) assay to measure compound-related displacement of labeled full-length ATAD2 from chromatin in MCF7 cells (Figure 3A–C) with an optimized method we described earlier.4 Treatment with 1 μM of BAY-850 resulted in a decreased half recovery time (t1/2) of GFP-tagged full-length wild type ATAD2. This effect was not observed with BAY-460 and is comparable to the mutagenesis of ATAD2 BD (Figure 4B,C). This approach allowed us to demonstrate that BAY-850 is a cellularly active ATAD2 BD inhibitor with maximal on-target cellular activity at 1 μM.
Figure 4.

Cellular target engagement and mechanistic activity of BAY-850. (A) MCF7 breast cancer cells transfected with green fluorescent protein (GFP)-tagged full-length wild type (WT) ATAD2 were used in fluorescence recovery after photobleaching assay. The bleached area is indicated by red circles. Bar is 5 μm. (B) Half fluorescence recovery times after photobleaching (recovery t1/2) were determined in the bleached area for GFP-tagged full-length WT, BD mutant, and ATPase mutant ATAD2, as well as for GFP-tagged full-length WT ATAD2 after treatment with 1 μM BAY-850 or 1 μM BAY-460 for 1 h, in MCF7 cells. Curves represent the mean recovery t1/2 at each time point of at least 15 cells per group. (C) Recovery t1/2 of GFP-tagged full-length WT ATAD2 was significantly faster in MCF7 cells treated with 1 μM BAY-850 (6.3 ± 1.2 s) than in untreated cells (WT, 13.7 ± 1.7 s) and was comparable with the GFP-tagged full-length BD mutant ATAD2 (8.4 ± 1.2 s). Treatment of MCF7 cells with BAY-460 control compound had no major effect on the recovery t1/2 (16.5 ± 3.2 s). Bars represent the mean recovery t1/2 calculated from at least 15 individual recovery curves per group. Error bars indicate standard error of the mean. (D) Heat-map correlation of biochemical potency and growth inhibition of BAY-850, BAY-460, and additional compounds from the same structural class measured on three cancer cell lines: NCI-H526, MCF7, and MDA-MB-231. (E) Growth inhibition curves of BAY-850 and BAY-460 on MCF7 and MDA-MB-231 breast cancer cells and HMEC nontransformed mammary epithelial cells.
Knockdown experiments have suggested that the survival of some cancer cell lines may depend on ATAD2.11−13 Therefore, we investigated the antiproliferative effects of BAY-850, BAY-460, and several related compounds with a broad range of biochemical activities on three cancer cell lines. We observed a weak correlation between the biochemical potency and growth inhibition, with GI50’s in the single-digit micromolar range for BAY-850 and similarly potent compounds, while BAY-460 showed no efficacy up to the highest concentrations tested (Figure 4D). Since growth inhibition occurred only at high compound concentrations, and without particular discrimination between cell lines, we went on to compare activities of BAY-850 and BAY-460 in normal epithelial and cancer cells. Here again, a clear differentiation between both compounds was observed, but BAY-850 was similarly active on the nontransformed and cancer cells (Figure 4E). Thus, we concluded that the cytotoxic effects displayed by BAY-850 cannot be unmistakably linked to ATAD2 BD inhibition. Further evidence for a disconnect between the observed growth inhibition and the inhibition of ATAD2 BD was provided by gene expression studies, in which BAY-850 treatment did not affect the expression of some of the previously identified ATAD2 target genes11,12 (Supporting Information Figure 7). Consistently, other recently published ATAD2 BD inhibitors also failed to demonstrate significant effects on target gene expression and cancer cell survival below 20 μM despite engaging ATAD2 BD in living cells.8 Potential dispensability of the BD in multidomain containing proteins was recently observed for SMARCA2/4 proteins, where discrepancies between the knockdown of the entire protein and a specific inhibition of their BD function were observed.14 In line with these reports, there is no convincing domain-specific genetic validation of ATAD2 BD in cancer cell survival thus far and, at least in the leukemia-domain-focused CRISPR/Cas9 screen, revealed no dependencies on the BD of ATAD2.15
In conclusion, we have used affinity-mediated selection with a DNA-encoded library to discover a new chemical class of potent, isoform selective ATAD2 BD inhibitors. These features, along with sufficient solubility and permeability,16,17 make BAY-850 and its inactive companion BAY-460 (dosed at noncytotoxic concentrations) valuable tools to further investigate the biology of ATAD2. Furthermore, our results suggest that BAY-850’s mode of action might be linked to protein dimer induction, a feature which could represent a new approach for inhibiting protein–protein interactions.18 Using this compound, we have confirmed the dispensability of ATAD2 BD for gene expression regulation. These findings combined with the roles attributed to the ATAD2 gene in knockdown studies make ATAD2 particularly well suited for targeted protein degradation approaches.19 Our work lays the foundation for further compound development, e.g., toward PROTAC “warheads” with higher potency and improved PK properties, which may ultimately lead to in vivo probes and novel therapeutic agents.
Methods
Details on compound synthesis and experimental procedures are provided in the Supporting Information.
Acknowledgments
We would like to thank N. Dittmar, F. Hübner and M. Geyer for technical assistance; S. Fuellerton and M. Jerabek-Willemsen (Crelux and Nanotemper) for expert help with MST; J. Kahmann (Evotec) and A. Friberg for experimental support and helpful discussions in protein NMR analysis; and C. Scholten and A. Müller-Fahrnow for project management support. The SGC is a registered charity (number 1097737) that receives funds from AbbVie, Bayer Pharma AG, Boehringer Ingelheim, Canada Foundation for Innovation, Eshelman Institute for Innovation, Genome Canada, Innovative Medicines Initiative (EU/EFPIA) [ULTRA-DD grant no. 115766], Janssen, Merck & Co., Novartis Pharma AG, Ontario Ministry of Economic Development and Innovation, Pfizer, São Paulo Research Foundation-FAPESP, Takeda, and Wellcome Trust [106169/ZZ14/Z].
Supporting Information Available
The Supporting Information is available free of charge on the ACS Publications website at DOI: 10.1021/acschembio.7b00708.
Methods, supporting figures and legends, and supporting tables (PDF)
The authors declare no competing financial interest.
Supplementary Material
References
- Filippakopoulos P.; Picaud S.; Mangos M.; Keates T.; Lambert J. P.; Barsyte-Lovejoy D.; Felletar I.; Volkmer R.; Muller S.; Pawson T.; Gingras A. C.; Arrowsmith C. H.; Knapp S. (2012) Histone recognition and large-scale structural analysis of the human bromodomain family. Cell 149, 214–231. 10.1016/j.cell.2012.02.013. [DOI] [PMC free article] [PubMed] [Google Scholar]
- Boussouar F.; Jamshidikia M.; Morozumi Y.; Rousseaux S.; Khochbin S. (2013) Malignant genome reprogramming by ATAD2. Biochim. Biophys. Acta, Gene Regul. Mech. 1829, 1010–1014. 10.1016/j.bbagrm.2013.06.003. [DOI] [PubMed] [Google Scholar]
- Lloyd J. T.; Glass K. C. (2017) Biological function and histone recognition of family IV bromodomain-containing proteins. J. Cell. Physiol. 10.1002/jcp.26010. [DOI] [PMC free article] [PubMed] [Google Scholar]
- Koo S. J.; Fernandez-Montalvan A. E.; Badock V.; Ott C. J.; Holton S. J.; von Ahsen O.; Toedling J.; Vittori S.; Bradner J. E.; Gorjanacz M. (2016) ATAD2 is an epigenetic reader of newly synthesized histone marks during DNA replication. Oncotarget 7, 70323–70335. 10.18632/oncotarget.11855. [DOI] [PMC free article] [PubMed] [Google Scholar]
- Filippakopoulos P.; Knapp S. (2014) Targeting bromodomains: epigenetic readers of lysine acetylation. Nat. Rev. Drug Discovery 13, 337–356. 10.1038/nrd4286. [DOI] [PubMed] [Google Scholar]
- Harner M. J.; Chauder B. A.; Phan J.; Fesik S. W. (2014) Fragment-based screening of the bromodomain of ATAD2. J. Med. Chem. 57, 9687–9692. 10.1021/jm501035j. [DOI] [PMC free article] [PubMed] [Google Scholar]
- Bamborough P.; Chung C. W.; Furze R. C.; Grandi P.; Michon A. M.; Sheppard R. J.; Barnett H.; Diallo H.; Dixon D. P.; Douault C.; Jones E. J.; Karamshi B.; Mitchell D. J.; Prinjha R. K.; Rau C.; Watson R. J.; Werner T.; Demont E. H. (2015) Structure-Based Optimization of Naphthyridones into Potent ATAD2 Bromodomain Inhibitors. J. Med. Chem. 58, 6151–6178. 10.1021/acs.jmedchem.5b00773. [DOI] [PubMed] [Google Scholar]
- Bamborough P.; Chung C. W.; Demont E. H.; Furze R. C.; Bannister A. J.; Che K. H.; Diallo H.; Douault C.; Grandi P.; Kouzarides T.; Michon A. M.; Mitchell D. J.; Prinjha R. K.; Rau C.; Robson S.; Sheppard R. J.; Upton R.; Watson R. J. (2016) A Chemical Probe for the ATAD2 Bromodomain. Angew. Chem., Int. Ed. 55, 11382–11386. 10.1002/anie.201603928. [DOI] [PMC free article] [PubMed] [Google Scholar]
- Goodnow R. A. Jr.; Dumelin C. E.; Keefe A. D. (2017) DNA-encoded chemistry: enabling the deeper sampling of chemical space. Nat. Rev. Drug Discovery 16, 131–147. 10.1038/nrd.2016.213. [DOI] [PubMed] [Google Scholar]
- Vivat Hannah V.; Atmanene C.; Zeyer D.; Van Dorsselaer A.; Sanglier-Cianferani S. (2010) Native MS: an ’ESI’ way to support structure- and fragment-based drug discovery. Future Med. Chem. 2, 35–50. 10.4155/fmc.09.141. [DOI] [PubMed] [Google Scholar]
- Kalashnikova E. V.; Revenko A. S.; Gemo A. T.; Andrews N. P.; Tepper C. G.; Zou J. X.; Cardiff R. D.; Borowsky A. D.; Chen H. W. (2010) ANCCA/ATAD2 overexpression identifies breast cancer patients with poor prognosis, acting to drive proliferation and survival of triple-negative cells through control of B-Myb and EZH2. Cancer Res. 70, 9402–9412. 10.1158/0008-5472.CAN-10-1199. [DOI] [PMC free article] [PubMed] [Google Scholar]
- Revenko A. S.; Kalashnikova E. V.; Gemo A. T.; Zou J. X.; Chen H. W. (2010) Chromatin loading of E2F-MLL complex by cancer-associated coregulator ANCCA via reading a specific histone mark. Mol. Cell. Biol. 30, 5260–5272. 10.1128/MCB.00484-10. [DOI] [PMC free article] [PubMed] [Google Scholar]
- Raeder M. B.; Birkeland E.; Trovik J.; Krakstad C.; Shehata S.; Schumacher S.; Zack T. I.; Krohn A.; Werner H. M.; Moody S. E.; Wik E.; Stefansson I. M.; Holst F.; Oyan A. M.; Tamayo P.; Mesirov J. P.; Kalland K. H.; Akslen L. A.; Simon R.; Beroukhim R.; Salvesen H. B. (2013) Integrated genomic analysis of the 8q24 amplification in endometrial cancers identifies ATAD2 as essential to MYC-dependent cancers. PLoS One 8, e54873. 10.1371/journal.pone.0054873. [DOI] [PMC free article] [PubMed] [Google Scholar]
- Vangamudi B.; Paul T. A.; Shah P. K.; Kost-Alimova M.; Nottebaum L.; Shi X.; Zhan Y.; Leo E.; Mahadeshwar H. S.; Protopopov A.; Futreal A.; Tieu T. N.; Peoples M.; Heffernan T. P.; Marszalek J. R.; Toniatti C.; Petrocchi A.; Verhelle D.; Owen D. R.; Draetta G.; Jones P.; Palmer W. S.; Sharma S.; Andersen J. N. (2015) The SMARCA2/4 ATPase Domain Surpasses the Bromodomain as a Drug Target in SWI/SNF-Mutant Cancers: Insights from cDNA Rescue and PFI-3 Inhibitor Studies. Cancer Res. 75, 3865–3878. 10.1158/0008-5472.CAN-14-3798. [DOI] [PMC free article] [PubMed] [Google Scholar]
- Shi J.; Wang E.; Milazzo J. P.; Wang Z.; Kinney J. B.; Vakoc C. R. (2015) Discovery of cancer drug targets by CRISPR-Cas9 screening of protein domains. Nat. Biotechnol. 33, 661–667. 10.1038/nbt.3235. [DOI] [PMC free article] [PubMed] [Google Scholar]
- Bunnage M. E.; Chekler E. L.; Jones L. H. (2013) Target validation using chemical probes. Nat. Chem. Biol. 9, 195–199. 10.1038/nchembio.1197. [DOI] [PubMed] [Google Scholar]
- Arrowsmith C. H.; Audia J. E.; Austin C.; Baell J.; Bennett J.; Blagg J.; Bountra C.; Brennan P. E.; Brown P. J.; Bunnage M. E.; Buser-Doepner C.; Campbell R. M.; Carter A. J.; Cohen P.; Copeland R. A.; Cravatt B.; Dahlin J. L.; Dhanak D.; Edwards A. M.; Frederiksen M.; Frye S. V.; Gray N.; Grimshaw C. E.; Hepworth D.; Howe T.; Huber K. V.; Jin J.; Knapp S.; Kotz J. D.; Kruger R. G.; Lowe D.; Mader M. M.; Marsden B.; Mueller-Fahrnow A.; Muller S.; O’Hagan R. C.; Overington J. P.; Owen D. R.; Rosenberg S. H.; Roth B.; Ross R.; Schapira M.; Schreiber S. L.; Shoichet B.; Sundstrom M.; Superti-Furga G.; Taunton J.; Toledo-Sherman L.; Walpole C.; Walters M. A.; Willson T. M.; Workman P.; Young R. N.; Zuercher W. J. (2015) The promise and peril of chemical probes. Nat. Chem. Biol. 11, 536–541. 10.1038/nchembio.1867. [DOI] [PMC free article] [PubMed] [Google Scholar]
- Zak K. M.; Grudnik P.; Guzik K.; Zieba B. J.; Musielak B.; Domling A.; Dubin G.; Holak T. A. (2016) Structural basis for small molecule targeting of the programmed death ligand 1 (PD-L1). Oncotarget 7, 30323–30335. 10.18632/oncotarget.8730. [DOI] [PMC free article] [PubMed] [Google Scholar]
- Cromm P. M.; Crews C. M. (2017) Targeted Protein Degradation: from Chemical Biology to Drug Discovery. Cell Chem. Biol. 24, 1181. 10.1016/j.chembiol.2017.05.024. [DOI] [PMC free article] [PubMed] [Google Scholar]
Associated Data
This section collects any data citations, data availability statements, or supplementary materials included in this article.