Figure 8.
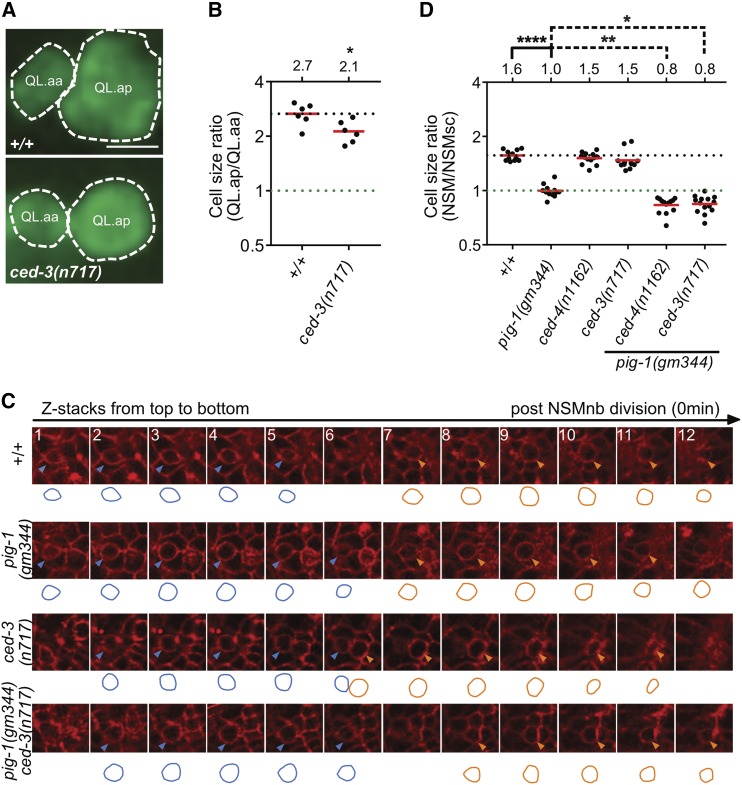
The apoptotic pathway promotes asymmetric cell division in other neuroblast lineages. (A) Representative images and (B) dot plot showing relative sizes of QL.a daughter cells in wild-type and ced-3(n717) animals. Bar, 3 μm. Cells were visualized using the reporter Ptoe-2gfp (bcIs133). Statistical test: Mann–Whitney test. * P < 0.05, n = 6 QL.as. (C) Representative images showing NSM (Neurosecretory motor neuron) neuroblast (NSMnb) daughter cells visualized with Ppie-1mCherry::phplcδ (ltIs44). The circumferences of the daughter cells were traced and are shown below the respective images. Circumferences of NSM sister cells (NSMsc) are shown in blue and circumferences of NSM are shown in orange. (D) Dot blot showing cell size ratios (NSM/NSMsc) in the indicated genotypes. One-way ANOVA with Tukey’s multiple comparisons test was used to determine statistical significance. * P < 0.05, ** P < 0.01, **** P < 0.0001, n > 11 NSM neuroblasts.

