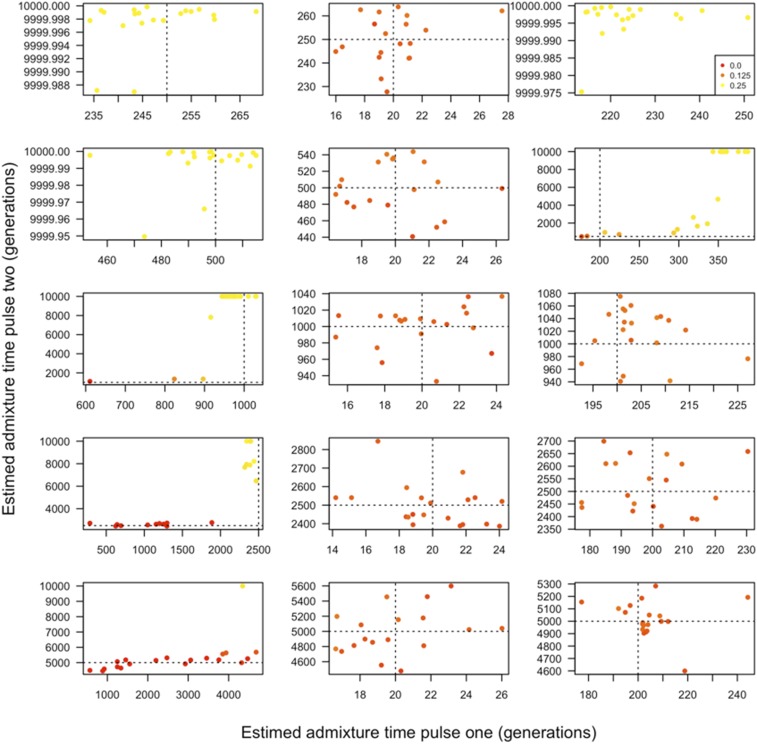
Figure 6.
Admixture model fitted for data consistent with admixed Drosophila populations. Two-pulse admixture models for scenarios that are truly single-pulse (left), two-pulse with a first admixture pulse 20 generations prior to sample (middle), and two-pulse models with a first admixture pulse 200 generations prior to sampling (right). From top to bottom, the second admixture pulse occurred 250, 500, 1000, 2500, and 5000 generations prior to sampling. The point colors indicate the proportion of ancestry in the sampled population that entered during the first admixture pulse in backward time with a gradient running from 0 (red) to the maximum, 0.5 (yellow). Dashed lines indicate the correct timing of simulated ancestry pulses. In two-pulse models, the first pulse contained 10% of the final ancestry and the second contributed 14% of ancestry to the sampled population. In single-pulse models, all of the non-native ancestry is contributed by one pulse. These values were selected to be consistent with those from admixed sub-Saharan populations of this species (Pool et al. 2012). Note that axes may differ between subplots.

