Figure 2.
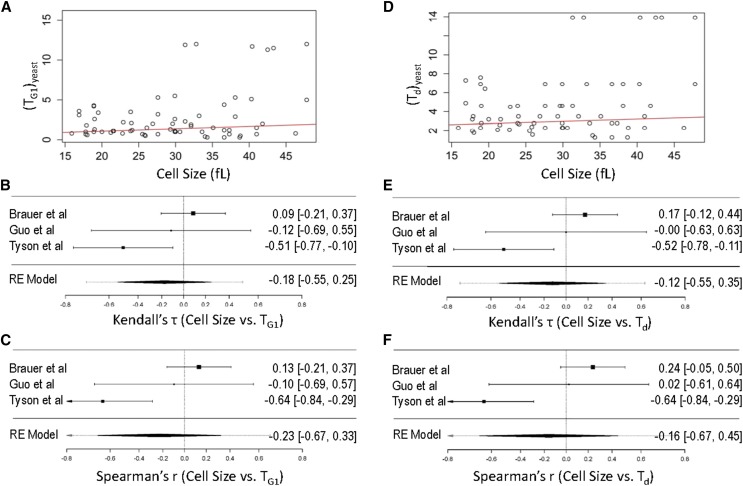
Cell size does not correlate with Td or TG1 in yeast. Scatter plots of cell size values (x-axis) against Td (A) or TG1 (D) values (y-axis) from the data shown in Table S1. In red are regression lines of the Siegel repeated medians. Forest plots of the measure of effect for each of the studies included in the analysis (Tyson et al. 1979; Guo et al. 2004; Brauer et al. 2008), based on the Kendall’s (τ) rank correlation coefficients (B and E) or Spearman’s (r) rank correlation coefficients (C and F), are shown in each case, for cell size vs. TG1 (B and C) and cell size vs. Td (E and F). The C.I.s from each study are shown in parentheses and represented by horizontal whisker lines. In the studies in which the confidence intervals overlap with the vertical line at the 0 point on the x-axis, their effect sizes do not differ from no effect. The meta-analyzed measure of the effect is shown at the bottom of each plot, based on random effects (RE) models.

