Abstract
Purpose:
To test the hypothesis that the fovea-Bruch’s membrane opening axis angle (FoBMO angle) influences the thickness symmetry of the macular ganglion cell/inner plexiform layer (GCIPL) across the temporal horizontal meridian in normal subjects.
Design:
Cross-sectional diagnostic study at a tertiary academic center.
Methods:
One hundred sixteen eyes of 60 normal subjects aged 40–85 years underwent spectral-domain optical coherence tomography (SD-OCT) imaging. The FoBMO angle was estimated on en face infrared SD-OCT images. Posterior Pole Algorithm images acquired with Spectralis SD-OCT were used to define vertical asymmetry as follows. The average thickness difference between the 3 most temporal superpixels above and below the horizontal meridian, the second row of superpixels from the horizontal meridian, and 3 central superpixels above and below the horizontal meridian were calculated. Factors influencing GCIPL thickness asymmetry were explored and changes in thickness asymmetry as a function of FoBMO angle were investigated.
Results:
No demographic or clinical factors affected temporal GCIPL asymmetry (p >0.05 for all). A more (negatively) tilted FoBMO angle was associated with relatively thinner inferior compared to superior GCIPL thickness in superpixels immediately adjacent to the temporal raphe (p<0.001). The second row of temporal superpixels from the horizontal meridian (p=0.349) or central superpixels (p=0.292) did not show this tendency.
Conclusions:
Vertical GCIPL symmetry across the horizontal meridian is influenced by the FoBMO angle. SD-OCT algorithms using vertical asymmetry as a diagnostic index should be adjusted for the FoBMO angle.
Keywords: Fovea-BMO Angle, Vertical Macular Asymmetry, Temporal Raphe
Introduction
Early identification of glaucoma and timely detection of disease progression are important tasks for disease management. Spectral domain optical coherence tomography (SD-OCT) has become the standard approach for detection of structural damage in glaucoma. 1 Automated segmentation of retinal layers enables measurement of the inner retinal layers or combination of layers such as ganglion cell/ inner plexiform layer (GCIPL) thickness. Vertical thickness asymmetry of inner macular parameters along the macular temporal raphe has been explored for detection of early glaucoma. 2–8 Measurement of the temporal raphe angle is not currently possible on images acquired for clinical purposes. While some studies have assumed the temporal raphe to be aligned horizontally, variations in its alignment with regard to the horizontal meridian are well documented; 9–12 on the other hand, some devices such as Spectralis SD-OCT (Heidelberg Engineering, Heidelberg, Germany) use an extension of the line connecting the fovea to Bruch’s membrane opening as the axis of vertical symmetry temporal to the fovea. 13
The angle between the axis connecting the center of the Bruch’s membrane opening (BMO) to the foveal center and the horizontal axis of the SD-OCT image is called the fovea-BMO (FoBMO) angle. 14 This angle is considered to be negative when the fovea is located below the disc center. It reflects anatomical variations between the foveal and BMO locations and has been found to affect the course of retinal nerve fibers toward the optic nerve head. 15,16 The FoBMO angle is currently used by the Spectralis SD-OCT to adjust the RNFL measurements on the TSNIT curve to be anatomically accurate. Some studies have reported a direct relationship between the FoBMO angle and the temporal raphe deviation from the horizontal meridian. 10–12 Therefore, variations in the FoBMO angle could affect the thickness measurements of inner macular parameters, such as GCIPL, along the temporal raphe and/or the horizontal meridian.
The goal of this study is to test the hypothesis that the FoBMO angle influences the thickness symmetry of the macular GCIPL across the horizontal meridian in normal subjects. The findings could help enhance vertical asymmetry algorithms and potentially improve the performance of such algorithms for detection of early glaucoma.
Methods
One hundred sixteen eyes of 60 normal subjects were enrolled in the current study. The study was approved by the Institutional Review Board at the University of California Los Angeles and adhered to the tenets of the Declaration of Helsinki. The study subjects who met the following criteria were prospectively enrolled at the Stein Eye Institute, University of California Los Angeles: age between 40 and 85 years, best corrected visual acuity ≥20/40, refractive error between –8 and +4 D, open angles on gonioscopy, normal disc and retinal nerve fiber layer (RNFL) on clinical exam, and visual field considered to be within normal limits. Exclusion criteria consisted of any ocular pathology other than cataract and any previous ocular surgery. A visual field was considered within normal limits as long as it did not meet criteria for abnormality consisting of an abnormal Glaucoma Hemifield Test or pattern standard deviation (p <0.05) or presence of >3 test locations with p <0.05 on the pattern deviation plot. 17
All subjects underwent a thorough eye examination on the day of imaging, including visual acuity, automated refraction, measurement of intraocular pressure, gonioscopy, slit-lamp exam, dilated fundus exam, and standard achromatic perimetry (24–2 SITA standard). Axial length and keratometry were measured with IOLMaster (Carl Zeiss Meditec). Stereoscopic disc photographs and SD-OCT imaging (Disc and Macular Cubes 200×200 with Cirrus high-definition OCT and Posterior Pole Algorithm with Spectralis SD-OCT) were obtained after pupillary dilation.
SD-OCT measurements
The Macular Cube 200×200 algorithm of Cirrus high-definition OCT (HD-OCT) consists of 40,000 A-scans in a 6×6 mm grid (in an emmetropic eye) centered on the fovea. Based on a full macular thickness map overlaid on the infrared image of the posterior pole, the position of the fovea can be ascertained on the image as a horizontally oval region demonstrating the thinnest area in the central macula. The Disc Cube 200×200 uses the same strategy to measure peripapillary RNFL and optic nerve head (ONH) parameters. The device automatically delineates the BMO boundary and estimates the location of BMO center.
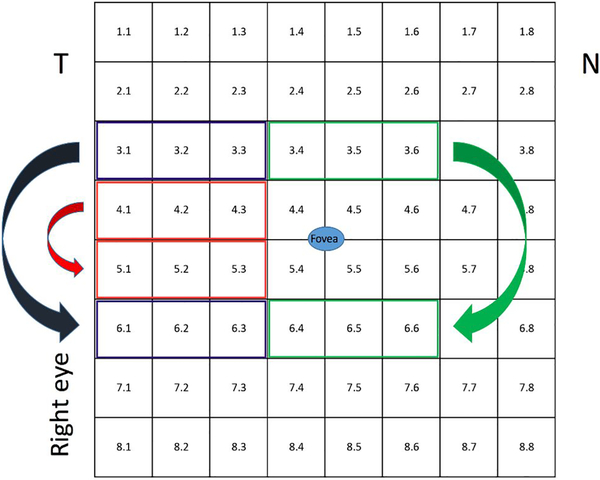
The macular imaging algorithm of the Spectralis SD-OCT (Posterior Pole Horizontal Algorithm) is comprised of 61 horizontal B-scans each consisting of 768 A-scans spanning a 30°×25° wide area. At each position, acquisition of B-scans is repeated 9–11 times to decrease speckle noise (Automatic Real Time or ART =9–11). The data are then averaged and an 8×8 grid of thickness measurements (64 superpixels within the central 24°×24°, each 3° wide) for the layer of interest is created (Figure 1). The Glaucoma Module Premium Edition (GMPE) software is able to segment all the individual retinal layers including the macular RNFL, ganglion cell layer (GCL), inner plexiform layer (IPL) and the macular full thickness. The segmented images were reviewed and manual corrections carried out as needed. The GCIPL thickness was calculated by adding the GCL and IPL thickness. Although the original images were acquired along the fovea-disc (with older software) or FoBMO angle (GMPE software), a special plug-in software provided by Heidelberg Engineering allowed us to export the thickness measurements for 8×8 arrays of superpixels aligned along the horizontal meridian for all eyes regardless of the FoBMO angle (Figure 1). Images with signal strength <15 for Spectralis SD-OCT and <7 for Cirrus HD-OCT, obvious motion or blinking artifact, or incorrect segmentation were excluded.
Figure 1.
The vertical asymmetry comparison scheme for the 8×8 grid of the Spectralis SD-OCT. The numbers within superpixels denote the location of an individual superpixel.
Measurement of vertical asymmetry on Spectralis SD-OCT’s 8×8 grid
The average thickness difference between the 3 most temporal superpixels above and below the horizontal meridian (superpixels 5.1–5.3 vs. 4.1–4.3) and the second row of superpixels from the horizontal meridian (superpixels 6.1–6.3 vs. 3.1–3.3) was calculated (Figure 1). As a comparison, this difference was also calculated for 3 central superpixels above and below the horizontal meridian (superpixels 6.3–6.6 vs. 3.3–3.6).
Measurement of the FoBMO angle
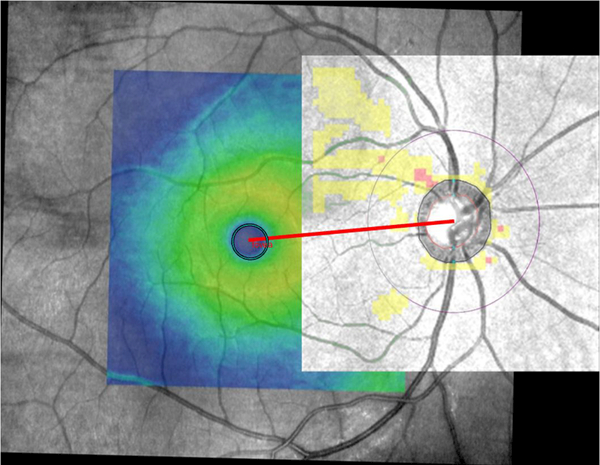
Since some of the available Spectralis SD-OCT images for eyes enrolled in this study were acquired with the older version of Spectralis software (prior to introduction of the Glaucoma Module Premium Edition), determination of the FoBMO angle was not possible on all Spectralis images. Hence, we used Cirrus SD-OCT images to estimate the FoBMO angle. A semi-automated, customized MATLAB program (ver. 2017; Mathworks, Cambridge, MA, USA) was developed to calculate the angle between the horizontal meridian and the line passing through the foveal center and the BMO center (FoBMO angle). The Optic Disc and Macula Cubes from Cirrus HD-OCT were co-registered as follows. First, for each eye, the cpslect function was utilized to select 10 to 15 corresponding control points manually on Macula and Optic Disc cubes before aligning them. Points had to be distributed uniformly with an accurate localization to avoid mis-registration and ghost lines. Once the parameters of geometric transformation between the input images were found, the macular SD-OCT infrared image with the color thickness map overlay was resampled in the coordinate system of the Optic Disc Cube. The former was used to find the foveal center. In this view, the program converted the thickness map overlay into a binary image through binary search thresholding. The resulting image was inverted so that white regions represented the object of interest, namely, the fovea. The regionprops function was then utilized to fit an ellipse to the fovea. The center of the BMO is defined by Cirrus HD-OCT. Cirrus HD-OCT’s automated algorithm identifies the inner termination of Bruch’s membrane opening. This boundary, as a contour line enclosing the disc, along with its center is displayed on Cirrus HD-OCT’s Optic Disc Cube images. Since the coordinates of both the foveal ellipse’s center and the BMO center are known on the registered Optic Disc and Macula Cube infrared images, calculation of the FoBMO angle is straightforward. FoBMO angles below the temporal horizontal meridian are expressed as negative numbers in this manuscript to be consistent with the literature. Figure 2 shows an example of FoBMO angle estimation on co-registered Macula and Optic Disc cubes.
Figure 2.
An example demonstrating co-registration of the Optic Disc and Macula cubes of Cirrus HD-OCT and subsequent estimation of the fovea-Bruch’s membrane (FoBMO) angle. The FoBMO angle was estimated to be 5.0 degrees in this right eye.
Statistical Analyses
We used histograms to explore distribution of numeric variables and created bivariate plots to explore correlation of various potential predictors with GCIPL asymmetry along the horizontal meridian. We then used univariable and multivariable regression analyses accounting for correlation of the two eyes to formally investigate potential factors affecting the GCIPL thickness difference across the horizontal meridian in normal eyes. Bivariate plots and univariable and multivariable regression analyses were used to explore the relationship of the FoBMO angle with the GCIPL thickness asymmetry between the rows immediately adjacent to the horizontal meridian, the next row above and below, and the central cluster of superpixels superiorly and inferiorly as described above. Intraclass correlation coefficient (ICC) was estimated in a separate group of 20 eyes with repeat SD-OCT images at different sessions within a year interval to measure reproducibility of our method for measuring the FoBMO angle.
Results
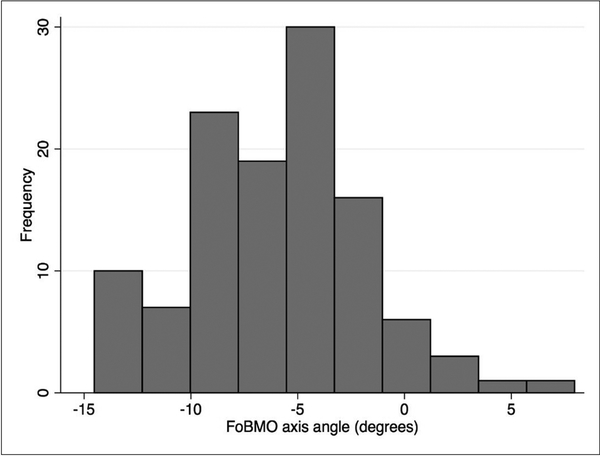
One hundred sixteen eyes of sixty patients were included in this study. The demographic and clinical characteristics of the study sample is described in Table 1. The study sample consisted of a diverse group of patients including 43% Whites, 37% Hispanic, and 10% African-American or Asian subjects. The median (interquartile range, IQR) axial length was 23.87 (23.06–24.58) mm. The median (IQR) FoBMO angle was –5.6˚ (–9.0˚ to –3.5˚) in the sample. Figure 3 shows the distribution of the FoBMO angle in the study group, which was skewed towards more negative values. The FoBMO angle was also estimated in 20 eyes that had repeat SD-OCT measurements within a year interval to calculate the reproducibility of our method for measuring the FoBMO angle. The ICC for duplicate measurements of the FoBMO angle was 0.874.
Table 1.
Demographic and clinical characteristics of the study sample.
| Variable | Median (IQR) | |
|---|---|---|
| Age (years) | 55.2 (50.3–62.6) | |
| Gender | ||
| Male | 27 (45%) | |
| Female | 33 (55%) | |
| Race | ||
| White | 26 (43.3%) | |
| African | 6 (10.0%) | |
| Hispanic | 22 (36.7%) | |
| Asian | 6(10.0%) | |
| FoBMO (degrees) | –5.6 (–9.0 to –3.5) | |
| Axial length (mm) | 23.87 (23.06–24.58) | |
| MD (dB) | –0.43 (–1.38 to 0.28) | |
| PSD (dB) | 1.56 (1.38–1.87) |
Figure 3.
Distribution the fovea-Bruch’s membrane opening (BMO) angle in the study subjects. A negative sign means that the foveal center was located below the BMO center.
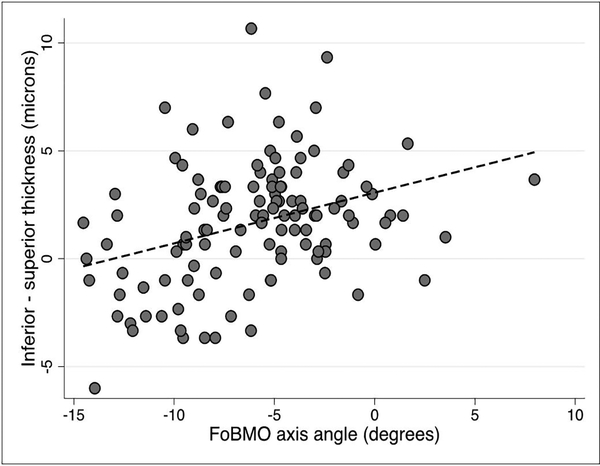
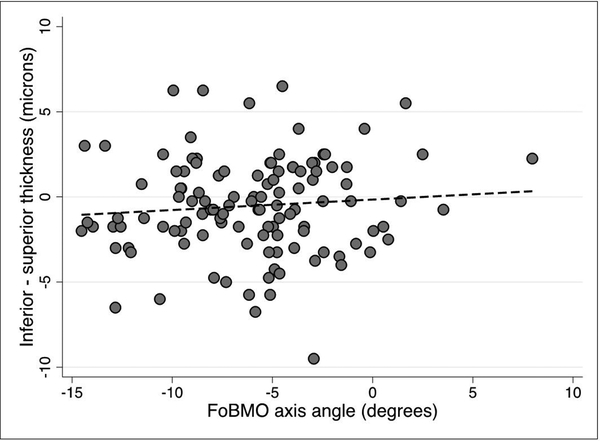
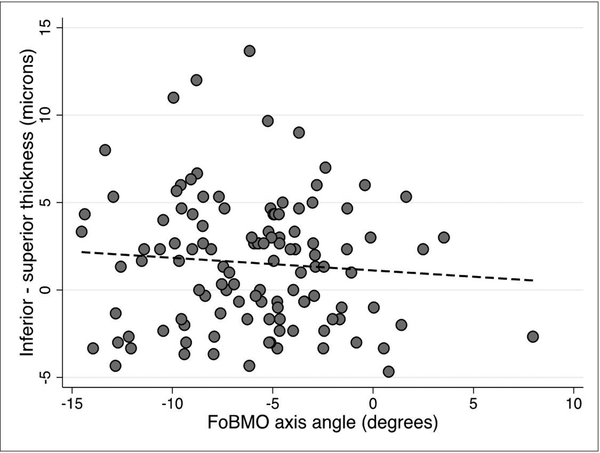
We explored whether any of the demographic or clinical factors that affect macular thickness could influence vertical GCIPL asymmetry. On univariable and multivariable prognostic models, none of the tested predictors, including age, race, gender, or axial length influenced vertical GCIPL asymmetry (p >0.05 for all). We then investigated the influence of the FoBMO angle on GCIPL thickness asymmetry in superpixels immediately adjacent to the horizontal meridian and the adjoining row of superpixels above and below along with the central midperipheral superpixels as a control (Figure 1). The median (IQR) difference in GCIPL thickness (inferior – superior) for the three sets of comparisons regardless of the FoBMO angle was 2 (0–3.3), 1.7 (–1.7 to 4.3) and –0.75 (–2.1 to 1.5) ¼m, respectively. Scatter plots demonstrating the influence of the FoBMO angle on the vertical GCIPL thickness asymmetry along the horizontal meridian are presented in Figures 4–6. A more positive FoBMO angle was associated with a higher relative thickness of the superior GCIPL compared to the inferior GCIPL for superpixels 5.1–5.3 compared to 4.1–4.3. This effect was consistent across both genders and all races (data not shown).
Figure 4.
Average inferior – superior GCIPL thickness for superpixels immediately adjacent to the horizontal meridian (5.1–5.3 minus 4.1–4.3) as a function of the FoBMO angle. The p value for the regression slope was <0.001.
Figure 6.
Average inferior – superior GCIPL thickness for midline superpixels (superpixels 6.3–6.6 vs. 3.3–3.6, see Figure 1) as a function of the FoBMO angle. The p value for the regression slope was 0.292.
Discussion
The main finding of our study was that the FoBMO angle can affect the GCIPL thickness symmetry along the temporal raphe; specifically, with increasingly negative (or downward tilted) FoBMO angles, the inferior GCIPL layer tended to become thinner compared to the superior row of superpixels immediately above the horizontal meridian. This finding was not observed when the row of superpixels beyond those immediately adjacent to the horizontal meridian were compared. The same was true for the comparison of clusters of midline inferior and superior superpixels which were used as a control group for the temporal superpixels. These findings have important clinical implications as new SD-OCT algorithms are developed for incorporating vertical macular thickness asymmetry for early detection of glaucoma. Vertical macular thickness asymmetry has unique and favorable characteristics as an index for detection of early glaucomatous damage. Results from the current study based on Spectralis SD-OCT measurements confirmed our previous report that local vertical asymmetry across the temporal raphe was not affected by any clinical or demographic factors such as age, gender, or axial length. 8 These factors influence absolute macular thickness measurements and hence, need to be accounted for when absolute macular thickness is used for diagnostic purposes. Interestingly, Yamashita and colleagues also found that the corresponding superior and inferior superpixels immediately adjacent to the temporal raphe demonstrated the strongest correlations in thickness among all superpixels from the 8×8 grid. 13 Estimation of the FoBMO angle on repeat SD-OCT images in a separate group of glaucoma eyes demonstrated a high ICC (0.874) meaning that our approach using MATLAB custom software was reproducible and reliable for this purpose.
Since glaucoma frequently starts as a localized thinning of the retinal ganglion cell axonal complex, vertical asymmetry measures have been explored for detecting regional differences across the temporal horizontal meridian. Several studies investigated the utility of macular vertical thickness asymmetry along the horizontal meridian for detection of early glaucoma. Asrani et al. were the first to emphasize the potential utility of measuring macular thickness and the asymmetry between the superior and inferior hemiretinas in patients with glaucoma. 18 Yamada and colleagues found that the discriminating ability of a global vertical asymmetry index based on GCL thickness was better than absolute thickness measures. 4 Similar findings were reported by Kim et al. with a GCIPL thickness-based asymmetry measure in Korean subjects. 6,7 On the other hand, Sharifipour et al. reported that the regional GCIPL thickness measures (minimum GCIPL or inferotemporal GCIPL sector) outperformed vertical GCIPL thickness asymmetry along the temporal horizontal midline for detection of early glaucoma in a diverse sample of patients from the US. 8 However, combining the local asymmetry index and either the inferotemporal or minimal GCIPL thickness enhanced SD-OCT’s ability to discriminate early glaucoma eyes from normal eyes. The effectiveness of asymmetry analysis is limited by the high between-subject variability in normal subjects; Alluwimi et al. recently reported that clustering of macular superpixels reduced between-subject variability and potentially improved performance of asymmetry analysis for identifying early glaucomatous damage in the macula. 19
Our previous findings and those of Kim et al. strongly suggest that the vertical GCIPL thickness asymmetry in the macular region immediately adjacent to the horizontal meridian has the best discriminating ability for separating glaucoma from normal eyes. 6,8 We found, however, that the relative GCIPL thickness in superpixels adjacent to the temporal horizontal meridian varies as a function of the FoBMO angle. One could argue that as the FoBMO angle becomes more negative, a smaller number of RGCs tend to project to the inferior half of the ONH and therefore, the inferior GCIPL thickness would tend to decrease relative to superior superpixels. The temporal raphe angle cannot be easily measured on current clinical macular SD-OCT images; therefore, factors influencing the raphe location such as the FoBMO angle need to be taken into account in software algorithms employing vertical asymmetry as an indicator for presence of glaucoma.
Previous reports on the relationship between the FoBMO angle and temporal raphe angle suggested a direct correlation between the two; i.e., a more negative or tilted FoBMO angle was associated with a more tilted or downward sloping temporal raphe angle. 10–12 The findings by these investigators also emphasize the difficulty of measuring the exact angle of the temporal raphe in relation to the horizontal meridian even with customized imaging protocols. Not only are there interdigitations between the RGC axons at the raphe but also the raphe gap widens in glaucoma eyes adding to the inaccuracy of raphe angle measurements. 11,12 Similar to our findings, Bedggood et al. found that the temporal raphe was not affected by any demographic or clinical parameters except the FoBMO axis (r2= 0.27–0.36). 20 They also investigated how accurately various other anatomical measurements predict the raphe location. They found that assuming the temporal raphe to be a continuation of the FoBMO axis led to the largest prediction errors whereas a linear model predicting temporal raphe angle from the FoBMO angle resulted in the smallest error. The magnitude of the FoBMO angle deviation from the horizontal meridian is on average smaller than the corresponding FoBMO axis. Most studies addressing changes in the temporal raphe have measured the temporal raphe angle in the RNFL rather than GCIPL. There is no a priori reason to believe that the GCIPL raphe angle would be substantially different than the RNFL raphe angle in relation to the horizontal meridian. Preliminary evidence in the literature suggests that this assumption is justified. 6,7,9 One could, therefore, argue that the vertical asymmetry algorithms of SD-OCT devices should consider the variable nature of the temporal raphe by adjusting for the FoBMO angle. Ideally, direct estimation of the temporal raphe angle would be desirable once it can be performed quickly and with good reproducibility in the clinical setting. While most current work has been done on the RNFL raphe, it has yet to be determined whether there is a clear-cut GCIPL raphe and whether it can be measured. Ooto and colleagues demonstrated that GCL thickness was significantly lower in the temporal region compared to the nasal region of the macula, but thickness maps displayed vertical symmetry for all layers including the inner retinal layers. 21
One of the limitations of the current study is the fairly small number of the subjects included and hence, we may not have had an adequate power to measure small influences that clinical or anatomical parameters might have on the temporal vertical symmetry.
In summary, we found that the vertical GCIPL thickness asymmetry was not affected by factors known to affect absolute GCIPL thickness such as age, gender, or axial length. The GCIPL thickness asymmetry in superpixels adjacent to the temporal raphe was correlated with the FoBMO angle such that the inferior GCIPL became relatively thinner with more inferior tilting of the FoBMO angle. These findings have important implications for incorporating vertical macular thickness asymmetry as a summary index in SD-OCT devices.
Figure 5.
Average inferior – superior GCIPL thickness for superpixels one row off from the horizontal meridian (i.e., superpixels 6.1–6.3 minus 3.1–3.3, see Figure 1) as a function of the FoBMO angle. The p value for the regression slope was 0.349.
Acknowledgments
This study was supported by an unrestricted research grant from Heidelberg Engineering and an unrestricted Departmental Grant from Research to Prevent Blindness.
Bibliography
- 1.Bussel II, Wollstein G, Schuman JS. OCT for glaucoma diagnosis, screening and detection of glaucoma progression. Br J Ophthalmol. July 2014;98 Suppl 2:ii15–19. [DOI] [PMC free article] [PubMed] [Google Scholar]
- 2.Kotera Y, Hangai M, Hirose F, Mori S, Yoshimura N. Three-dimensional imaging of macular inner structures in glaucoma by using spectral-domain optical coherence tomography. Invest Ophthalmol Vis Sci. March 14 2011;52(3):1412–1421. [DOI] [PubMed] [Google Scholar]
- 3.Um TW, Sung KR, Wollstein G, Yun SC, Na JH, Schuman JS. Asymmetry in hemifield macular thickness as an early indicator of glaucomatous change. Invest Ophthalmol Vis Sci. March 2012;53(3):1139–1144. [DOI] [PMC free article] [PubMed] [Google Scholar]
- 4.Yamada H, Hangai M, Nakano N, et al. Asymmetry analysis of macular inner retinal layers for glaucoma diagnosis. Am J Ophthalmol. December 2014;158(6):1318–1329.e1313. [DOI] [PubMed] [Google Scholar]
- 5.Hwang YH, Ahn SI, Ko SJ. Diagnostic ability of macular ganglion cell asymmetry for glaucoma. Clin Exp Ophthalmol. November 2015;43(8):720–726. [DOI] [PubMed] [Google Scholar]
- 6.Kim YK, Yoo BW, Kim HC, Park KH. Automated Detection of Hemifield Difference across Horizontal Raphe on Ganglion Cell--Inner Plexiform Layer Thickness Map. Ophthalmology. Nov 2015;122(11):2252–2260. [DOI] [PubMed] [Google Scholar]
- 7.Kim YK, Yoo BW, Jeoung JW, Kim HC, Kim HJ, Park KH. Glaucoma-Diagnostic Ability of Ganglion Cell-Inner Plexiform Layer Thickness Difference Across Temporal Raphe in Highly Myopic Eyes. Invest Ophthalmol Vis Sci. November 01 2016;57(14):5856–5863. [DOI] [PubMed] [Google Scholar]
- 8.Sharifipour F, Morales E, Lee JW, et al. Vertical Macular Asymmetry Measures Derived From SD-OCT for Detection of Early Glaucoma. Invest Ophthalmol Vis Sci. August 1 2017;58(10):4310–4317. [DOI] [PMC free article] [PubMed] [Google Scholar]
- 9.Amini N, Nowroozizadeh S, Cirineo N, et al. Influence of the disc-fovea angle on limits of RNFL variability and glaucoma discrimination. Invest Ophthalmol Vis Sci. November 2014;55(11):7332–7342. [DOI] [PMC free article] [PubMed] [Google Scholar]
- 10.Chauhan BC, Sharpe GP, Hutchison DM. Imaging of the Temporal Raphe with Optical Coherence Tomography. Ophthalmology. August 2014. [DOI] [PubMed] [Google Scholar]
- 11.Huang G, Gast TJ, Burns SA. In-vivo Adaptive Optics imaging of the temporal raphe and its relationship to the optic disc and fovea in the human retina. Invest Ophthalmol Vis Sci. August 2014. [DOI] [PMC free article] [PubMed] [Google Scholar]
- 12.Bedggood P, Tanabe F, McKendrick AM, Turpin A. Automatic identification of the temporal retinal nerve fiber raphe from macular cube data. Biomed Opt Express. October 1 2016;7(10):4043–4053. [DOI] [PMC free article] [PubMed] [Google Scholar]
- 13.Yamashita T, Sakamoto T, Kakiuchi N, Tanaka M, Kii Y, Nakao K. Posterior pole asymmetry analyses of retinal thickness of upper and lower sectors and their association with peak retinal nerve fiber layer thickness in healthy young eyes. Invest Ophthalmol Vis Sci. August 12 2014;55(9):5673–5678. [DOI] [PubMed] [Google Scholar]
- 14.He L, Ren R, Yang H, et al. Anatomic vs. acquired image frame discordance in spectral domain optical coherence tomography minimum rim measurements. PLoS One. 2014;9(3):e92225. [DOI] [PMC free article] [PubMed] [Google Scholar]
- 15.Jansonius NM, Nevalainen J, Selig B, et al. A mathematical description of nerve fiber bundle trajectories and their variability in the human retina. Vision Res. August 2009;49(17):2157–2163. [DOI] [PMC free article] [PubMed] [Google Scholar]
- 16.Hood DC, Raza AS, de Moraes CG, Liebmann JM, Ritch R. Glaucomatous damage of the macula. Prog Retin Eye Res. January 2013;32:1–21. [DOI] [PMC free article] [PubMed] [Google Scholar]
- 17.Johnson CA, Sample PA, Cioffi GA, Liebmann JR, Weinreb RN. Structure and function evaluation (SAFE): I. criteria for glaucomatous visual field loss using standard automated perimetry (SAP) and short wavelength automated perimetry (SWAP). Am J Ophthalmol. August 2002;134(2):177–185. [DOI] [PubMed] [Google Scholar]
- 18.Asrani S, Rosdahl JA, Allingham RR. Novel software strategy for glaucoma diagnosis: asymmetry analysis of retinal thickness. Arch Ophthalmol. September 2011;129(9):1205–1211. [DOI] [PubMed] [Google Scholar]
- 19.Alluwimi MS, Swanson WH, King BJ. Identifying Glaucomatous Damage to the Macula. Optom Vis Sci. February 2018;95(2):96–105. [DOI] [PMC free article] [PubMed] [Google Scholar]
- 20.Bedggood P, Nguyen B, Lakkis G, Turpin A, McKendrick AM. Orientation of the Temporal Nerve Fiber Raphe in Healthy and in Glaucomatous Eyes. Invest Ophthalmol Vis Sci. August 1 2017;58(10):4211–4217. [DOI] [PubMed] [Google Scholar]
- 21.Ooto S, Hangai M, Tomidokoro A, et al. Effects of age, sex, and axial length on the three-dimensional profile of normal macular layer structures. Invest Ophthalmol Vis Sci. November 11 2011;52(12):8769–8779. [DOI] [PubMed] [Google Scholar]


