

Abstract
Fibrous dysplasia (FD) is a mosaic disorder of benign fibro-osseous lesions, which may be associated with extraskeletal features as part of McCune-Albright syndrome (MAS). Cranial base abnormalities, including Chiari I malformation (CM1), in which the cerebellum extends below the foramen magnum, and secondary basilar invagination (BI), in which the odontoid prolapses into the posterior cranial fossa, are potentially serious complications of metabolic bone disorders. The purpose of this study was to determine the prevalence, natural history, and risk factors for CM1 and BI in patients with FD/MAS, and to determine mechanisms of cranial base deformities. Clinical and radiographic data from subjects in an FD/MAS natural history study were evaluated and compared to normal controls. In 158 patients with craniofacial FD, 10 (6.3%) cases of CM1 and 12 (7.6%) cases of BI were diagnosed. No cranial base abnormalities were identified in 10 control subjects. Craniomorphometric and volumetric analyses identified cranial constriction and cranial settling as the primary mechanisms of cranial base abnormalities, whereas intracranial hypertension was a contributing factor in a minority of subjects. Longitudinal analyses found progression of odontoid position with age, but no progression of tonsillar position. No endocrinopathies were associated with CM1. MAS endocrinopathies associated with BI included hyperthyroidism (odds ratio [OR] 12.0; 95% confidence interval [CI], 2.9 to 55.6; p < 0.01), precocious puberty (OR 5.6; 95% CI, 1.2 to 26.0; p < 0.05), and hypophosphatemia (OR 7.7; 95% CI, 1.9 to 27.0; p < 0.01). Scoliosis was associated with both CM1 (OR 4.8; 95% CI, 1.1 to 22.8; p < 0.05) and BI (OR = in finity; 95% CI, 4.7 to infinity; p < 0.01). This study successfully characterized cranial base abnormalities in FD/MAS and the pathophysiological connection between them. These findings support routine screening for cranial base abnormalities in patients with craniofacial FD, as well as aggressive management of contributory risk factors.
Keywords: DISEASES AND DISORDERS OF/RELATED TO BONE, OSTEOMALACIA AND RICKETS, BONE-BRAIN-NERVOUS SYSTEM INTERACTIONS, SYSTEMS BIOLOGY, BONE INTERACTORS
Introduction
Fibrous dysplasia (FD) is an uncommon disorder of benign, expansile fibro-osseous lesions. It arises due to somatic activating mutations in GNAS, which disrupt the differentiation of skeletal progenitor cells.(1,2) FD may occur in isolation or in association with skin macules and hyperfunctioning endocrinopathies, including precocious puberty, hyperthyroidism, growth hormone excess, neonatal hypercortisolism, and FGF23-mediated hypophosphatemia.(3,4) The combination of FD and extraskeletal features is termed McCune-Albright syndrome (MAS). FD/MAS is a mosaic disease with a highly variable phenotype. FD lesions can be monostotic or polyostotic, and range in severity from trivial to debilitating. The craniofacial region is one of the most commonly affected areas.(5) Clinical manifestations include facial asymmetry, and less commonly functional deficits, such as malocclusion, vision changes, or hearing loss.(6) Serious neurologic complications involving the cranial base have also been reported.(7–10)
Cranial base deformities are a known complication of metabolic bone diseases,(11–13) and may rarely result in life-threatening compression of the cerebellum and spinal cord. Secondary basilar invagination (BI) arises when bony weakness permits distortion of the craniovertebral junction, resulting in rostral malpositioning of the cervical spine.(8,14–16) This displacement may occur in association with Chiari I malformation (CM1), a hindbrain deformity characterized by displacement of the cerebellar tonsils into the spinal canal. In both instances, there is a functional narrowing of the foramen magnum with attendant compression of vital neural structures. Although the causal mechanism of BI in bone disorders is well described, the mechanism of CM1 development is more complex, and likely multifactorial. In deforming bone disorders such as FD, cranial constriction likely contributes to CM1 secondary to skeletal expansion. In addition, cranial settling, or distortion of the craniovertebral junction, may cause BI and CM1. Additional potential mechanisms of CM1 development include intracranial hypertension, intraspinal hypo-tension, and spinal cord tethering.(17) However, the precise mechanism of CM1 development in craniofacial FD has not been described, and the relationship with BI has not been explored. Furthermore, the contribution of MAS-related endocrinopathies, with the potential to affect the mechanical integrity of bone, has not been established.
The purpose of this study was to (i) define the relationship between craniofacial FD and the cranial base abnormalities CM1 and BI, by determining the prevalence and natural history in a large cohort of well characterized patients, (ii) examine cranial morphology to determine causal mechanisms of CM1 in this population, and (iii) determine associated risk factors for CM1 and BI development in order to define clinical management for patients with FD/MAS.
Subjects and Methods
Study population
Subjects were evaluated at the NIH Clinical Center as part of a long-standing natural history study in FD/MAS. All subjects and/or guardians gave informed consent/assent, and the study was approved by the Institutional Review Board of the National Institute of Dental and Craniofacial Research. Subjects were diagnosed on clinical grounds with molecular diagnosis as needed, according to previously published guidelines.(3)
Cranial imaging, computed tomography (CT), and/or magnetic resonance imaging (MRI), was obtained prospectively as part of the natural history study, and retrospectively reviewed for this study. All subjects with suspected craniofacial FD underwent CT evaluation. MRIs were performed on an individual basis to evaluate the pituitary gland and other extraskeletal features. Subjects who had a head CT with axial sections less than 5 mm were included in the analyses. Of 214 total subjects with FD/MAS, 171 met inclusion criteria, of whom 158 had craniofacial FD; 13 had no evidence of craniofacial FD (Fig. 1). The NIH Biomedical Translational Research Information System provided control head CTs with axial sections less than 5 mm from 10 healthy volunteers without craniofacial abnormalities.(18)
Fig. 1.

Study population flowchart. FD/MAS = fibrous dysplasia/McCune-Albright syndrome; craniofacial FD = craniofacial fibrous dysplasia.
Clinical records were reviewed for signs and symptoms related to CM1 and/or BI (cerebellar signs, cervicomedullary compression syndromes, signs of increased cranial pressure), history of bisphosphonate use, and history of craniocervical surgical intervention.(19) Clinical data were evaluated regarding MAS-related endocrinopathies. FD disease burden was evaluated in subjects with bone scintigraphy scans (n = 152), using skeletal burden score, a validated tool to quantify FD.(20) Imaging studies were examined for other relevant cranial and vertebral pathology associated with FD/MAS, CM1, or BI (scoliosis, cervical FD, vertebral fracture, spinal stenosis, aneurysmal bone cysts, intracranial masses, and syringomyelia).
Craniomorphometric evaluation
The radiographic diagnosis of CM1 is typically made using T1-weighted MRI.(21,22) In contrast, CT better visualizes bony structures and is preferred for evaluation of BI and posterior cranial fossa morphometrics. Because CT scans were performed on all 171 subjects, and MRI scans only on 93, CT scans were used for the radiographic diagnosis of CM1. To validate use of CT for diagnosing CM1, tonsillar position measurements were compared in 56 pairs of concurrent CT and MRI images. Tonsillar position was highly correlated on MRI and CT (Spearman r = 0.90, p < 0.001). Linear regression analysis revealed a slope of 0.92 ± 0.03 (r2 = 0.93, F(1,54) = 697.2, p < 0.0001) (Fig. 2A–E). Therefore, evaluation for CM1 proceeded using CT studies.
Fig. 2.
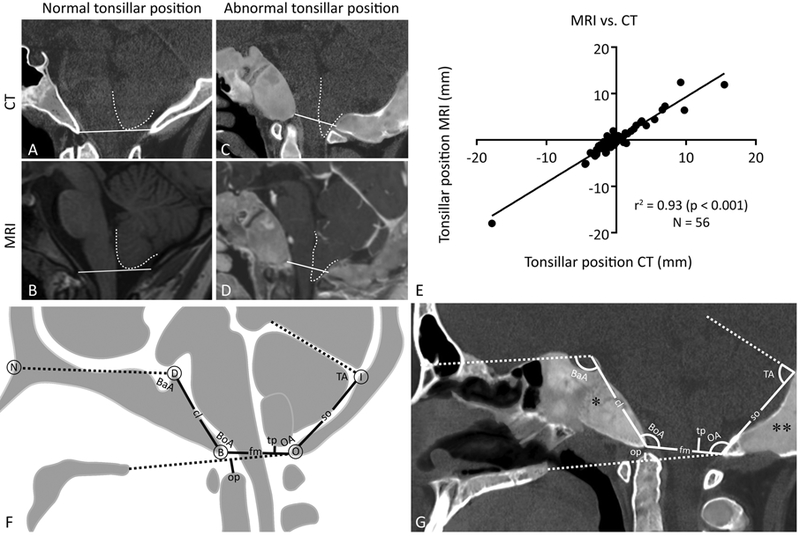
Craniomorphometric evaluation of the posterior cranial fossa. (A–E) CT and MRI tonsillar position correlation. Normal tonsillar position (white dotted outline) relative to McRae’s line (white solid line) on (A) CT and (B) T1-weighted MRI. Abnormal tonsillar position relative to McRae’s line on (C) CT and (D) T1-weighted FFE sequence MRI. (A, C) CT images are layered images with superimposed soft tissue and bone windowing. (E) Linear regression analysis of tonsillar position on CT versus MRI. (F, G) Craniomorphometric landmarks and measurements. Solid lines correspond to linear measurements and dashedlines represent component parts of angles of interest or reference lines. (F) Diagram of linear (mm) and angular (degrees) measurements: clivus length (cl)—apex of the dorsum sellae (D) to the basion (B); foramen magnum length (fm)—basion (B) to the opisthion (O); supraocciput length (so)—opisthion (O) to the internal occipital protuberance (I); tonsillar position (tp)—lowest point of the cerebellar tonsils to the line extending from the basion (B) to the opisthion (O) (McRae’s line); odontoid position (op)—tip of the odontoid process to the line extending from the posterior edge of the hard palate to the opisthion (O) (Chamberlain’s line); Basal angle (BaA)—angle formed by the nasion (N), dorsum sellae (D), and basion (B); Boogaard angle (BoA)—angle formed by the dorsum sellae (D), basion (B), and opisthion (O); Occipital angle (OA)—angle formed by the opisthion (O), internal occipital protuberance (I), and tentorium cerebelli. (G) Measurements demonstrated on a CT of a subject with craniofacial fibrous dysplasia. Note the expansile areas of fibrous dysplasia, with typical homogeneous, “ground glass” echogenicity, affecting the clivus (*) and supraocciput (**). FFE = fast field echo.
Morphometric evaluation of the posterior cranial fossa and craniovertebral junction is an accepted method to characterize cranial base deformities and predict causal mechanisms.(17,23,24) Craniomorphometric measurements were made according to methods specified in the National Institute of Neurological Disorders and Stroke Common Data Elements (http://www.commondataelements.ninds.nih.gov/). All measurements were performed by a single trained observer (KSP) and confirmed by a neurosurgeon (JDH), using image analysis software, Osirix.(25) The following seven measurements of the posterior cranial fossa were recorded from CT images in the midsagittal plane (Fig. 2F, G): (i) clivus length, (ii) foramen magnum length, (iii) supraocciput length, (iv) basal angle, (v) Boogaard angle, (vi) occipital angle, and (vii) tentorial angle.
Two additional measurements were obtained to identify the presence of CM1 and/or BI: (i) tonsillar position: perpendicular distance from the most inferior part of the lowest cerebellar tonsil to a line drawn from basion to opisthion (McRae’s line) where position inferior to McRae’s line is a positive value, and position superior to McRae’s line is a negative value, and (ii) odontoid position: distance from the tip of the odontoid perpendicular to a line drawn from the posterior margin of the hard palate to opisthion (Chamberlain’s line) where position superior to Chamberlain’s line is a positive value, and position inferior to Chamberlain’s line is a negative value. The diagnosis of CM1 was made using the radiographic definition of tonsillar position ≥5 mm below McRae’s line.(26) BI was diagnosed if the odontoid position extended ≥5 mm above Chamberlain’s line.(13,27)
To account for age-related changes of the skull and cerebellum, including foramen magnum size and cerebellar position, an adult-only subgroup (age 15 to 69 years) was separately analyzed, and compared to the entire cohort.(28–30)
Posterior cranial fossa volume
To assess for cranial constriction secondary to skeletal expansion or BI, posterior cranial fossa volume (PCFV) was measured. PCFV increases with age until closure of all cranial base synchondroses by age 6 years. To avoid confounding factors of PCFV growth in children, only adults (age 15 to 69 years) were included in the volumetric analysis.(30) PCFV was measured in subjects diagnosed with CM1 and/or BI and compared to subjects with craniofacial FD alone, matched for age and skeletal disease burden. PCFV was also measured in all subjects in the No craniofacial FD and control groups. Using Osirix imaging analysis software, the posterior cranial fossa was first outlined on sagittal CT images as the region of interest (ROI), and then a semiautomatic propagation function outlined the rest of the posterior fossa in the remaining CT slices. The PCFV was calculated from the outlined ROI (PCFV = Σ (A1, A2, . . ., Az) × CT slice thickness).
Longitudinal analyses
Longitudinal data was available for 90 subjects with craniofacial FD. A total of 382 scans were analyzed (median 2 CT scans per subject, range 2 to 11 scans; median interval between scans 1.2 years, range 0.2 to 14.3 years). Overall change in tonsillar and odontoid positions was examined from each subject’s first and last CT scan. Then, age-related progression was examined, and the potential effects of clinical factors including MAS-related endocrinopathies, scoliosis, bisphosphonate treatment, and skeletal disease burden were considered. Skeletal burden scores were available for 88 of the 90 subjects.
Statistical analyses
Statistical analyses were performed using GraphPad Prism version 7.03 for Windows (GraphPad Software, La Jolla, CA, USA; https://www.graphpad.com/), and SPSS Statistics version 25.0 for Windows (IBM Corp., Armonk, NY, USA). Spearman correlation and linear regression analyses were used to compare CT and MRI findings. Kruskal-Wallis and Dunn’s multiple comparisons tests were used to detect craniomorphometric and volumetric differences between groups. Mixed model regression analysis was used to model longitudinal data in order to account for within-subject correlation, repeated measures, and unbalanced data. Fisher’s exact test was used to examine the significance of contingency between subjects with and without cranial base deformities and FD/MAS clinical associations. Binary logistic regression was used for multivariable analysis of clinical data. Results are expressed as medians with absolute ranges, unless otherwise indicated.
Results
Craniomorphometric evaluation
Subject characteristics are described in Table 1. CM1 was identified in 10 subjects in the craniofacial FD group, which was then divided into two groups for analysis, CM1 and No CM1 (Fig. 1). Measurements were compared between the CM1, No CM1, No craniofacial FD, and control groups (Fig. 3A–D) (Table 2). Foramen magnum length, Boogaard angle (a measure of platybasia), odontoid position, and tonsillar position were significantly different between groups. Foramen magnum length was shorter in the CM1 group compared to the No craniofacial FD and control groups. Boogaard angle was increased in the CM1 group compared to the No craniofacial FD and control groups. It was also increased in the No CM1 group compared to the No craniofacial FD group. Odontoid position was increased in the CM1 group compared to all other groups. By definition, tonsillar position was increased in the CM1 group compared to all other groups. Similar findings were observed in the adult-only analysis (Supporting Table 1).
Table 1.
Subject Characteristics
| Variable | FD/MAS | No FD/MAS | |
|---|---|---|---|
| Craniofacial FD | No craniofacial FD | Controls | |
| Total subjects (n) | 158 | 13 | 10 |
| Gender, n | |||
| Male | 65 | 5 | 4 |
| Female | 93 | 8 | 6 |
| Age (years), median (range) | 19 (2–84)a | 34 (6–54) | 46 (9–70) |
| Chiari 1 malformation, n (%) | 10 (6.3) | 0 | 0 |
| Basilar invagination, n (%) | 12(7.6) | 0 | 0 |
FD = fibrous dysplasia; MAS McCune-Albright syndrome.
Significant compared to controls (p < 0.05).
Fig. 3.

Representative radiographic findings in subjects with craniofacial fibrous dysplasia. (A, B) Parasagittal head CT of a normal control. (C, D) Parasagittal head CT of a subject with craniofacial fibrous dysplasia (solid black outline) and Chiari I malformation. (F, G) Midsagittal head CT of a subject with craniofacial fibrous dysplasia (solid black outline) and basilar invagination. Cerebellar tonsils (dotted white outline) and odontoid processes (dotted black outline) are demonstrated relative to reference lines (solid white). (E) Parasagittal T2-weighted MRI of subject with Chiari I malformation (dotted outline), syrinx (*), and aneurysmal bone cyst (**). (H) Midsagittal T1-weighted MRI of basilar invagination and mass effect (arrow).
Table 2.
Craniomorphometric and Volumetric Evaluation of Subjects With Chiari I Malformation
| Variable | FD/MAS + craniofacial FD | FD/MAS | No FD/MAS | |
|---|---|---|---|---|
| Chiari 1 malformation (n = 10) |
No Chiari 1 malformation (n = 148) |
No craniofacial FD (n = 13) |
Controls (n = 10) |
|
| Clivus length (mm) | 45.1 (36.9–51.8) | 44.1 (31.3–60.8) | 45.3 (39.1–49.3) | 45.3 (39.0–50.4) |
| Foramen magnum length (mm) |
30.6 (24.4–36.8)b,c | 34.1 (20.3–41.5) | 35.8 (33.3–38.7) | 36.0 (31.5–40.5) |
| Supraocciput length (mm) | 41.3 (33.6–48.9) | 40.7 (30.6–58.8) | 40.9 (34.0–45.4) | 39.9 (33.7–45.5) |
| Boogaard angle (degrees) | 133 (117–152)b,c | 124 (104–153)b | 117 (109–129) | 120 (113–123) |
| Basal angle (degrees) | 121 (115–130) | 118 (100–134) | 118 (110–129) | 120 (107–124) |
| Occipital angle (degrees) | 131 (113–137) | 131 (97–161) | 131 (124–144) | 133 (121–142) |
| Tentorial angle (degrees) | 85 (76–106) | 89 (56–107) | 91 (75–105) | 93 (83–106) |
| Odontoid position (mm) | 2.6 (−1.5 to 20.7)a,b,c | −0.6 (−10.1 to 14.9) | −2.1 (−8.6 to 1.6) | −1.7 (−6.4 to −0.5) |
| Tonsillar position (mm) | 8.3 (5.5–15.5)a,b,c | −0.4 (−17.8 to 4.3) | 1.5 (−3.4 to 3.7) | −0.8 (−4.1 to 1.9) |
| Posterior cranial fossa volume (cm3)d |
159.8 (147.9–172.1)b,c | 175.4 (150.3–211.4) | 175.6 (157.9–193.0) | 183.2 (161.7–216.6) |
Variables expressed as medians with absolute ranges in parentheses.
FD = fibrous dysplasia; MAS McCune-Albright syndrome.
Significant compared to no¼Chiari 1 malformation group (p < 0.05).
Significant compared to no craniofacial FD group (p < 0.05).
Significant compared to control group (p < 0.05).
Posterior cranial fossa volume sub-analysis was performed in the following subjects: Chiari I malformation (n = 10), no Chiari 1 malformation (matched by age and skeletal disease burden; n = 20), no craniofacial FD (n = 10), controls (n = 8).
BI was identified in 12 subjects in the craniofacial FD group, which was then divided into two groups for analysis, BI and No BI (Fig. 1). Three subjects with BI also had CM1. Craniomorphometric measurements were compared between the BI, No BI, No craniofacial FD, and control groups (Fig. 3F,G) (Table 3). Foramen magnum length, Boogaard angle, tentorial angle, and odontoid position were significantly different between groups. Foramen magnum length and tentorial angle were decreased in the BI group compared to all other groups. Boogaard angle was increased in the BI group compared to all other groups. It was also increased in the No BI group compared to the No craniofacial FD group. By definition, odontoid position was increased in the BI group compared to all other groups. Similar findings were observed in the adult-only analysis (Supporting Table 2).
Table 3.
Craniomorphometric and Volumetric Evaluation of Subjects With Basilar Invagination
| Variable | FD/MAS + craniofacial FD | FD/MAS | No FD/MAS | |
|---|---|---|---|---|
| Basilar invagination (n = 12) |
No basilar invagination (n = 146) |
No craniofacial FD (n = 13) |
Controls (n = 10) |
|
| Clivus length (mm) | 43.3 (31.3–54.3) | 44.5 (32.6–60.8) | 45.3 (39.1–49.3) | 45.3 (39–50.4) |
| Foramen magnum length (mm) | 29.9 (23.0–34.4)a,b,c | 34.1 (20.3–41.5) | 35.8 (33.3–38.7) | 36.0(31.5–40.5) |
| Supraocciput length (mm) | 43.4 (36.3–53.9) | 40.6 (30.6–58.8) | 40.9 (34.0–45.4) | 39.9 (33.7–45.5) |
| Boogaard angle (degrees) | 139 (126–153)a,b,c | 123 (104–161)b | 117 (109–129) | 120 (113–123) |
| Basal angle (degrees) | 120 (116–130) | 119 (100–134) | 118 (110–129) | 120 (107–124) |
| Occipital angle (degrees) | 126 (97–143) | 131 (100–139) | 131 (124–144) | 133 (121–142) |
| Tentorial angle (degrees) | 78 (56–100)a,b,c | 90 (65–107) | 91 (75–105) | 93 (83–106) |
| Odontoid position (mm) | 7.2 (5.2–20.7)a,b,c | −0.6 (−10.1 to 4.8) | −2.1 (−8.6 to 1.6) | −1.7 (−6.4 to −0.5) |
| Tonsillar position (mm) | 2.2 (−5.0 to 9.8) | −0.3 (−17.8 to 15.5) | 1.5 (−3.4 to 3.7) | −0.8 (−4.1 to 1.9) |
| Posterior cranial fossa volume (cm3)d |
158.8 (140.6–193.8) | 167.4 (147.8–211.4) | 175.6 (157.9–193.0) | 183.2 (161.7–216.6) |
Variables expressed as medians with absolute ranges in parentheses.
FD = fibrous dysplasia; MAS McCune-Albright syndrome.
Significant compared to no basilar invagination group (p < 0.05).
Significant compared to no craniofacial FD group (p < 0.05).
Significant compared to control group (p < 0.05).
Posterior cranial fossa volume subanalysis was performed in the following subjects: basilar invagination (n = 10), no basilar invagination (matched by age and skeletal disease burden, n = 20), no craniofacial FD (n = 10), controls (n = 8).
PCFV
PCFV in the CM1 group was compared to the No craniofacial FD and control groups, as well as select subjects in the No CM1 group matched for age and skeletal disease severity (Table 2). A significant difference in PCFV was observed between these groups. PCFV in CM1 was decreased compared to the No craniofacial FD and control groups, suggesting cranial constriction as a causative mechanism. As expected, no differences in PCFV were observed in the BI analysis (Table 3).
Longitudinal analyses
Longitudinal data were used to assess natural history and progression of tonsillar and odontoid positions. Eight subjects had evidence of CM1 at the time of initial CT. One subject, who initially had normal tonsillar position, developed CM1 over 15 years. Similarly, eight subjects had evidence of BI at the time of initial CT. Three subjects developed BI over time (median follow-up 8 years, range 3 to 15 years).
Mixed model regression analysis was used to model change in tonsillar and odontoid positions with age (Supporting Tables 3 and 4). Overall, tonsillar position did not significantly change with age. In contrast, odontoid position demonstrated a mean progression rate of 0.32 mm/year (standard error [SE] 0.03, p < 0.001) (Table 4). However, the rate of change decreased with age. Skeletal burden score was the only clinical factor that significantly affected odontoid position over time; on average, odontoid position increased 0.07 mm per skeletal burden score unit (sbsu) (p < 0.005).
Table 4.
Longitudinal Analysis: Progression of Odontoid Position
| Parametera | Mean±SE | p |
|---|---|---|
| Initial odontoid position (mm) | −5.50 ±0.88 | <0.001 |
| Progression rate (mm/year) | 0.32 ± 0.02 | <0.001 |
| ∆ Progression rate (mm/year) |
−0.004 ± 0.001 | <0.001 |
| Effect of skeletal disease burden (mm/sbsu) |
0.07 ± 0.03 | <0.005 |
sbsu = skeletal burden score unit.
Based on mixed model regression coefficients (Supporting Table 3).
Other clinical and radiographic findings
Clinical records of subjects with CM1 and/or BI (n = 19) were examined for possible signs and symptoms of CM1 and BI. Headache and visual disturbances were the most commonly reported symptoms (7 subjects, 36.8%), followed by pain and paresthesia (5 subjects, 26.3%). Cerebellar signs, including ataxia (1 subject), vertigo (3 subjects, 15.8%), and lower cranial nerve palsies, including dysphagia and loss of gag reflex (2 subjects, 10.5%) were also reported. Two subjects (10.5%) had evidence of papilledema on physical exam.
Clinical records were reviewed for history of surgical intervention related to CM1 and/or BI. Of the 19 subjects with cranial base deformities, two subjects (10.5%) required cervical stabilization surgery. One subject who had both CM1 and BI required posterior cranial fossa decompression surgery in addition to cervical stabilization for neurologic dysfunction related to brainstem compression and syringomyelia. Four subjects (21.1%) had history of spinal fusion procedures for scoliosis.
The prevalence of MAS-related endocrinopathies (hyperthyroidism, FGF23-mediated hypophosphatemia, precocious puberty, and growth hormone excess) and scoliosis were compared between the craniofacial FD groups (Supporting Fig. 1). No endocrinopathies were associated with CM1. However, hyperthyroidism (odds ratio [OR] 12.0; 95% confidence interval [CI], 2.9 to 55.6; p < 0.01), precocious puberty (OR 5.6; 95% CI, 1.2 to 26.0; p < 0.05), and hypophosphatemia (OR 7.7; 95% CI, 1.9 to 27.0; p < 0.01) were associated with BI. Scoliosis was associated with both CM1 (OR 4.8, 95% CI, 1.1 to 22.8; p < 0.05) and BI (OR = infinity; 95% CI, 4.7 to infinity; p < 0.01). Bisphospho nate treatment status had no association with BI or CM1. Higher skeletal burden scores unit (sbsu) were observed in the CM1 (52.8; 19.9–75) and BI (60.8; 2.6–75) groups compared to the No CM1 (27.6; 0.46–75) and No BI (27.6; 0.46–75) groups, respectively (p < 0.01). Multivariable analyses indicated that clinical associations in CM1 and BI were dependent on skeletal disease burden (p > 0.05).
CT scans and imaging reports from subjects diagnosed with CM1 and/or BI (n = 19) were screened for evidence of disease sequelae, and other craniovertebral pathology. In addition to craniofacial FD, other cranial abnormalities were observed in seven subjects (36.8%). Four subjects (21.1%) had evidence of mass effect, indicated by compression or midline shift (Fig. 3H). Evidence of aneurysmal bone cysts and arachnoid cysts were each seen in two subjects (10.5%) (Fig. 3E). All subjects exhibited other spinal abnormalities. Eighteen subjects (94.7%) had cervical spine FD, and 17 (89.4%) had scoliosis. Two subjects (10.5%) had spinal stenosis, and three subjects (15.8%) had vertebral fractures. One subject had syringomyelia (Fig. 3E).
Discussion
Findings from this large series demonstrate that patients with craniofacial FD have an increased prevalence of cranial base abnormalities. CM1 and BI occurred in 6.3% and 7.6% of subjects, respectively, which is much greater than in the general population,(31) and similar in prevalence to that seen in other metabolic bone disorders, such as osteogenesis imperfecta.(11,14,32) Given the rare but potentially devastating neurologic dysfunction associated with these abnormalities, findings from this study support routine screening for cranial base abnormalities in patients with craniofacial FD, as well as aggressive management of contributory risk factors.
Multiple causal mechanisms have been attributed to CM1 development. Craniomorphometric findings suggest that cranial constriction (evidenced by decreased foramen magnum length and PCFV) and cranial settling (evidenced by increased Boogaard angle and elevated odontoid position) are the primary mechanisms for the development of CM1 in FD/MAS (Fig. 4). This aligns with the natural history of deformities in FD, which typically arise from a combination of bone expansion and weakness.
Fig. 4.

Potential mechanisms of Chiari I malformation in craniofacial FD. Dashed lines outline the normal position of cranial base and vertebral bones. (1) Cranial settling, including basilar invagination and platybasia, resulting from bone weakness under weight-bearing forces. (2) Cranial constriction, resulting from expansion of FD lesions. (3) Intracranial hypertension, secondary to mass lesions, such as aneurysmal bone cysts. FD = fibrous dysplasia.
Few cases of CM1 have been reported in FD/MAS, all of which occurred in the setting of progressive occipital FD expansion, indicating craniocerebral disproportion as a potential mechanism.(7,9,10) Cranial constriction is a form of craniocerebral disproportion, in which the intracranial capacity is insufficient for the cerebral contents. Decreased PCFV and foramen magnum length have been reported in CM1 associated with craniosynostosis, achondroplasia, Paget’s disease, acromegaly, and rickets.(17,33) Based on these findings, cranial vault malformations and bony overgrowth diseases have been classified as conditions of cranial constriction. Likewise, we have demonstrated decreased PCFV and foramen magnum length in patients with craniofacial FD and CM1, suggesting that FD expansion compromises the posterior cranial fossa space leading to tonsillar herniation in severe cases. Intracranial hypertension, another form of craniocerebral disproportion, may also cause CM1 in FD. Intracranial hypertension describes the mechanism of tonsillar displacement resulting from ectopic intracranial masses that increase pressure within a normal cranial vault.(34) Two cases of CM1 have been reported in the setting of intracranial hypertension secondary to rapidly enlarging aneurysmal bone cysts in FD.(7,10) Similarly, several subjects in this study with CM1 had evidence of aneurysmal bone cysts and arachnoid cysts on radiographic evaluation. In addition, evidence of increased cranial pressure, including papilledema on physical exam and midline shift on imaging, was detected in the CM1 group. Furthermore, in CM1 intracranial hypertension may be exacerbated by cerebral spinal fluid obstruction at the foramen magnum, which impairs venous drainage resulting in cerebral spinal fluid accumulation manifesting as hydrocephalus or syringomyelia. Although evidence of venous sinus compression was not directly observed on imaging, one subject had symptomatic syringomyelia that ultimately required surgical intervention.
Cranial settling, which generally refers to abnormal caudal displacement of cranial base toward the cervical spine,(17,35) is another possible mechanism of CM1 development in craniofacial FD. BI is a distinct form of cranial settling, in which the odontoid process extends into the foramen magnum or displaces the clivus rostrally. Secondary BI has been reported in conditions of soft bone, such as Paget’s disease, osteomalacia, and osteogenesis imperfecta, in which the cranial base deforms under the cranial weight.(35) Similarly, in our cohort BI likely develops secondary to undermineralized, weak bone in the cervical spine and skull base affected by FD. CM1 commonly occurs in association with BI,(13) in which malposition of the odontoid process causes refractory downward displacement of the cerebellar tonsils with or without decreased PCFV.(13,35,36) In this study, FD/MAS subjects with CM1 demonstrated a significant increase in odontoid position relative to Chamberlain’s line, and 30% met criteria for BI, implicating cranial settling as a causal mechanism. Boogaard angle was also increased in both the CM1 and BI groups, consistent with platybasia, or skull base flattening. Boogaard angle is a measure of posterior cranial base flattening, while basal angle measures flattening of the anterior cranial base. Previous angular craniometry studies demonstrated that patients with BI have significantly wider basal and Boogaard angles than normal controls, confirming the relationship between BI and platybasia.(23,24) In our study widening of the basal angle was not observed, which is likely due to distortion of the anterior cranial base, the most common site of craniofacial FD.(6) Finally, tentorial angle was decreased in the BI group, which is likely due to infolding of the osseous margins of the foramen magnum resulting in a more convex supraocciput. This finding is consistent with platybasia and BI observed in osteogenesis imperfecta, in which infolding of the occipital condyles and foramen magnum occur secondary to microfractures.
The contribution of MAS-related endocrinopathies to the development of CM1 and BI has not been adequately elucidated. In this cohort, FGF23-mediated hypophosphatemia and hyperthyroidism were associated with BI. This is consistent with the established detrimental effects of these endocrinopathies on bone metabolism, which exacerbate the inherent weakness of FD lesions.(37,38) The association between BI and precocious puberty is potentially related to early maturation of the spheno-occipital synchondrosis, which may alter craniovertebral junction morphology. No endocrinopathies were associated with CM1 in subjects with FD/MAS. Interestingly, patients with FD of the skull base generally do not have pituitary hypofunction despite deformation of the sphenoid bone, including the sella turcica. Pituitary function was also maintained in craniofacial FD subjects with BI and/or CM1 in this study. Scoliosis was associated with both CM1 and BI. CM1 is commonly associated with scoliosis in other populations, which is thought to result from disruption of the protective, postural tonic reflexes of the spinal cord.(19,39,40) Although these effects of CM1 may contribute to scoliosis in FD/MAS, spinal deformity is largely attributed to FD involvement of the axial skeleton that easily deforms under weight-bearing forces.(41) Higher skeletal disease burden was associated with the development of CM1 and BI, and all clinical associations were dependent on skeletal burden. This likely reflects an increased burden of mutation-bearing tissue in this mosaic disease, as patients with more skeletal involvement are more likely to have severe craniofacial FD, scoliosis, and associated MAS endocrinopathies.
Longitudinal analyses indicate that CM1 and BI probably develop slowly in FD and progress over time. In typical development, cerebellar tonsil position slightly increases toward McRae’s line until early adulthood, and then decreases with advancing age lying well above McRae’s line.(42) Although we did not observe a significant change in tonsillar position with age in the craniofacial FD population, this may represent progression when compared to the normal pattern. In contrast, odontoid position changes with age in the craniofacial FD population, with the greatest rates of change during early childhood and adolescence. In typical development, studies suggest that the greatest change in odontoid position occurs before 7 years of age, coordinating with ossification and fusion of the odontoid process.(43) However, at all ages the mean odontoid position relative to Chamberlain’s line is increased in FD compared to means reported in the normal population.(27,43–46)
CM1 and BI can rarely cause serious neurologic dysfunction, requiring surgical intervention. The clinical presentations of CM1 and BI are similar, with several indistinct signs and symptoms such as headache, as well as specific ones such as dissociative sensory loss.(19,47,48) In our study, headache, visual disturbances, pain, and paresthesia were the most commonly reported symptoms. However, these symptoms are frequently seen in craniofacial FD without CM1 and/or BI.(6) In contrast, symptoms more specific to syringomyelia and brainstem compression, such as loss of pain and temperature sensation and gag reflex, are not common in craniofacial FD. Therefore, if these atypical findings are observed in FD, clinicians should have an elevated level of suspicion for CM1 and BI. If suspected, it is important to determine if the patient has CM1, BI, or both because the surgical interventions vary. Patients with isolated CM1 often show improvement with standard posterior fossa decompression. In contrast, in patients with CM1 and BI, in which there is craniovertebral junction instability, symptoms may worsen following posterior decompression without additional anterior decompression and occipital stabilization.(47)
Strengths of this study include the large number of subjects, particularly given the rarity of FD/MAS. Because the previous literature on this topic has been limited to case reports, this study provides new information regarding prevalence, natural history, and associated risk factors, and therefore has the potential to directly impact patient care. Detailed subject phenotyping and follow-up allowed for investigation of the association between cranial base abnormalities and specific clinical features. Limitations include the retrospective study design, and the heterogeneity of the study population. Subjects were seen at a tertiary referral center, which likely biased the cohort toward a more severe phenotype. This may limit the generalizability of the results; however, it also enables the identification of risk factors associated with cranial base abnormalities.
Suggested clinical application of these findings are as follows: because of the rare but potentially devastating neurologic dysfunction associated with CM1 and BI, all patients with craniofacial FD should be screened for associated symptoms at each clinical evaluation. Radiographic evaluation of cranial base dimensions, using either CT or MRI, should be performed in all patients with craniofacial FD around school age. If cranial base parameters are normal at this evaluation, further imaging for cranial base monitoring purposes is not indicated in asymptomatic patients. However, if craniofacial imaging is obtained for other purposes, assessment of cranial base parameters should be performed routinely, regardless of symptoms. All patients with FD should undergo monitoring and treatment for MAS-associated endocrinopathies. In patients with FGF23-mediated hypophosphatemia, treatment should be initiated if serum phosphorus levels fall below the normal range, regardless of symptoms. All patients should undergo monitoring and treatment for scoliosis and its associated risk factors, including leg length discrepancies and deformities of the lower extremities.
In conclusion, this study evaluated cranial base abnormalities in a large cohort of patients with FD/MAS, demonstrating an increased prevalence of both CM1 and BI. The primary mechanisms of CM1 are cranial constriction and cranial settling, likely resulting from both expansion of craniofacial lesions, and weakness of the skull base under weight-bearing forces. Potentially treatable factors that may contribute to disease development include FGF23-mediated hypophosphatemia, hyperthyroidism, precocious puberty, and scoliosis.
Supplementary Material
Acknowledgments
This research was funded in part by the Intramural Research Program of the NIDCR. This research was also made possible through the NIH Medical Research Scholars Program, a public-private partnership supported jointly by the NIH and generous contributions to the Foundation for the NIH from the Doris Duke Charitable Foundation, the American Association for Dental Research, the Colgate-Palmolive Company, Genentech, Elsevier, and other private donors. We thank Jessica Mack for assistance with craniomorphometric measurements, Adom Whitaker for assistance with data collection, and Andrea Beri for assistance with obtaining control studies.
Authors’ roles: Study design: KSP and JDH. Study conduct: KSP. Data collection: KSP and SMB. Data analysis: KSP. Data interpretation: KSP, AMB, and MTC. Drafting manuscript: KSP. Revising manuscript: AMB, MTC, and JDH. Approving final manuscript: AMB, MTC, JDH, and KSP. AMB takes responsibility for the integrity of the data analysis.
Footnotes
Additional Supporting Information may be found in the online version of this article.
Disclosures
All authors state that they have no conflicts of interest.
References
- 1.Weinstein LS, Shenker A, Gejman PV, Merino MJ, Friedman E, Spiegel AM. Activating mutations of the stimulatory G protein in the McCune-Albright syndrome. N Engl J Med. 1991;325(24):1688–95. [DOI] [PubMed] [Google Scholar]
- 2.Robinson C, Collins MT, Boyce AM. Fibrous dysplasia/McCune-Albright syndrome: clinical and translational perspectives. Curr Osteoporos Rep. 2016;14(5):178–86. [DOI] [PMC free article] [PubMed] [Google Scholar]
- 3.Boyce AM, Collins MT. Fibrous dysplasia/McCune-Albright syndrome 2015. February 26 In: Adam MP, Ardinger HH, Pagon RA, et al. , editors. GeneReviews®[Internet]. Seattle (WA): University of Washington, Seattle; 1993–2018 [cited 2018 Jul 1]. Available from: https://www.ncbi.nlm.nih.gov/books/NBK274564/ [PubMed] [Google Scholar]
- 4.Collins MT, Singer FR, Eugster E. McCune-Albright syndrome and the extraskeletal manifestations of fibrous dysplasia. Orphanet J Rare Dis. 2012;7 Suppl 1:S4. [DOI] [PMC free article] [PubMed] [Google Scholar]
- 5.Kelly MH, Brillante B, Collins MT. Pain in fibrous dysplasia of bone: age-related changes and the anatomical distribution of skeletal lesions. Osteoporos Int. 2008;19(1):57–63. [DOI] [PubMed] [Google Scholar]
- 6.Lee JS, FitzGibbon EJ, Chen YR, et al. Clinical guidelines for the management of craniofacial fibrous dysplasia. Orphanet J Rare Dis. 2012;7 Suppl 1:S2. [DOI] [PMC free article] [PubMed] [Google Scholar]
- 7.Urgun K, Yilmaz B, Toktas ZO, et al. Craniospinal polyostotic fibrous dysplasia, aneurysmal bone cysts, and Chiari type 1 malformation coexistence in a patient with McCune-Albright syndrome. Pediatr Neurosurg. 2016;51(5):253–6. [DOI] [PubMed] [Google Scholar]
- 8.Daly BD, Chow CC, Cockram CS. Unusual manifestations of craniofacial fibrous dysplasia: clinical, endocrinological and computed tomographic features. Postgrad Med J. 1994;70(819):10–6. [DOI] [PMC free article] [PubMed] [Google Scholar]
- 9.Chandy MJ. Occipital fibrous dysplasia tonsillar herniation and cervical syringomyelia. Br J Neurosurg. 1999;13(2):217–8. [DOI] [PubMed] [Google Scholar]
- 10.Iseri PK, Efendi H, Demirci A, Komsuoglu S. Fibrous dysplasia of the cranial bones: a case report and review of the literature. Yale J Biol Med. 2005;78(3):141–5. [PMC free article] [PubMed] [Google Scholar]
- 11.Sawin PD, Menezes AH. Basilar invagination in osteogenesis imperfecta and related osteochondrodysplasias: medical and surgical management. J Neurosurg. 1997;86(6):950–60. [DOI] [PubMed] [Google Scholar]
- 12.Loukas M, Shayota BJ, Oelhafen K, et al. Associated disorders of Chiari type I malformations: a review. Neurosurg Focus. 2011;31(3):E3. [DOI] [PubMed] [Google Scholar]
- 13.Pinter NK, McVige J, Mechtler L. Basilar invagination, basilar impression, and platybasia: clinical and imaging aspects. Curr Pain Headache Rep. 2016;20(8):49. [DOI] [PubMed] [Google Scholar]
- 14.Arponen H, Makitie O, Haukka J, et al. Prevalence and natural course of craniocervical junction anomalies during growth in patients with osteogenesis imperfecta. J Bone Miner Res. 2012;27(5):1142–9. [DOI] [PubMed] [Google Scholar]
- 15.Wermers RA, Tiegs RD, Atkinson EJ, Achenbach SJ, Melton LJ 3rd. Morbidity and mortality associated with Paget’s disease of bone: a population-based study. J Bone Miner Res. 2008;23(6):819–25. [DOI] [PMC free article] [PubMed] [Google Scholar]
- 16.Albert L Jr, Hirschfeld A. Acquired Chiari malformation secondary to hyperostosis of the skull: a case report and literature review. Surg Neurol. 2009;72(2):157–61. [DOI] [PubMed] [Google Scholar]
- 17.Milhorat TH,Nishikawa M,Kula RW,Dlugacz YD.Mechanisms of cerebellar tonsil herniation in patients with Chiari malformations as guide to clinical management. Acta Neurochir (Wien). 2010;152(7):1117–27. [DOI] [PMC free article] [PubMed] [Google Scholar]
- 18.Cimino JJ, Ayres EJ. The clinical research data repository of the US National Institutes of Health. Stud Health Technol Inform. 2010;160(Pt 2):1299–303. [PMC free article] [PubMed] [Google Scholar]
- 19.Milhorat TH, Chou MW, Trinidad EM, et al. Chiari I malformation redefined: clinical and radiographic findings for 364 symptomatic patients. Neurosurgery. 1999;44(5):1005–17. [DOI] [PubMed] [Google Scholar]
- 20.Collins MT, Kushner H, Reynolds JC, et al. An instrument to measure skeletal burden and predict functional outcome in fibrous dysplasia of bone. J Bone Miner Res. 2005;20(2):219–26. [DOI] [PubMed] [Google Scholar]
- 21.Aboulezz AO, Sartor K, Geyer CA, Gado MH. Position of cerebellar tonsils in the normal population and in patients with Chiari malformation: a quantitative approach with MR imaging. J Comput Assist Tomogr. 1985;9(6):1033–6. [DOI] [PubMed] [Google Scholar]
- 22.Spinos E, Laster DW, Moody DM, Ball MR, Witcofski RL, Kelly DL Jr. MR evaluation of Chiari I malformations at 0.15 T. AJR Am J Roentgenol. 1985;144(6):1143–8. [DOI] [PubMed] [Google Scholar]
- 23.Botelho RV, Ferreira ED. Angular craniometry in craniocervical junction malformation. Neurosurg Rev. 2013;36(4):603–10; discussion 610. [DOI] [PMC free article] [PubMed] [Google Scholar]
- 24.Ferreira JA, Botelho RV. The odontoid process invagination in normal subjects, Chiari malformation and Basilar invagination patients: pathophysiologic correlations with angular craniometry. Surg Neurol Int. 2015;6:118. [DOI] [PMC free article] [PubMed] [Google Scholar]
- 25.Rosset A, Spadola L, Ratib O. OsiriX: an open-source software for navigating in multidimensional DICOM images. J Digit Imaging. 2004;17(3):205–16. [DOI] [PMC free article] [PubMed] [Google Scholar]
- 26.Elster AD, Chen MY. Chiari I malformations: clinical and radiologic reappraisal. Radiology 1992;183(2):347–53. [DOI] [PubMed] [Google Scholar]
- 27.Chamberlain WE. Basilar impression (platybasia): a bizarre developmental anomaly of the occipital bone and upper cervical spine with striking and misleading neurologic manifestations. Yale J Biol Med. 1939;11(5):487–96. [PMC free article] [PubMed] [Google Scholar]
- 28.Furtado SV, Reddy K, Hegde AS. Posterior fossa morphometry in symptomatic pediatric and adult Chiari I malformation. J Clin Neurosci. 2009;16(11):1449–54. [DOI] [PubMed] [Google Scholar]
- 29.Schaefer GB, Thompson JN Jr, Bodensteiner JB, Gingold M, Wilson M, Wilson D. Age-related changes in the relative growth of the posterior fossa. J Child Neurol. 1991;6(1):15–9. [DOI] [PubMed] [Google Scholar]
- 30.Coll G, Lemaire JJ, Di Rocco F, et al. Human foramen magnum area and posterior cranial fossa volume growth in relation to cranial base synchondrosis closure in the course of child development. Neurosurgery. 2016;79(5):722–35. [DOI] [PubMed] [Google Scholar]
- 31.Speer MC, Enterline DS, Mehltretter L, et al. Review article: Chiari type I malformation with or without syringomyelia: prevalence and genetics. J Genet Couns. 2003;12(4):297–311. [DOI] [PubMed] [Google Scholar]
- 32.Janus GJ, Engelbert RH, Beek E, Gooskens RH, Pruijs JE. Osteogenesis imperfecta in childhood: MR imaging of basilar impression. Eur J Radiol. 2003;47(1):19–24. [DOI] [PubMed] [Google Scholar]
- 33.Tubbs RS, Webb D, Abdullatif H, Conklin M, Doyle S, Oakes WJ. Posterior cranial fossa volume in patients with rickets: insights into the increased occurrence of Chiari I malformation in metabolic bone disease. Neurosurgery. 2004;55(2):380–3; discussion 383–4. [DOI] [PubMed] [Google Scholar]
- 34.Wang J, Alotaibi NM, Samuel N, Ibrahim GM, Fallah A, Cusimano MD. Acquired Chiari malformation and syringomyelia secondary to space-occupying lesions: a systematic review. World Neurosurg. 2017. February;98:800–8. e2. [DOI] [PubMed] [Google Scholar]
- 35.Milhorat TH, Bolognese PA, Nishikawa M, McDonnell NB, Franco-mano CA. Syndrome of occipitoatlantoaxial hypermobility, cranial settling, and Chiari malformation type I in patients with hereditary disorders of connective tissue. J Neurosurg Spine. 2007;7(6):601–9. [DOI] [PubMed] [Google Scholar]
- 36.Nishikawa M, Sakamoto H, Hakuba A, Nakanishi N, Inoue Y. Pathogenesis of Chiari malformation: a morphometric study of the posterior cranial fossa. J Neurosurg. 1997;86(1):40–7. [DOI] [PubMed] [Google Scholar]
- 37.Blum MR, Bauer DC, Collet TH, et al. Subclinical thyroid dysfunction and fracture risk: a meta-analysis. JAMA. 2015;313(20):2055–65. [DOI] [PMC free article] [PubMed] [Google Scholar]
- 38.Tuchendler D, Bolanowski M. The influence of thyroid dysfunction on bone metabolism. Thyroid Res. 2014;7(1):12. [DOI] [PMC free article] [PubMed] [Google Scholar]
- 39.Kelly MP, Guillaume TJ, Lenke LG. Spinal deformity associated with Chiari malformation. Neurosurg Clin N Am. 2015;26(4):579–85. [DOI] [PMC free article] [PubMed] [Google Scholar]
- 40.Eule JM, Erickson MA, O’Brien MF, Handler M. Chiari I malformation associated with syringomyelia and scoliosis: a twenty-year review of surgical and nonsurgical treatment in a pediatric population. Spine. 2002;27(13):1451–5. [DOI] [PubMed] [Google Scholar]
- 41.Berglund JA, Tella SH, Tuthill KF, et al. Scoliosis in fibrous dysplasia/McCune-Albright syndrome: factors associated with curve progression and effects of bisphosphonates. J Bone Miner Res. Forthcoming. Epub 2018 Apr 18 DOI: 10.1002/jbmr.3446. [DOI] [PubMed] [Google Scholar]
- 42.Smith BW, Strahle J, Bapuraj JR, Muraszko KM, Garton HJ, Maher CO. Distribution of cerebellar tonsil position: implications for understanding Chiari malformation. J Neurosurg. 2013;119(3):812–9. [DOI] [PubMed] [Google Scholar]
- 43.Arponen H, Evalahti M, Waltimo-Siren J. Dimensions of the craniocervical junction in longitudinal analysis of normal growth. Childs Nerv Syst. 2010;26(6):763–9. [DOI] [PubMed] [Google Scholar]
- 44.Cronin CG, Lohan DG, Mhuircheartigh JN, Meehan CP, Murphy J, Roche C. CT evaluation of Chamberlain’s, McGregor’s, and McRae’s skull-base lines. Clin Radiol. 2009;64(1):64–9. [DOI] [PubMed] [Google Scholar]
- 45.Cronin CG, Lohan DG, Mhuircheartigh JN, Meehan CP, Murphy JM, Roche C. MRI evaluation and measurement of the normal odontoid peg position. Clin Radiol. 2007;62(9):897–903. [DOI] [PubMed] [Google Scholar]
- 46.Kovero O, Pynnonen S, Kuurila-Svahn K, Kaitila I, Waltimo-Siren J. Skull base abnormalities in osteogenesis imperfecta: a cephalometric evaluation of 54 patients and 108 control volunteers. J Neurosurg. 2006;105(3):361–70. [DOI] [PubMed] [Google Scholar]
- 47.Goldstein HE, Anderson RC. Craniovertebral junction instability in the setting ofChiari I malformation. Neurosurg Clin N Am. 2015;26(4):561–9. [DOI] [PubMed] [Google Scholar]
- 48.Fenoy AJ, Menezes AH, Fenoy KA. Craniocervical junction fusions in patients withhindbrain herniationand syringohydromyelia.J Neurosurg Spine. 2008;9(1):1–9. [DOI] [PubMed] [Google Scholar]
Associated Data
This section collects any data citations, data availability statements, or supplementary materials included in this article.