

Abstract
The Youth Risk Behavior Survey is administered biennially in odd years to public middle and high school students in Hawai‘i. Data highlights are presented from Hawaii's 2017 high school survey results to enhance understanding of the relationship between health and academic achievement. This article reviews a select set of health-risk behaviors and their association with academic grades for Hawai‘i public school students. The findings demonstrate that students who self-reported engaging in health protective behaviors also reported higher academic grades in school, while those who engaged in health-risk behaviors were more likely to report lower grades in school. This discussion can provide useful background information and benchmarks for research, policy, and local initiatives. It also supports the need for continued collaboration and a synergistic approach between education and health partners in Hawai‘i in order to improve the health and academic achievement of our youth.
Background on Educational Attainment and Health Behavior in Hawai‘i
Research over the past 25 years has demonstrated a robust, multifaceted connection between academic achievement and health-related behaviors.1–7 Physical activity programs in schools can improve cognitive skills, including concentration, attention, and behavior.5,8 Nutrient deficiencies and hunger are associated with lower grades, diminished concentration among students, and higher rates of absenteeism.5,9–11 A wide range of health behaviors are significantly associated with academic achievement, including substance use, sexual health, and violence-related risk behaviors.1,5,12–16
Importantly, associations between education and health exist in both directions: student health behavior impacts academic performance and academic performance impacts health behaviors.1,9,17 The school environment thus provides an opportunity to meet two critical goals: positively influencing the health of students and improving their academic achievement.
The Hawai‘i Department of Education (HDOE) acknowledges the importance of both health and education in their vision: “Hawaii's students are educated, healthy and joyful lifelong learners who contribute positively to our community and global society.”18 The HDOE also “recognizes that when students' wellness needs are met, they attain higher achievement levels.”19
The Hawai‘i Department of Health (HDOH) similarly acknowledges the links between education and health. As HDOH's former Health Director, Dr. Virginia Pressler noted: “Part of providing a well-rounded education includes health and physical education classes, as well as educational activities about nutrition and healthy eating.”20 To support this effort, HDOH launched the Healthy Hawai‘i Initiative (HHI) in 2000 to strengthen health policies and programs in Hawaii's communities, schools, and workplaces.21,22
Together, HDOE and HDOH have worked in partnership to facilitate the implementation of HDOE Wellness Guidelines, which address the United States Department of Agriculture (USDA) requirements for a local wellness policy and support healthy eating and physical activity in schools. Since 2011, all public non-charter schools have been required to meet the HDOE Wellness Guidelines. Also, for the past 15 years, the HDOH HHI has provided funds to the HDOE to support the implementation of wellness policy, health education, and physical education. These funds have been used to hire state and district-level personnel to provide instructional resources, professional development, and technical assistance to all 256 HDOE public schools.
Current statewide data demonstrating the relationship between educational performance and health behavior could be useful to inform cross-sector partnerships and help target resources where the needs are greatest. Yet there is limited current, statewide research on the connections between academic achievement and health behaviors in Hawai‘i. While a large amount of literature shows the relationship between health behavior and academic performance, much of this research took place years ago and/or in specific geographic regions or states that may not be applicable to students in Hawai‘i.1,15
This paper describes a useful data source for the goal of providing current, actionable information around student health behaviors and academic performance: the Hawai‘i Youth Risk Behavior Survey (YRBS). Highlights are provided from recent YRBS findings on the relationship between health behaviors and academic grades in Hawai‘i. Having a greater understanding of the relationship between education and health can facilitate partnerships, resources, and initiatives in Hawai‘i, and ultimately help students become healthier and more successful learners. These data may also provide useful background information and benchmarks for programs, research, and policy.
Specifically, this article highlights key findings and conclusions around a subset of health indicators of interest from the 2017 Hawai‘i YRBS. It was hypothesized that students in Hawai‘i who self-report engaging in positive health behaviors would also report higher grades in school, while those who report engaging in health-related risk behaviors would be more likely to report lower grades in school.
Youth Risk Behavior Survey
The Centers for Disease Control and Prevention (CDC) developed the Youth Risk Behavior Surveillance System to monitor six health-related categories associated with the greatest morbidity and mortality among both youth and adults in the United States: injury and violence; sexual risk behaviors; alcohol and other drug use; tobacco use; nutrition; and physical activity. To produce national-level estimates on these key outcomes, the YRBS is administered biennially by the CDC as a self-reported survey to high school students across the United States (US).
In 2017, the CDC assisted 46 states and 21 large urban school districts in administering their own survey to produce local and county-level estimates.23 States are required to use a subset of the “core” questionnaire but are allowed to include additional questions of local interest. These features allow states to longitudinally benchmark and compare their progress across several health areas and an even greater number of indicators.
In Hawai‘i, the YRBS is a joint effort between the Departments of Health and Education, and the University of Hawai‘i Curriculum Research & Development Group. The Hawai‘i YRBS uses a two-stage cluster design to produce representative weighted estimates for both public high school and middle school students in odd-numbered years. The Hawai‘i YRBS has an opt-out consent process, which means that information about the survey is distributed to students and their families prior to administration so that parents and legal guardians are afforded the opportunity to exclude their children from participating. For further information, detailed methodology of the YRBS has been previously published24,25 and Hawai‘i's YRBS results are available for the public to view through the Hawai‘i Health Data Warehouse.26 The 2017 Hawai‘i YRBS high school survey had a sample size of 6,031 students and an overall response rate of 77%.
Risk Behaviors and Academic Achievement Report
In 2017, Rasberry, et al, published a study in the Morbidity and Mortality Weekly Report (MMWR) using the national YRBS 2015 data to examine the association between health-related behaviors and academic achievement among high school students in the US.15 Soon after, the CDC released data tables for states to download for YRBS 2017 as a report.27 This report analyzed and tabulated YRBS health behavior indicators by academic grades for each state. The grade question is worded as follows: During the past 12 months, how would you describe your grades in school? Students were allowed to choose “Mostly A's,” “Mostly B's,” “Mostly C's,” “Mostly D's,” “Mostly F's,” “None of these grades,” or “Not sure.” For the analysis, students who reported mostly D's or mostly F's were combined into a single category, while the other grades were reported separately. Students who reported “None of these grades” or “Not sure” were excluded from all analyses. The data tables for each state reported the weighted prevalence estimates and 95% confidence intervals. Significance was set at P < .05 and was determined based on further logistic regression modeling controlling for the potentially confounding effects of sex, race/ethnicity, and grade level (ie, 9th, 10th, 11th, and 12th).
The 2017 YRBS high school questionnaire contained 99 questions.27 The CDC's extensive data tables in the Hawai‘i report on each of these questions were informative, but difficult to synthesize for programmatic, research, or policy work as the lengthy document did not provide any discussion of findings or context that would allow for a cumulative analysis of the findings. 27
In this paper, we chose to examine in detail 29 health indicators that covered six main health topics using the data reported in CDC, 2017.27 The selected indicators to highlight were based on those chosen for the 2017 Rasberry, et al. MMWR study15 and were confirmed by Hawai‘i health and education partners as areas of interest. To aid in the interpretation of the data, the prevalence estimates were organized into bar graphs according to six main topic areas.
Dietary Behaviors and Food Security
Included dietary indicators were: eating breakfast on all seven days (during the seven days before taking the survey); eating vegetables three or more times per day (including green salad, potatoes, carrots, and other vegetables, during the seven days before the survey); not drinking a can, bottle, or glass of soda or pop (during the seven days before the survey); and eating fruit or drinking 100% fruit juices three or more times per day (during the seven days before the survey). Additionally, food security was operationalized as reporting “most of the time” or “always” going hungry because there was not enough food in their home (during the 30 days before the survey).
Physical Activity and Sedentary Behaviors
The Hawai‘i YRBS includes several measures related to physical activity and sedentary behavior. Physical activity indicators selected for this paper include: being physically active for at least 60 minutes per day (on five or more days during the seven days before the survey) and playing on at least one sports team (during the 12 months before the survey). The sedentary behaviors chosen include watching television for three or more hours per day (on an average school day) and playing video or computer games or using a computer three or more hours per day for something that was not school work (on an average school day).
Bullying, Violence, and Suicide Ideation
The Hawai‘i YRBS contains multiple indicators around bullying, violence, and suicide ideation. We included five indicators. One indicator relates to electronic bullying, which includes being bullied through texting and social media (during the 12 months before the survey). Additionally, two suicide indicators include making a plan about how they would attempt suicide (during the 12 months before the survey) and attempting suicide one or more times (during the 12 months before the survey.) School safety was ascertained by students reporting they did not go to school because they felt unsafe at school or on their way to school (on at least one day during the 30 days before the survey). Finally, a violence indicator of interest includes being in a physical fight one or more times (during the 12 months before the survey).
Sexual Risk Behaviors and Sexual Violence
The two sexual risk behaviors chosen for further review include currently sexually active (defined as having sexual intercourse during the three months before the survey) and not using any method to prevent pregnancy during last sexual intercourse (among youth who are currently sexually active). In addition, one indicator around sexual violence includes anyone forcing them to do sexual things that they did not want to do (during the 12 months before the survey). Finally, HIV/AIDS education was ascertained by reporting ever being taught about AIDS or HIV infection in school.
Substance Use Behaviors
The Hawai‘i YRBS has a large section of questions devoted to substance use including alcohol, tobacco, prescription drugs, and illicit drug use. Indicators selected for inclusion were currently drinking alcohol, using electronic vaping products, and smoking cigarettes (on at least one day during the 30 days before the survey); current marijuana use (one or more time during the 30 days before the survey); ever prescription pain drug use, including Vicodin, OxyContin, Hydrocodone, and Percocet; and ever methamphetamine use (one or more times in their life).
Other Health Behaviors
Many other health behaviors are measured in the Hawai‘i YRBS including access to health care, general health, and protective factors that are not included in the national YRBS survey. We included the following: not going to school because they were sick (on one or more days during the 30 days before the survey); sleeping eight or more hours per night (on an average school night); seeing a dentist for a check-up, exam, teeth cleaning, or other dental work (during the 12 months before the survey); seeing a doctor or nurse for a check-up or physical exam when they were not sick or injured (during the 12 months before the survey); and having at least one teacher or other adult in school they can talk to if they have a problem.
Data Highlights
The highlighted 2017 YRBS results for Hawai‘i public high school students are displayed in Figures 1–6. The bar graphs have been shaded from a dark gradient (mostly A's) to a light gradient (mostly D/F's) to illustrate the association between academic grades in school and health indicators. Protective health behaviors are indicated in bold font, while health-risk behaviors remain in regular font. The majority of health behaviors (25 of the 29) were statistically significant when compared with academic achievement results. (Decimals of 0.5 and higher were rounded up to the nearest whole number in the bar graphs.)
Figure 1.

Percentage of Hawai‘i Public High School Students Self-reporting Dietary Behaviors and Food Security
* Based on logistic regression analysis controlling for sex, race/ethnicity, and grade in school as reported in CDC, 201727, P < .05
∧ Decimals of 0.5 and higher were rounded up to the nearest whole number
Brkfst7Days: Ate breakfast on all 7 days during the 7 days before the survey
NoSoda: Did not drink a can, bottle, or glass or soda or pop during the 7 days before the survey
Veg3+: Ate vegetables three or more times per day during the 7 days before the survey
Fruit/Juice3+: Ate fruit or drank 100% fruit juices three or more times per day during the 7 days before the survey
Hungry: Most of the time or always went hungry because there was not enough food in their home during the 30 days before the survey
Figure 6.

Percentage of Hawai‘i Public High School Students Self-reporting Other Health Behaviors
* Based on logistic regression analysis controlling for sex, race/ethnicity, and grade in school as reported in CDC, 201727, P < .05
∧ Decimals of 0.5 and higher were rounded up to the nearest whole number
SickNoSchl: Did not go to school because they were sick on one or more days during 30 days before the survey
Sleep8+Hrs: Sleep 8 or more hours per night on an average school night
SawADentist: Saw a dentist during the 12 months before survey
Checkup: Saw a doctor or nurse for check-up or physical exam when not sick during the 12 months before survey
SchlAdult: Students who had at least one teacher or other adult in school they can talk to if they have a problem
Dietary Behaviors and Food Security
Students that reported mostly A's and mostly B's had a higher prevalence of eating breakfast on all seven days and not drinking soda in the past week (Figure 1). For example, 43% of students with mostly A's ate breakfast on all seven days. This means that 57% of students with mostly A's did not eat breakfast on all seven days. This compares to 22% of students with mostly D/F's who ate breakfast on all seven days, thus 78% of students with mostly D/F's did not eat breakfast on all seven days before the survey. Higher achieving students also reported a lower prevalence of hunger during the 30 days before the survey. It should be noted that regardless of the academic grade achieved, more than 50% of students in each letter grade category reported not eating breakfast on all seven days.
Students who earned mostly D/F's had a higher prevalence of having at least three or more vegetables and three or more fruits/juices per day. At the same time, this group also had the highest prevalence of going hungry all or most of the time because there was no food in their home.
Although no statistical association was found between having fruit or fruit juices three or more times per day and students' grades, the remaining four dietary variables in Figure 1 all showed a significant relationship with academic grades in school.
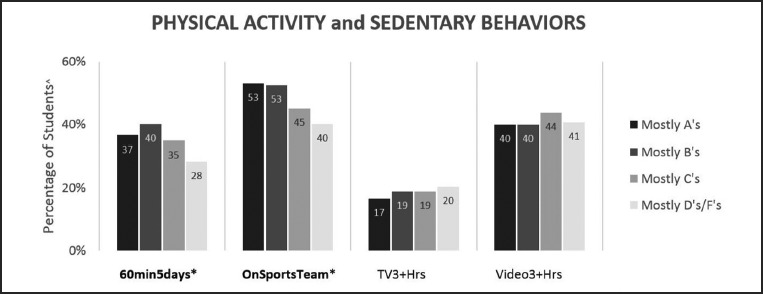
Physical Activity and Sedentary Behaviors
Students who reported mostly A's and mostly B's received more physical activity than those who reported mostly C's and mostly D/F's. Academic grades were significantly associated with being on a sports team during the last year and being physically active for at least 60 minutes per day on five or more days in the last seven days (Figure 2). Grades were not statistically associated with watching television or playing video/computer games or using a computer for three or more hours per day. Noticeably, approximately 40% of all students played video/computer games or used a computer for at least three hours per day and approximately 20% of students watched three or more hours of television regardless of their grades.
Figure 2.
Percentage of Hawai‘i Public High School Students Self-reporting Physical Activity and Sedentary Behaviors
* Based on logistic regression analysis controlling for sex, race/ethnicity, and grade in school as reported in CDC, 201727, P < .05
∧ Decimals of 0.5 and higher were rounded up to the nearest whole number
60mins5days: Physically active at least 60 minutes per day on 5 or more days during the 7 days before the survey
OnSportsTeam: Played on at least one sports team during the 12 months before the survey
TV3+Hrs: Watched television 3 or more hours per day on an average school day
Video3+Hrs: Played video or computer games or used a computer 3 or more hours per day for something that was not school work on an average school day
Bullying, Violence, and Suicide Ideation
Academic grades were significantly associated with all five of the bullying, violence, or suicide-related behaviors (Figure 3). A common pattern emerged that students who reported mostly D/F's exhibited the highest prevalence for each health-risk behavior. The gradient followed accordingly that those who reported mostly C's were the second highest group to self-report these risk behaviors. For example, being in a physical fight was highest among students who received mostly D/F's at 34%, and this decreased to 25% for students with mostly C's, followed by 15% for students with mostly B's, and 10% of students with mostly A's.
Figure 3.

Percentage of Hawai‘i Public High School Students Self-reporting Bullying, Violence, and Suicide Ideation
* Based on logistic regression analysis controlling for sex, race/ethnicity, and grade in school as reported in CDC, 201727, P < .05
∧ Decimals of 0.5 and higher were rounded up to the nearest whole number
E-bully: Ever were electronically bullied during the 12 months before the survey
SchlSafety: Did not go to school because felt unsafe at school or on their way to or from school on at least 1 day during the 30 days before the survey
SuicidePlan: Made a plan about how they would attempt suicide during the 12 months before the survey
SuicideAttempt: Attempted suicide one or more times during the 12 months before the survey
Fight: In a physical fight one or more times during the 12 months before the survey
Sexual Risk Behaviors and Sexual Violence
Academic grades were significantly associated with being currently sexually active, experiencing sexual violence, and being taught about AIDS or HIV in school (Figure 4). Not using any method to prevent pregnancy during the last sexual intercourse had no significant association with educational outcomes, although the prevalence did increase as academic grades declined.
Figure 4.

Percentage of Hawai‘i Public High School Students Self-reporting Sexual Risk Behaviors and Sexual Violence
* Based on logistic regression analysis controlling for sex, race/ethnicity, and grade in school as reported in CDC, 201727, P < .05
∧ Decimals of 0.5 and higher were rounded up to the nearest whole number
SexuallyActive: Currently sexually active during the 3 months before the survey
SexualViolence: Experienced sexual violence one or more times during the 12 months before the survey
NoBirthControl: Did not use any method to prevent pregnancy during last sexual intercourse
AIDSAware: Students who have ever been taught about AIDS or HIV infection in school
Students who reported receiving mostly D/F's were more likely to be involved in the health-risk behaviors of being sexually active, experiencing sexual violence in dating, and not using any birth control method compared to those earning A's or B's.
Substance Use Behaviors
Academic grades were significantly associated with all six substance use behaviors (Figure 5). Students earning mostly C's and mostly D/F's reported higher prevalence estimates than those with mostly A's and mostly B's. For example, 16% of students with mostly A's reported currently e-vaping, while 43% of students with mostly D/F's engaged in current e-vaping in the last 30 days. Current use of cigarettes was lower compared to current e-vaping and ever taking drugs without a prescription, while current use of marijuana and alcohol were higher than current use of cigarettes.
Figure 5.

Percentage of Hawai‘i Public High School Students Self-reporting Substance Use Behaviors
* Based on logistic regression analysis controlling for sex, race/ethnicity, and grade in school as reported in CDC, 201727, P < .05
∧ Decimals of 0.5 and higher were rounded up to the nearest whole number
Alcohol: Currently drank alcohol on at least 1 day during the 30 days before the survey
Marijuana: Currently used marijuana one or more times during the 30 days before the survey
Meth: Ever used methamphetamines one or more times during their life
Cigarettes: Smoked cigarettes on at least 1 day during the 30 days before the survey
E-vaping: Currently use electronic vaping products on at least 1 day during the 30 days before the survey
DrugNoPres: Ever took prescription drugs without a doctor's prescription one or more times during their life
Other Health Behaviors
The last health topic comprises a variety of health behaviors. Academic grades were significantly associated with all five variables (Figure 6). When asked if they missed school because they were sick on one or more days during the last month, prevalence estimates were higher among students who received mostly D/F's and mostly C's, but lower on all protective health behaviors including seeing a dentist, having a check-up or physical exam, having a teacher or adult they can talk to if they have a problem, and getting at least eight hours of sleep. Regardless of academic grades, the majority of students reported not getting enough sleep with 25% or fewer students receiving eight or more hours of sleep each day in all four of the grade categories.
Discussion
These data highlights from the larger CDC report27 demonstrate clearly that students in Hawai‘i who achieved mostly A's and B's were more likely to report engaging in health protective behaviors compared to students with C's and D/F's. In a similar manner, students with mostly C's and D/F's were more likely to engage in health-risk behaviors than students who earned mostly A's and B's. Table 1 shows the key findings.
Table 1.
Summary of Select YRBS Results for Public High School Students in Hawai‘i
| In Hawai‘i, when compared to students with lower grades, students with higher grades are… | |
More likely to:
|
Less likely to:
|
These findings support the expected relationship between health protective behaviors and academic achievement in the state of Hawai‘i and coincide with previous national findings.27 While the general trends are similar for the US and Hawai‘i, some differences are noted. For example, the likelihood of using meth and e-vaping products among Hawai‘i students in 2017 was higher than the national average; however, the trend of current alcohol usage was lower for Hawai‘i students.26,28 Similarly, the likelihood of being concerned about school safety and attempted suicide was higher among Hawai‘i high school students in 2017 compared to the US, but the trend for being involved in physical fights was lower for Hawai‘i students.26,28 Hawai‘i students were also less likely to be sexually active than their average US counterparts, but they experienced more sexual violence.28
In Hawai‘i, there are several health behaviors that warrant additional attention and resources irrespective of academic grade achievement or significant associations. These include high levels of sedentary behavior, high e-vaping use, not eating breakfast daily, and not getting enough sleep for all students. Other high-risk health behaviors in Hawai‘i that should be of immediate concern include the proportion of students who reported going hungry, ever taking meth, and having made a suicide plan or attempted suicide.
Limitations
There are several limitations to keep in mind when interpreting these findings. Hawai‘i YRBS data are based on self-report, and behaviors could be under- or over-reported, especially if they are stigmatized ones. However, YRBS questions have demonstrated good test-retest reliability.24,25 YRBS data are also cross-sectional, and thus causation cannot be determined alone from this analysis, only an association between variables. Some students in Hawai‘i do not participate in the survey as the Hawai‘i YRBS is only administered to public schools, and 15.6% of students in Hawai‘i attended private schools in 2013.29 Additionally, most students who were absent on the day the survey was administered were not included in the results and thus students with poorer health and lower grades may be excluded. Hawai‘i public schools had a chronic absenteeism rate of 15% and a four-year high school dropout rate of 14.4% in the 2016–2017 school year.30,31 Also, these highlights are drawn from analyses and data in a previous report;27 we did not conduct the analyses ourselves. Despite these limitations, these data highlights should contribute to a deeper understanding about the relationship between academic achievement and health for students in Hawai‘i.
Conclusion
This study provides specific evidence and a consistent pattern of the association between health behaviors and academic achievement among public high school students in Hawai‘i and highlights key relationships seen in detailed YRBS data. The findings help support the need for public health and education agencies and professionals to strengthen their collaboration to achieve improved health and education outcomes for youth. Promoting healthy lifestyles and encouraging academic achievement do not need to be viewed as separate, competing concepts, but as synergistic and complementary ways for school health stakeholders, parents, and communities to support the development, health, and education of our youth.17,32
These data can also be used to help identify priority areas for health education curricula and for professional development for teachers and staff. In addition, these data can be used to support legislation and policies that promote health and/or education. These highlights may also be useful for those seeking funds or grant opportunities to support new school health initiatives. If there is interest, this study could be expanded in the future by conducting new analyses to assess additional dimensions of the health indicators including geographic region (ie, county), sexual identity, and race/ethnicity.
Contributor Information
Tetine L Sentell, Office of Public Health Studies at the University of Hawai‘i at Manoa.
Donald Hayes, Hawai‘i Department of Health.
Lance K Ching, Hawai‘i Department of Health.
Susan Saka, University of Hawai‘i at Manoa College of Education Curriculum Research & Development Group, is a contributing editor on this month's column.
References
- 1.Bradley BJ, Greene AC. Do health and education agencies in the United States share responsibility for academic achievement and health? A review of 25 years of evidence about the relationship of adolescents' academic achievement and health behaviors. Journal of Adolescent Health. 2013;52(5):523–532. doi: 10.1016/j.jadohealth.2013.01.008. [DOI] [PubMed] [Google Scholar]
- 2.Busch V, Loyen A, Lodder M, Schrijvers AJP, van Yperen TA, de Leeuw JRJ. The effects of adolescent health-related behavior on academic performance: a systematic review of the longitudinal evidence. Review of Educational Research. 2014;84:245–274. [Google Scholar]
- 3.Carlson JA, Sallis JF, Norman GJ, et al. Elementary school practices and children's objectively measured physical activity during school. Preventive Medicine. 2013;57(5):591–595. doi: 10.1016/j.ypmed.2013.08.003. [DOI] [PMC free article] [PubMed] [Google Scholar]
- 4.Castelli DM, Centeio EE, Hwang J, et al. VII. The history of physical activity and academic performance research: informing the future. Monographs of the Society for Research in Child Development. 2014;79(4):119–148. doi: 10.1111/mono.12133. [DOI] [PubMed] [Google Scholar]
- 5.Centers for Disease Control and Prevention (CDC), author The association between school-based physical activity, including physical education, and academic performance. Atlanta, GA: U.S. Department of Health and Human Services; 2010. [July 19, 2018]. pp. 1–84. https://www.cdc.gov/healthyyouth/health_and_academics/pdf/pa-pe_paper.pdf. Published April 2010. Updated July 2010. [Google Scholar]
- 6.Kohl H III, Cook H, editors. Educating the Student Body: Taking Physical Activity and Physical Education to School. Washington, DC: National Academy of Sciences; 2013. [August 5, 2018]. https://www.nap.edu/catalog/18314/educating-the-student-body-taking-physical-activity-and-physical-education. [PubMed] [Google Scholar]
- 7.Rasberry CN, Lee SM, Robin L, et al. The association between school-based physical activity, including physical education, and academic performance: a systematic review of the literature. Preventive Medicine. 2011;52(Suppl 1):S10–S20. doi: 10.1016/j.ypmed.2011.01.027. [DOI] [PubMed] [Google Scholar]
- 8.Leadership for Healthy Communities, author. Making the Connection: Linking Academic Achievement to Policies to Promote Physical Activity Brief. Princeton, NJ: Leadership for Healthy Communities, a National Program of the Robert Wood Johnson Foundation; 2011. [August 3, 2018]. https://activelivingresearch.org/making-connection-linking-academic-achievement-policies-promote-physical-activity. [Google Scholar]
- 9.Basch CE. Healthier students are better learners: a missing link in school reforms to close the achievement gap. Journal of School Health. 2011;81(10):593–598. doi: 10.1111/j.1746-1561.2011.00632.x. [DOI] [PubMed] [Google Scholar]
- 10.Taras H. Nutrition and student performance at school. Journal of School Health. 2005;75(6):199–213. doi: 10.1111/j.1746-1561.2005.00025.x. [DOI] [PubMed] [Google Scholar]
- 11.Kleinman RE, Hall S, Green H, et al. Diet, breakfast, and academic performance in children. Annals of Nutrition & Metabolism. 2002;46(1) Suppl 1:24–30. doi: 10.1159/000066399. [DOI] [PMC free article] [PubMed] [Google Scholar]
- 12.Carlson SA, Fulton JE, Lee SM, et al. Physical education and academic achievement in elementary school: Data from early childhood longitudinal study. American Journal of Public Health. 2008;98(4):721–727. doi: 10.2105/AJPH.2007.117176. [DOI] [PMC free article] [PubMed] [Google Scholar]
- 13.Castelli DM, Glowacki EM, Barcelona JM, Calvert HG, Hwang J. Active Education: Growing Evidence on Physical Activity and Academic Performance. San Diego, CA: Active Living Research; 2015. [August 7, 2018]. https://activelivingresearch.org/sites/default/files/ALR_Brief_ActiveEducation_Jan2015.pdf. Published January 2015. [Google Scholar]
- 14.Murray NG, Low BJ, Hollis C, Cross AW, Davis SM. Coordinated school health programs and academic achievement: a systematic review of the literature. Journal of School Health. 2007;77(9):589–600. doi: 10.1111/j.1746-1561.2007.00238.x. [DOI] [PubMed] [Google Scholar]
- 15.Rasberry CN, Tiu GF, Kann L, et al. Health-Related Behaviors and Academic Achievement Among High School Students — United States, 2015. [January 11, 2018];MMWR Morbidity and Mortality Weekly Report. 2017 66(35):921–927. doi: 10.15585/mmwr.mm6635a1. https://www.cdc.gov/mmwr/volumes/66/wr/pdfs/mm6635a1.pdf. [DOI] [PMC free article] [PubMed] [Google Scholar]
- 16.Sallis JF, McKenzie TL, Kolody B, Lewis M, Marshall S, Rosengard P. Effects of health-related physical education on academic achievement: Project SPARK. Research Quarterly for Exercise and Sport. 1999;70(2):127–134. doi: 10.1080/02701367.1999.10608030. [DOI] [PubMed] [Google Scholar]
- 17.Welk GJ, Jackson AW, Morrow JR, Haskell WH, Meredith MD, Cooper KH. The association of health-related fitness with indicators of academic performance in Texas schools. Research Quarterly for Exercise and Sport. 2010;81(3 Suppl):S16–S23. doi: 10.1080/02701367.2010.10599690. [DOI] [PubMed] [Google Scholar]
- 18.Department of Education (DOE) and Board of Education (BOE), author Hawaii State Department of Education & Board of Education, Strategic Plan 2017–2020. Honolulu, HI: State of Hawaii Department of Education; 2016. [August 5, 2018]. pp. 1–12. http://www.hawaiipublic_schools.org/DOE%20Forms/Advancing%20Education/SP2017-20.pdf. [Google Scholar]
- 19.Office of the Superintendent, author. 2017 Hawaii Department of Education Data Book, 28th Annual Report. Honolulu, HI: State of Hawaii Department of Education; 2018. [July 21, 2018]. pp. 1–25. http://www.hawaiipublicschools.org/Reports/2017HIDOEDatabook.pdf. Published June 2018. [Google Scholar]
- 20.Hawaii public schools receive financial incentives for supporting whole child and well-rounded education. Hawaii Department of Education; 2017. Nov 3, [August 24, 2018]. http://www.hawaiipublicschools.org/ConnectWithUs/MediaRoom/PressReleases/Pages/SAWS-2016-17.aspx. [Google Scholar]
- 21.Physical Activity & Nutrition — Chronic Disease Prevention & Health Promotion Division. 2018. [August 24, 2018]. http://health.hawaii.gov/physical-activity-nutrition/
- 22.Healthy Hawaii Initiative. 2018. [August 24, 2018]. https://www.healthyhawaii.com/
- 23.Kann L, McManus T, Harris WA, et al. Youth Risk Behavior Surveillance — United States, 2017. [July 21, 2018];MMWR Surveillance Summaries. 2018 67(8):1–114. doi: 10.15585/mmwr.ss6708a1. https://www.ncbi.nlm.nih.gov/pmc/articles/PMC6002027/pdf/ss6708a1.pdf. [DOI] [PMC free article] [PubMed] [Google Scholar]
- 24.Brener N, Kann L, Shanklin S, et al. Methodology of the Youth Risk Behavior Surveillance System - 2013. [July 19, 2018];MMWR Recommendations and Reports. 2013 62(RR01):1–23. https://www.cdc.gov/mmwr/pdf/rr/rr6201.pdf. [PubMed] [Google Scholar]
- 25.Kann L, McManus T, Harris WA, et al. Youth Risk Behavior Surveillance — United States, 2015. [July 19, 2018];MMWR Surveillance Summaries. 2016 65(6):1–174. doi: 10.15585/mmwr.ss6506a1. http://eres.library.manoa.hawaii.edu/login?url=http://search.ebscohost.com/login.aspx?direct=true&db=c8h&AN=116111871&site=ehost-live. [DOI] [PubMed] [Google Scholar]
- 26.Hawaii Health Data Warehouse, author. State of Hawaii, Hawaii School Health Survey: Youth Risk Behavior Survey Module, 2017. 2018. Mar 5, [August 24, 2018]. http://ibis.hhdw.org/ibisph-view/query/selection/yrbs/_YRBSSelection.html.
- 27.Centers for Disease Control and Prevention (CDC), author 2017 Youth Risk Behavior Survey Results. Hawaii High School Survey: Risk Behaviors and Academic Achievement Report. [May 9, 2018]. http://www.hawaiihealthmatters.org/content/sites/hawaii/2017_HS_Hawaii_State_Academic_Achievement.pdf.
- 28.Centers for Disease Control and Prevention (CDC), author Hawaii 2017 and United States 2017 Results. High School YRBS. [August 3, 2018]. https://nccd.cdc.gov/youthonline/App/Results.aspx?TT=G&OUT=0&SID=HS&QID=QQ&LID=HI&YID=2017&LID2=XX&YID2=2017&COL=&ROW1=&ROW2=&HT=QQ&LCT=&FS=S1&FR=R1&FG=G1&FSL=&FRL=&FGL=&PV=&C1=HI2017&C2=XX2017&QP=G&DP=1&VA=CI&CS=N&SYID=&EYID=&SC=DEFAULT&SO=ASC&pf=1&TST=True.
- 29.Snyder T, de Brey C, Dillow S. Digest of Education Statistics 2015. 51st Edition. Washington, DC: U.S. Department of Education; 2016. [August 3, 2018]. p. 23.p. 137. National Center for Education Statistics & Institute of Education Sciences. 2016. https://nces.ed.gov/pubs2016/2016014.pdf. Published December 2016. [Google Scholar]
- 30.Hawaii Department of Education, author. Strive HI Statewide Snapshot. SY 2016–2017. 2017. Sep 21, [September 17, 2018]. http://www.hawaiipublicschools.org/DOE%20Forms/StriveHI2018/StriveHIStateSnapshot.pdf.
- 31.Hawaii Department of Education, author. Trend Report: Educational and Fiscal Accountability. State Summary of School Reports for School Year 2016–2017. 2017. Nov 16, [September 17, 2018]. http://arch.k12.hi.us/school/trends/trends.html.
- 32.Pyle SA, Sharkey J, Yetter G, Felxi E, Furlong MJ, Poston WS. Fighting an epidemic: The role of schools in reducing childhood obesity. [August 20, 2018];Psychology in Schools. 2006 43:361–376. https://onlinelibrary-wiley-com.eres.library.manoa.hawaii.edu/doi/full/10.1002/pits.20146. [Google Scholar]