

ABSTRACT
Many studies have demonstrated the effects of host diet on gut microbial membership, metagenomics, and fermentation individually; but few have attempted to interpret the relationship among these biological phenomena with respect to host features (e.g. gut morphology). We quantitatively compare the fecal microbial communities, metabolic pathways, and fermentation products associated with the nutritional intake of frugivorous (fruit-eating) and folivorous (leaf-eating) lemurs. Our results provide a uniquely multidimensional and comparative perspective on the adaptive dynamics between host and microbiome. Shotgun metagenomic sequencing revealed significant differential taxonomic and metabolic pathway enrichment, tailored to digest and detoxify different diets. Frugivorous metagenomes feature pathways to degrade simple carbohydrates and host-derived glycosaminoglycans, while folivorous metagenomes are equipped to break down phytic acid and other phytochemical compounds in an anaerobic environment. We used nuclear magnetic resonance based metabolic profiling of fecal samples to link metabolic pathways to fermentation products, confirming that the dissimilar substrates provided in each diet select for specific microbial functions. Fecal samples from frugivorous lemurs contained significantly different profiles of short chain fatty acids, alcohol fermentation products, amino acids, glucose, and glycerol compared to folivorous lemurs. We present the relationships between these datasets as an integrated visual framework, which we refer to as microbial geometry. We use microbial geometry to compare empirical gut microbial profiles across different feeding strategies, and suggest additional utility as a tool for hypothesis-generation.
KEYWORDS: gut microbiome, microbial ecology, lemur, fermentation, dietary fiber, next-generation sequencing
Introduction
Animals have evolved a suite of adaptations to accommodate diverse feeding strategies. Herbivores consume high-fiber diets and typically have complex gastrointestinal tracts, which increase microbial niche space and gut transit time. This combination of specialized feeding strategy and gut morphology recruits trillions of commensal and symbiotic microbes — collectively known as the gut microbiome (GM) — which also contribute to nutritional ecology by facilitating digestion of fiber and other dietary components that are otherwise inaccessible to their hosts. Hosts evolve traits to select for specific microbial community membership and functions that complement their feeding strategy. Synergistically, the microbiome evolves to exploit features and resources in the gut via enrichment of specific genes and functions that increase fitness but minimize negative impact on the host.
Diet is increasingly targeted both as a contributor to inflammatory disease and as a method of prevention or therapy.1 However, we still lack an understanding of human gut microbial dynamics in the broader context of other primates. We bridge this gap with a comparative study of lemur gut microbial taxa, metabolic pathways, and fermentation products that offers insight to microbial ecology as well as primate-microbial dynamics. Our research expands on previous studies to investigate the specific mechanisms by which gut microbial communities adapt and contribute to host nutrition in lemurs. Lemurs provide a basal group for exploring host-microbial dynamics across a range of phenotypes in a phylogenetically constrained group of primates, and for testing whether the microbial trends observed in humans and model species extend to other primates. That is, we can verify whether the “rules” of microbial ecology are universal and if the human gut microbiome is derived from an ancestral primate state, or if perceived dysbioses and other salient features are merely artifacts of our built environment and other recent lifestyle changes.2
Here we focus on Varecia variegata, Lemur catta, and Propithecus coquereli, which have evolved distinct gut morphologies to accommodate their respective frugivorous, generalist, and folivorous wild feeding strategies (Figure 1). Captive studies in a naturalistic setting enable dietary control without other consequences of the modern human lifestyle such as reduced exposure to sunlight, increased sedentary lifestyle, high-fat diet, and chronic stress, all of which contributed to systemic inflammation and thus may impact the GM. We previously detected significantly greater diversity (p = 0.0002) and less inter-individual variation in folivorous P. coquereli compared to either Varecia variegata or Lemur catta,3 demonstrating the selective power of high fiber diet, increased gut length and retention time for maintaining a complex and stable GM. In this study, we continue to probe the effects of diet and phylogeny by assessing metagenomic and metabolomic profiles from the same fecal samples for which 16S rRNA gene-derived membership was characterized previously.3 Previous studies have demonstrated the power of diet in shaping microbial community membership and functionality in humans4 and across mammals with different feeding strategies.5 A favorite scapegoat is the modern high-sugar diet, which has previously been addressed with dietary intervention.1 However, microbial function cannot be reliably inferred from taxonomic assignment: horizontal gene transfer rapidly transmits adaptive functions across vast phylogenetic distances throughout the microbiome.6 While horizontal gene transfer has been posited as a community-level adaptive response to environmental selection,6 very few studies have analyzed or compared microbial membership, metagenomic, and metabolic profiles from the same sample set (although see1). Comparing previously published data with captive lemur species that exhibit different gut morphologies and feeding strategies enables us to test predictions about dietary and microbial involvement in human health.
Figure 1.
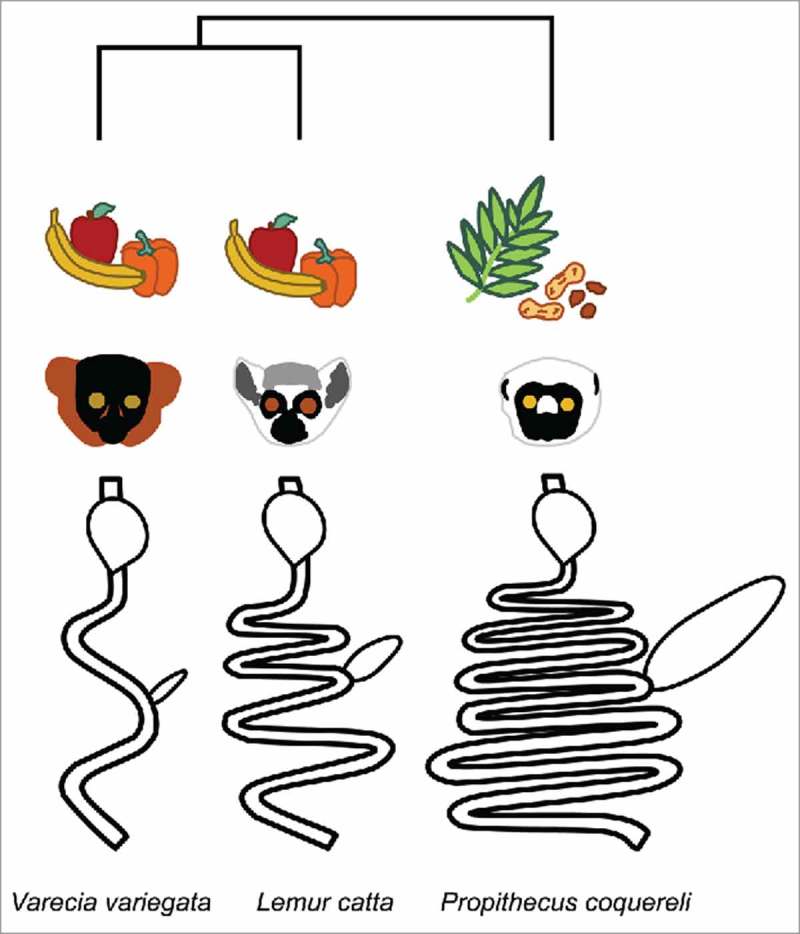
Varecia variegata, Lemur catta, and Propithecus coquereli represent deep lineages with diverse gut morphologies adapted to different feeding strategies. V. variegata and L. catta are fed similar diets in captivity. Gut diagrams are adapted from.34
We expect that P. coquereli's specific diet and gut morphology select for a conserved metagenome along with increased fermentation of fiber-derived products such as acetate and butyrate compared to other lemurs. Furthermore, if a relatively high-sugar diet selects for a “dysbiosic” gut microbiome, then frugivorous lemurs should host more microbial taxa with more metabolic pathways similar to humans with inflammatory disease, compared to folivorous lemurs.
Results
Propithecus coquereli consume a diet containing less starch but increased fiber and protein compared to V. variegata and L. catta (Table 1). Adonis testing found no significant associations between overall taxonomic or functional composition and host species (ptax = 0.371, pfxn = 0.243), diet (ptax = 0.146, pfxn = 0.315), or life stage (ptax = 0.483, pfxn = 0.442). However, diet does explain the majority of metagenomic variation detected using PCoA and Unweighted Pair Group Method with Arithmetic mean (UPGMA) clustering (Figure 2). For example, in Figure 2c, life stage progression from left to right along PC1 correlates with maturation of diet (from nursing to weaning) and explains 39.99%of variation. The broad spread of frugivorous lemur GMs across PC2, which explains 23.82% of variation, suggests that folivorous P. coquereli host more consistent GMs with minimal metagenomic variation. The dietary effect on GM consistency is also evident: inter-individual variation correlates to increased sugar and starch consumption in L. catta and V. variegata, while folivorous lemur GMs cluster tightly in later life stages, indicating a more specific GM associated with fiber intake.
Table 1.
Nutritional composition of diets and browse fed to captive Varecia variegata, Lemur catta, and Propithecus coquereli in captivity.
| V. variegata, L. catta | P. coquereli | Browse |
||||||||
|---|---|---|---|---|---|---|---|---|---|---|
| Pelleted feed, fresh produce | Pelleted feed, fresh produce | Average | Mimosa | Red bud | Sweet gum | Tulip poplar | Sumac (fresh) | Sumac (frozen) | ||
| % moisture | 10.2 | 5.5 | 6.1 ± 0.8 | 5.7 | 4.7 | 7.4 | 8.7 | 3.2 | 7 | |
| % dry matter (DM) | 89.8 | 94.5 | 93.9 ± 0.8 | 94.3 | 95.3 | 92.6 | 91.3 | 96.8 | 93 | |
| Crude protein (%DM) | 17.9 | 25 | 17.1 ± 3.0 | 30.8 | 17.9 | 11.6 | 13.5 | 17.8 | 10.9 | |
| Adjusted protein (%DM) | 17.9 | 25 | 16.2 ± 3.2 | 30.8 | 17.9 | 11.6 | 13.5 | 15.2 | 8.3 | |
| Acid detergent fiber (ADF, %DM) | 8.8 | 21.5 | 19.1 ± 1.6 | 20.8 | 18.4 | 20.9 | 22.1 | 11.7 | 20.6 | |
| Neutral detergent fiber (NDF, %DM) | 15 | 29.1 | 23.1 ± 1.4 | 26.4 | 20.8 | 24.7 | 25.6 | 17.5 | 23.5 | |
| Non-fiber carbohydrates (%DM) | 61 | 39.1 | 54.4 ± 3.8 | 36.4 | 54.1 | 57.5 | 55.3 | 60.9 | 62 | |
| Ash (%DM) | 6.1 | 6.81 | 5.5 ± 0.6 | 6.39 | 7.13 | 6.28 | 5.63 | 3.84 | 3.59 | |
| Calcium (%DM) | 1.04 | 1.16 | 1.01 ± 0.17 | 0.75 | 1.63 | 1.22 | 0.88 | 0.44 | 1.11 | |
| Phosphorous (%DM) | 0.63 | 0.69 | 0.25 ± 0.04 | 0.35 | 0.34 | 0.2 | 0.22 | 0.28 | 0.09 | |
| Magnesium (%DM) | 0.21 | 0.24 | 0.22 ± 0.04 | 0.34 | 0.21 | 0.31 | 0.25 | 0.13 | 0.1 | |
| Potassium (% DM) | 1.08 | 1.33 | 1.26 ± 0.24 | 2.09 | 1.43 | 1.06 | 1.46 | 1.21 | 0.32 | |
| Sodium (%DM) | 0.245 | 0.183 | 0.026 ± 0.002 | 0.023 | 0.028 | 0.034 | 0.025 | 0.021 | 0.023 | |
| Iron (PPM) | 396 | 632 | 79 ± 10.7 | 94 | 122 | 82 | 59 | 52 | 65 | |
| Manganese (PPM) | 119 | 98 | 175.8 ± 110.5 | 74 | 37 | 718 | 166 | 27 | 33 | |
| Zinc (PPM) | 108 | 220 | 103.3 ± 50.3 | 48 | 351 | 95 | 55 | 37 | 34 | |
| Copper (PPM) | 27 | 145 | 60 ± 31.1 | 15 | 207 | 76 | 39 | 17 | 6 | |
ADF comprises the least digestible portion of forage, including cellulose and lignin.
NDF comprises structural components of plant cells including hemicellulose, cellulose, and lignin.
Non-fiber carbohydrates comprise starch, soluble fiber (non-NDF, nonstarch polysaccharides, such as pectin), and low molecular weight carbohydrates (such as mono- and oligosaccharides).
Figure 2.
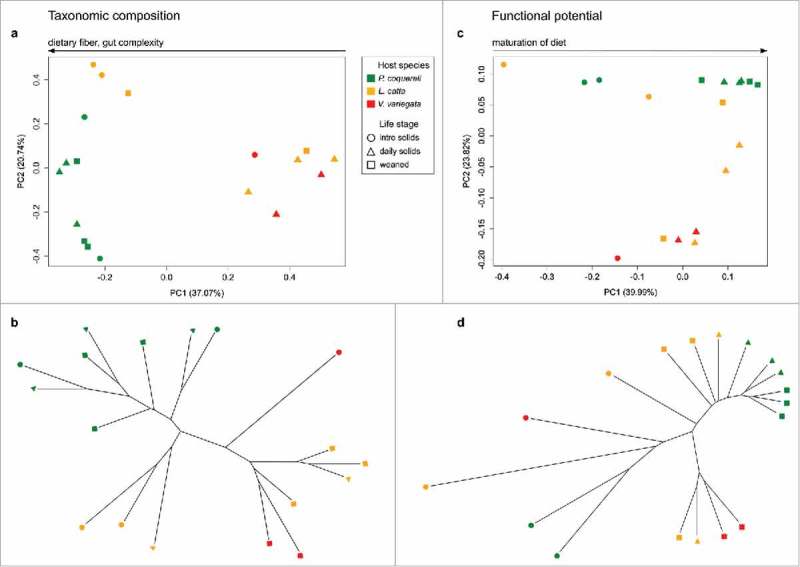
Lemur age and species drive metagenomic variation. We used jackknifed Bray Curtis distances to compare metagenomic profiles at key developmental life stages across three lemur species. Each library was subsampled at a depth of 790000 to match the number of counts in the smallest library. Bray Curtis distance quantifies the dissimilarity between metagenomic libraries based on the abundance of each metabolic pathway represented per metagenome. We also mapped the relationships between samples onto a tree using UPGMA (Unweighted Pair Group Method with Arithmetic mean), based on pairwise distances. Diet and species appear to drive taxonomic variation in panels (a) and (b), while variation in functional potential correlates with age (PC1) and species (PC2) in panel (c). UPGMA further demonstrates that folivorous P. coquereli samples cluster separately from frugivorous L. catta and V. variegata samples at all life stages (d).
While shotgun sequencing analysis detected fewer taxa than a previously published study of the same fecal samples using 16S rRNA gene targeted amplicon sequencing,3 the overall trends remained significant. That is, P. coquereli host higher diversity than either V. variegata or L. catta (Table 2), comprising more fiber-digesting taxa. Interestingly, while taxonomic diversity and number of metabolic pathways both increase with fiber intake (Figure 2), host diet and species have a similar but opposite effect on Bray Curtis distances (Table 2, Figure 3): GMs from leaf-eating P. coquereli exhibit significantly less variation in both taxonomic membership and functional potential than frugivorous V. variegata or L. catta.
Table 2.
Diet differentially impacts metagenomic composition and variation in captive lemurs.
| Taxonomic composition | Functional potential | Variation | |
|---|---|---|---|
| Diet (species) |
Shannon diversity |
Enriched pathways |
Bray Curtis distance |
| Fruit (V. variegata, L. catta) | low (1.95) | low (126) | high (0.319) |
| Leaves (P. coquereli) | high (2.55) | high (162) | low (0.249) |
Figure 3.
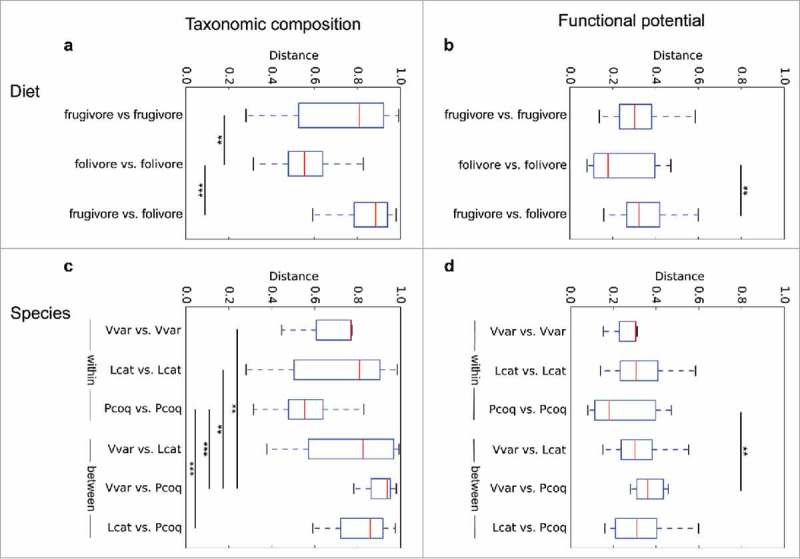
Host diet and species shape gut metagenomic composition. We used t-tests with Bonferroni correction to compare Bray Curtis distance between diets and lemur species. Trends indicate similar overall impacts on both taxonomic composition and functional potential. That is, folivores' gut microbiomes are significantly different from frugivores' (a,b); and distances between different species are significantly greater than variation within the same species (c,d). *indicates p-value < 0.05, **indicates p-value < 0.01, ***indicates p-value < 0.001.
We next used linear discriminant analysis effect size (LEfSe) to detect the taxa and pathways specific to macronutrient and vitamin metabolism that underlie these significant compositional differentiations based on diet. LEfSe detected taxonomic enrichment similar to 16S rRNA results3 (Table 3). That is, leaf-eating P. coquereli host GMs enriched in Rikenellaceae and Ruminococcaceae genera previously isolated from cows and other herbivores. L. catta hosted significantly more Prevotella, while V. variegata GMs were enriched in Treponema and Spirochaetes. LEfSe analysis of functional profiles revealed increased metabolic pathways for amino acids and secondary metabolites produced by plants in folivores, while frugivore GMs were enriched in pathways for carbohydrate, glycan, vitamin and cofactor metabolism (Figure 4). Additional investigation of these enriched pathways using the interactive KEGG reference pathway (http://www.genome.jp/kegg-bin/show_pathway?map01100) revealed that frugivorous and folivorous metagenomes feature metabolic networks tailored to digest the nutrients in each specific diet, which we present as a “subway” diagram (Figure 5). For example, frugivorous metagenomes were enriched for “routes” to metabolize starch and sucrose, amino sugar and nucleotide sugar, while folivorous metagenomes featured “routes” to metabolize chlorophyll and secondary plant compounds including phytic acid, flavones, and flavonol.
Table 3.
LEfSe analysis revealed significant, species-specific taxonomic enrichment (p < 0.05) similar to previous results based on 16S rRNA gene sequencing. 3
| Species | Phylum | Order | Family | Genus | Log(LDA) |
|---|---|---|---|---|---|
| L.catta | Bacteroidetes | Bacteroidales | Bacteroidaceae | Bacteroides | 4.98 |
| Porphyromonadaceae | Odoribacter | 3.52 | |||
| Prevotellaceae | Prevotella | 5.21 | |||
| Rikenellaceae | Alistipes | 3.32 | |||
| Deferribacteres | Deferribacterales | Deferribacteraceae | Mucispirillum | 4.10 | |
| Firmicutes | Clostridiales | Lachnospiraceae | Roseburia | 3.34 | |
| unknown | 3.63 | ||||
| Ruminococcaceae | Ruminococcus | 4.44 | |||
| P.coquereli | Bacteroidetes | Bacteroidales | Bacteroidaceae | Bacteroides | 4.71 |
| Rikenellaceae | Alistipes | 4.53 | |||
| Firmicutes | Clostridiales | Lachnospiraceae | Blautia | 3.70 | |
| Lachnospiraceae | unknown | 4.52 | |||
| Ruminococcaceae | Subdoligranulum | 5.08 | |||
| Proteobacteria | Burkholderiales | Oxalobacteraceae | Oxalobacter | 3.29 | |
| Desulfovibrionales | Desulfovibrionaceae | Bilophila | 3.29 | ||
| Desulfovibrio | 3.71 | ||||
| Enterobacteriales | Enterobacteriaceae | Escherichia | 4.23 | ||
| V.variegata | Actinobacteria | Coriobacteriales | Coriobacteriaceae | Collinsella | 3.46 |
| Bacteroidetes | Bacteroidales | Porphyromonadaceae | Barnesiella | 3.69 | |
| Prevotellaceae | Prevotella | 4.01 | |||
| Deinococcus_Thermus | Deinococcales | Deinococcaceae | Deinococcus | 3.75 | |
| Firmicutes | Clostridiales | Eubacteriaceae | Eubacterium | 3.48 | |
| Lachnospiraceae | Blautia | 3.55 | |||
| Dorea | 3.97 | ||||
| Peptostreptococcaceae | unknown | 3.92 | |||
| Erysipelotrichales | Erysipelotrichaceae | Catenibacterium | 3.99 | ||
| unknown | 3.90 | ||||
| Selenomonadales | Acidaminococcaceae | Phascolarctobacterium | 4.62 | ||
| Proteobacteria | Burkholderiales | Burkholderiales | unknown | 3.45 | |
| Spirochaetes | Spirochaetales | Spirochaetaceae | Treponema | 4.63 |
Figure 4.
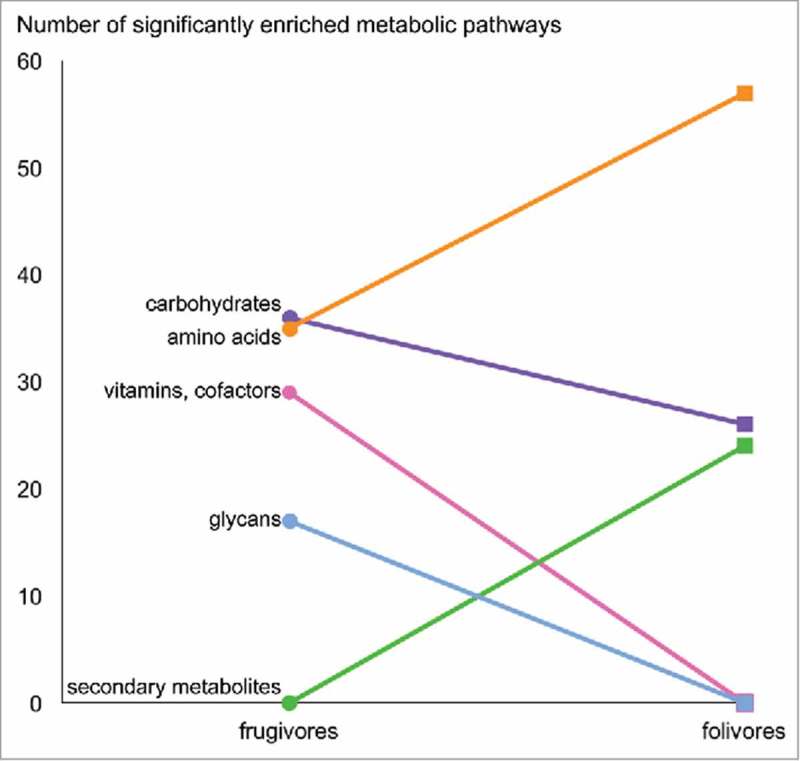
Frugivorous and folivorous metagenomes feature differential metabolic enrichment. Metabolic pathways with significant Linear discriminant analysis Effect Size (LEfSe) scores were identified as biomarkers for each diet.
Figure 5.
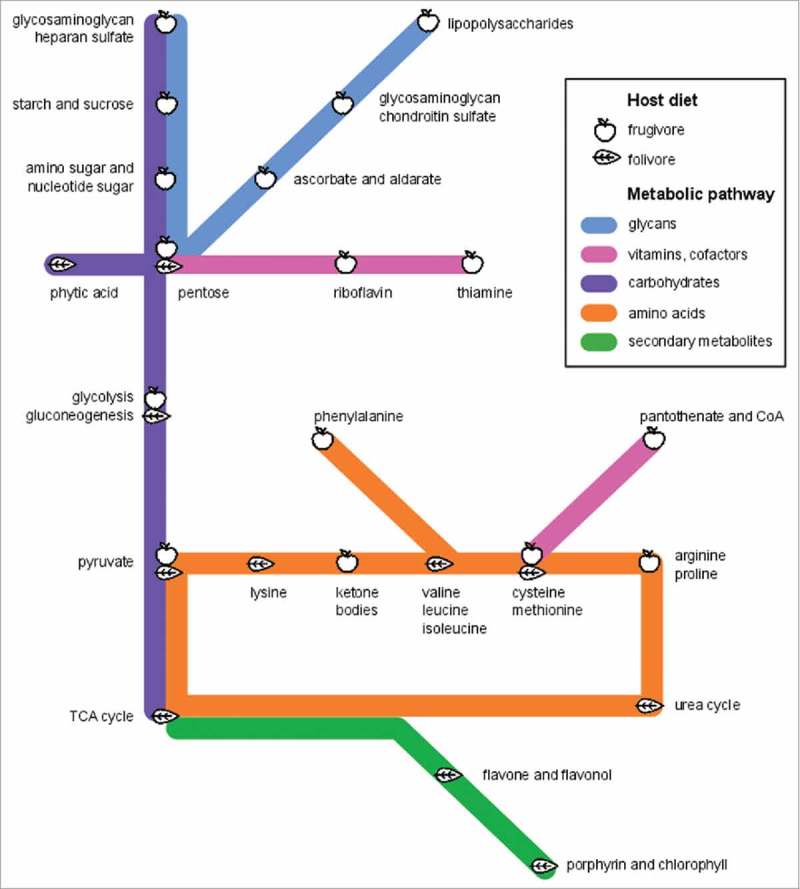
Lemur metagenomes are tailored to diet. We use a “subway diagram” to illustrate the different “metabolic routes” enriched in frugivours versus folivorous metagenomes. L. catta and V. variegata microbiomes are capable of metabolizing a range of sugars, starches, and host-derived glycans, reflecting their fruit-based diet and shorter transit times, while P. coquereli metagenomes appear adapted specifically for anaerobic fiber digestion.
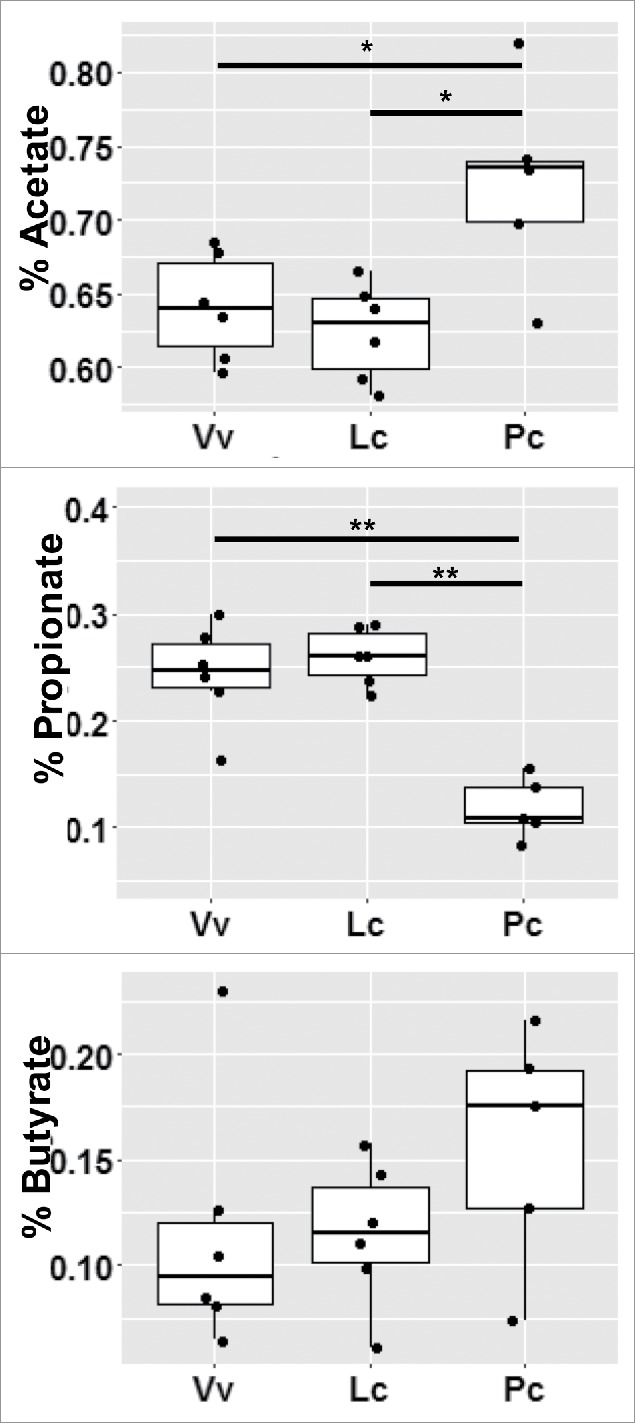
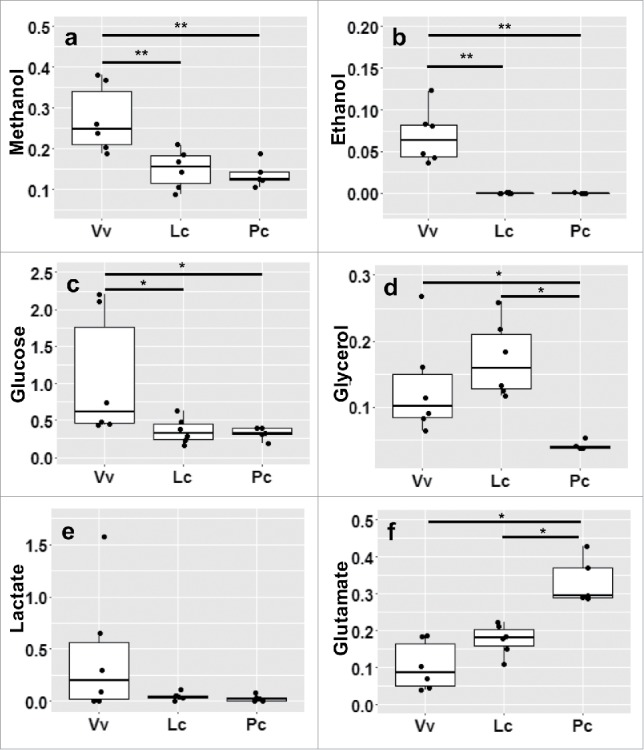
Significant differences in fecal metabolites confirmed microbial adaptation to high non-fiber carbohydrate concentration in frugivores, and to fiber- and protein-rich leaves in folivores (Table 4, Figures 6 and 7). Frugivorous GMs produce significantly more propionate (Table 4, Figure 6), while folivorous GMs produced significantly higher percentages of acetate (Figure 6) and higher levels of glutamate (Table 4, Figure 7f). V. variegata GMs also produce significantly higher levels of methanol, ethanol, and glucose (Table 4 and Figure 7a-c). We summarize the empirically measured links between nutritional input and microbial output in Table 5, and discuss the implications for each feeding strategy below.
Table 4.
Fecal metabolites vary across species. All metabolite concentrations (mmol) were measured and normalized by initial sample weight, then averaged across weaned infants.
| Dunn Test values | ||||
|---|---|---|---|---|
| Kruskal Wallis Test |
Lc vs Pc |
Lc vs Vv |
Pc vs Vv |
|
| Short Chain Fatty Acids | ||||
| Formate | 0.076 | 0.41791 | 0.05522 | 0.05589 |
| Acetate | 0.286 | 0.22913 | 0.28378 | 0.17470 |
| Propionate | 0.086 | 0.04386 | 0.24636 | 0.09523 |
| Butyrate | 0.244 | 0.22926 | 0.24835 | 0.14301 |
| Alcohols | ||||
| Ethanol | 0.00054 | 0.50000 | 0.00097 | 0.00086 |
| Methanol | 0.0076 | 0.40946 | 0.00641 | 0.00932 |
| Isopropanol | 0.038 | 0.02546 | 0.36580 | 0.02953 |
| Amino Acids | ||||
| Alanine | 0.012 | 0.00560 | 0.03406 | 0.16060 |
| Glutamate | 0.0031 | 0.02193 | 0.10426 | 0.00109 |
| Leucine | 0.683 | 0.59275 | 0.40956 | 0.39541 |
| Isoleucine | 0.798 | 0.49118 | 0.40956 | 0.75910 |
| Valine | 0.819 | 0.43368 | 0.50000 | 0.86736 |
| Energy Metabolites | ||||
| Glucose | 0.018 | 0.39261 | 0.01432 | 0.01825 |
| Glycerol | 0.004 | 0.00161 | 0.15174 | 0.01655 |
| Lactate | 0.257 | 0.24446 | 0.24367 | 0.15009 |
| Aromatic Metabolites | ||||
| ß-Hydroxyphenylacetate | 0.282 | 0.12776 | 0.47707 | 0.23084 |
| Phenylacetate | 0.901 | 0.41371 | 0.97115 | 0.62056 |
| Phenylalanine | 0.667 | 0.34335 | 0.45518 | 0.55707 |
| Uracil | 0.019 | 0.04625 | 0.00892 | 0.22542 |
Figure 6.
Short chain fatty acid (SCFA) production reflects dietary fiber. The measure of each SCFA was normalized by initial sample weight, then calculated as a percentage of total SCFA production and averaged across weaned infants. *indicates p-value < 0.05, **indicates p-value < 0.01.
Figure 7.
Gut microbes produce metabolite profiles specific to host diet and species. All metabolite concentrations (mmol) were measured and normalized by initial sample weight, then averaged across weaned infants.
Table 5.
Significant microbial metabolites fermented from dietary substrates.
| Fermentation products |
|||
|---|---|---|---|
| Diet | nutrients | intermediates | end products |
| fruit-based | glucose | lactate, pyruvate | SCFA, ethanol |
| pectin | propionate, methanol | ||
| leaf-based | protein | glutamate | |
| fiber | acetate, butyrate | ||
Discussion
We detected differential signatures of host species and diet in gut metagenomic composition (Figure 2). Both factors appear to incur more significant differences in taxonomic composition than functional potential (Figure 3). The relationship is particularly strong in folivorous lemurs, whose GMs comprise higher taxonomic diversity and more enriched metabolic pathways, but consistently exhibit less variation than lemurs that eat fruit (Table 2). We infer from these results that characteristics specific to each gut environment select for different bacterial taxa with similar genes that enable them to metabolize similar dietary substrates. Our findings are consistent with previous discussion of functional overlap in microbial communities, and further suggest that dietary fiber is implicated in the link between high taxonomic diversity and functional stability.
Bespoke services
Dietary carbohydrates, specifically resistant starches and dietary fibers, are substrates for fermentative production of short chain fatty acids, primarily acetate, propionate and butyrate. The rate and amount of short chain fatty acid production depends upon the species and amount of microflora present in the colon,7 the substrate source,8 and the gut transit time.9, 10 Our results suggest that host diet and gut morphology may act as selective filters that favor the colonization of bacterial taxa with specific functions to metabolize essential nutrients. A previous study demonstrated that while P. coquereli host significantly higher 16S rRNA gene diversity than L. catta or V. variegata, the folivore's high fiber intake and gut complexity select for minimal variation in bacterial membership.3 In the present study, principle coordinate analysis and statistical comparison of shotgun sequences from the same samples indicate that age and diet-related patterns overcome individual metagenomic differences (Figures 2 and 3). Linear discriminant analysis also suggests that gut metagenomes are honed to digest either fruit- or leaf-based diets (Figures 4 and 5). In the latter, flavones contribute to plant pigmentation,11 whereas phytic acid impairs absorption of iron, zinc, and calcium.12 By breaking down phytic acid, microbes may prevent mineral deficiencies in P. coquereli. LEfSe also identified several differentially enriched amino acid pathways (Figures 4 and 5), suggesting that gut microbes not only supplement dietary intake, but may also satisfy host nutritional requirements. For example, arginine and proline provide additional substrates for protein synthesis, while essential amino acids such as methionine, valine, leucine, isoleucine, and phenylalanine (a precursor to tryptophan) cannot be produced by the host at all. Pathways for branched-chain amino acids (valine, leucine, and isoleucine; Figure 5) and glutamate biosynthesis (Figure 6f) distinguished folivorous lemur samples in this study, and were also enriched in herbivore GMs in a previous study.5
Quantification of metabolites using NMR confirmed that feeding strategy selects for specific microbial functions and metabolites (Table 5). The significantly increased acetate in the P. coquereli samples (Table 4, Figure 6) is fully consistent with that species' higher fiber diet. Folivorous GMs ferment dietary fibers to produce increased acetate and butyrate, while frugivorous GMs produce more propionate from non-fiber carbohydrates (Tables 1 and 4; Figure 6). Certain gut bacteria degrade non-fiber carbohydrates with concurrent release of methanol; and indeed, the V. variegata GMs produce higher levels of methanol (Table 4 and Figure 7a). The methanol levels from P. coquereli are very low in comparison, consistent with the lower non-fiber carbohydrates in leaves compared to fruit. The significant levels of both ethanol and glucose (Table 4, Figure 7b-c) observed in V. variegata are also likely derived from the greater levels of non-fiber carbohydrates in their fruit-based diet. Conversely, frugivorous feces contained higher levels of glucose and glucose-derived metabolites (Table 5, Figure 7). Fermentation of glucose can generate lactate or pyruvate as intermediates. Lactate production and utilization is typically well balanced in the fecal microbiome.13 Lactic acid bacteria can ferment glucose to produce two molecules of lactic acid in a process called homo-lactic fermentation. Certain bacteria can also use hetero-lactic fermentation to convert glucose to lactic acid, ethanol, and CO2. Lactate is also an intermediate in the production of some of the short chain fatty acids, especially butyrate.14
Glycerol is the backbone of all triglycerides, and was elevated in V. variegata and L. catta compared to P. coquereli samples (Table 4, Figure 7). The normally incomplete digestion and absorption of triglycerides can lead to a mixture of glycerol, free fatty acids, and undigested glycerides entering the colon.15 Glycerol levels in the gut are dependent upon other fermentation products. For example, butyrate has been shown to stimulate glycerol absorption.16, 17 As noted earlier, the differences in the butyrate levels between the species is not significantly different; but the trend of higher butyrate in P. coquereli is consistent with the lower level of glycerol that could result from increased absorption (Figure 7d).
Bacteria typically ferment glycerol to 1,3-propandiol (1,3-PDO) with 3-hydroxypropanal (3-HPA) as an intermediate.18 While most glycerol reducing species efficiently reduce glycerol to the end product, 1,3-PDO, some lactobacilli are known to accumulate 3-HPA.19 In aqueous solution the 3-HPA becomes hydrated and dimerized, forming an equilibrium set of compounds known as reuterin.20 Reuterin may have significant health modulating effects due to its broad antimicrobial activity against pathogens21 and commensal gut bacteria.22 The low levels of glycerol in P. coquereli could indicate efficient metabolism of glycerol to either 1,3-PDO or potentially 3-HPA. Thus, the presence of reuterin in the very long gut of the P. coquereli could help to maintain a healthy microbiome via colonization resistance.
We also see evidence that gut morphology impacts GM productivity, separate from diet. Specifically – while the gut metagenome determines a microbial community's functional potential, the host's gut morphology appears, in part, to determine what fermentation products are actually produced. Despite having dietary and metagenomic profiles more similar to V. variegata, L. catta fecal metabolite profiles were often more similar to P. coquereli (see methanol, ethanol, glucose, and lactate in Figure 7). These differences are likely linked to L. catta's increased gut complexity and longer transit time compared to V. variegata. Given the same dietary input, an animal with a longer gut typically has more time to digest the diet and absorb metabolic products produced by gut microbes. This is especially true of soluble compounds with relatively low molecular weight, such as glucose. Given that microbes ferment glucose to produce methanol, ethanol, and lactate; and assuming that increased gut transit time enables the host to absorb more glucose, we suggest that L. catta’s gut microbes have access to less glucose compared to V. variegata GMs, and thus produce fewer products of glucose fermentation.
Context dependence
While diet and gut morphology select for specific microbial taxa and functions that are beneficial to the host, host-associated microbes exhibit additional context-dependent adaptations to survive in the host gut environment. For example, in addition to producing amino acids for the host, folivorous microbes are equipped to reclaim nitrogen from leaves via the urea cycle (Figure 5). Gut microbes utilize the nitrogen for their own growth; but the amino acids and peptides they produce can also be reabsorbed by the host.23 Frugivorous metagenomes, by contrast, feature pathways for metabolism of starch and sugars, host-derived glycosaminoglycans, ascorbate (vitamin C) and aldarate, pantothenate and CoA, and lipopolysaccharide production. Interestingly, these five biomarkers for healthy frugivorous lemurs are also predictive of dysbiosis in humans,1,24 suggesting that naturally rapid passage rates in one species and disease state in another may incur the same microbial adaptations. We therefore propose that these “pathological” pathways are, in fact, merely commensal.
In V. variegata and L. catta, microbial utilization of starch, sugars, and glycosaminoglycans (Figure 5) reflects adaption to the frugivores' low-fiber diet. Glycosaminoglycan foraging has been particularly well documented in Bacteroidetes, which were consistently present at higher abundance in frugivorous versus folivorous lemurs in a previous study.3 In humans with intestinal illness, gut microbes eat glycosaminoglycans when intestinal cells are sloughed and gut transit time increases due to diarrhea. In frugivorous lemurs, microbes may digest glycosaminoglycans for lack of preferred substrates, such as dietary fiber. Given that fruit contains high levels of vitamin C, it is unsurprising that frugivores' microbiomes are also adapted to metabolize ascorbate (Figure 5). Furthermore, NMR detected increased levels of lactate, ethanol, and methanol in V. variegata (Figure 7), all of which are derived from glucose. Glucose is readily fermented by gut bacteria in both foregut and hindgut herbivores to produce formate and acetate.5 Increased glucose in V. variegata may therefore indicate incomplete fermentation due to shorter gut length and reduced bacterial load.
A previous study found that opportunistic gut microbes are well adapted to rapid transit time and other hallmarks of disrupted environments.25 Our detection of several human disease-associated pathways in healthy lemurs with rapid gut transit times suggests that certain microbial taxa or functions may be mislabeled as pathogens, when they are actually opportunistic commensals along for the ride. In these cases of mistaken pathology, the additional context offered by comparative studies of non-traditional species may help to distinguish correlation from causation and thus have significant implications for the medical community. For example, dietary manipulation could further probe whether increasing fiber consumption by frugivorous primates could alter GM profiles and ultimately improve host health.
Microbial geometry
We present the relationships between these datasets in Figure 8 using a novel integrative visual framework, which we refer to as microbial geometry, following the concept of nutritional geometry which allows investigators to track which food items animals select for and which nutrients they “defend” as they forage. However, where nutritional geometry plots compare three factors (dietary protein, carbohydrates, and fat), we use a radar chart with four factors of interest, upon which we can plot the characteristics of different gut systems to compare microbial community dynamics. The resulting shapes visualize the interplay between available resources (i.e. dietary input), environmental constraints (i.e. gut transit time), and microbial community responses (i.e. metagenomic diversity and metabolite production). We present two examples to demonstrate the utility of microbial geometry, using data from the current study.
Figure 8.
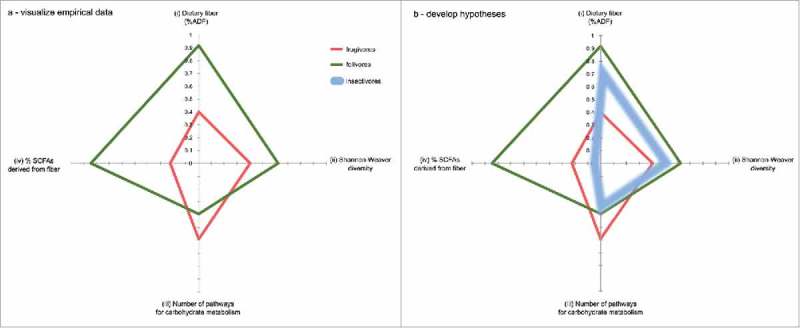
Dietary fiber shapes microbial community form and function. Frugivorous and folivorous diets provide nutritionally distinct substrates for fermentation, and thus cultivate distinct microbiomes (a). For example, folivorous lemurs (in green) consume more dietary fiber (i), which supports a higher diversity of microorganisms (ii) that draw from a more limited, specialized pool of metabolic pathways (iii) to produce more short chain fatty acids (iv) compared to frugivores. We normalized values for each of the four axes on a 0–1 scale. Dietary fiber (%ADF) for each representative diet was normalized on a scale from 0 to 42.5%, which is the highest %ADF value for any single item fed in either diet (tulip poplar; see Table 1). The number of pathways for carbohydrate metabolism associated with each feeding strategy was normalized compared to the abundance of all other metabolic pathways (plotted in Figure 3). Having visualized our empirical data, we next demonstrate the utility of microbial geometry for developing hypotheses by predicting the approximate “shape” of an insectivorous lemur (i.e. mouse lemur or aye-aye) GM within the existing contextual framework (b). The chitin that makes up insects' exoskeletons comprises a “fiber” source indigestible to the host, that would provide a substrate for microbial fermentation. However, a previous study demonstrated that chitin-digesting bacteria produce ammonia and reducing sugars rather than SCFAs.26
First, to investigate the selective power of diet for shaping specific microbial metagenomic and fermentation profiles, we compare dietary fiber, bacterial diversity, enrichment for carbohydrate metabolism pathways, and fiber-derived fermentation products. The resulting shape represents the relationships between host intake and microbiome traits associated with different feeding strategies. In this example, (i) the increased dietary fiber consumed by folivorous lemurs provides niche space for (ii) more diverse bacterial taxa, which specialize in (iii) a relatively narrow range of metabolic pathways to produce (iv) higher levels of short chain fatty acids.
Not only does our schematic enable the comparison of multidimensional empirical datasets (Figure 8a), but our approach also assists the formulation of hypotheses to predict dynamics in novel systems compared to a known system (Figure 8b). For example, based on what we know about frugivorous and folivorous lemurs, what might we predict about an insectivorous lemur's GM? In this second example, we predict the microbial geometry of the aye-aye (Daubentonia madagascariensis), a lemur that forages insects, fungi, nectar, and nuts. Insects do not contain appreciable amounts of cellulose or lignin; but the chitin that makes up their exoskeletons is another type of polysaccharide that insectivorous hosts cannot digest. Therefore, we might predict that (i) the fiber content of an insectivore's diet would fall between that of a fruigivore and a folivore, and that (ii) intermediate fiber levels may support intermediate levels of bacterial diversity. Without nutritional analysis, we assume that the aye-aye diet contains higher protein and less sugar than either folivorous or frugivorous lemurs' diets, and predict that (iii) the aye-aye metagenome will therefore encode fewer pathways for carbohydrate metabolism. Finally, chitin-fermenting microbes have been shown to produce glucosamine, N-acetylglucosamine, and chitooligosaccharides26; but there are no published records of SCFA production. Therefore, we predict that (iv) an insectivore's GM will produce little to no SCFAs.
Synthesis
Diet is recognized as a key factor in shaping the gut microbiome across host species.4,5 The GM is increasingly implicated in human health concerns,24 making diet an attractive target for therapeutic intervention.1 However, there is a current lack of context for understanding human gut microbial dynamics compared to other primates. Our results confirm that increased dietary fiber supports bacterial diversity and metabolic processes which are beneficial to the host. Additionally, our finding that gut morphology elicits different microbial products from similar metagenomes further emphasizes the need for comparative studies to evaluate the difference(s) between opportunistic, commensal, and pathogenic microbes. Finally, we provide a technique for contemplating multidimensional data and conceptualizing future research.
Materials and methods
Dietary analysis
Captive Propithecus coquereli browse fresh tree cuttings (see Table 6), and are fed commercially available vegetables and greens; we refer to this as the folivorous diet. Captive Varecia variegata and Lemur catta, by contrast, are fed a diet of rotating fruit and vegetable mix, supplemented with nutritionally complete pelleted feed. We refer to this second diet as frugivorous. We collected representative dietary components and dried them in a lyophilizer for 24–48 hrs, or until weight remained constant (indicating that all moisture had been removed). After drying, dietary components were ground in a Waring blender and nutrients were quantified at Cumberland Valley Analytical Services (Hagerstown, MD, USA).
Table 6.
Gastrointestinal characteristics and diets fed to captive lemur species.
| Varecia variegata | Lemur catta | Propithecus coquereli | |
|---|---|---|---|
| Gut length to body length ratio | 4.65 ± 1.1 | 5.8 ± 0.4 | 15.5 ± 0.6 |
| Gut transit time (hrs) | 1.25 ± 1.1 | 6.45 ± 1.26 | 24.00 ± 0 |
| Captive diet items (g) | |||
| Lab Diet #5038 | 80–100 | 60 | |
| Mazuri Leaf Eater #5675 | 75 | ||
| Fruit rotation | 72 | 55 | |
| Vegetable rotation | 72 | 55 | 30 |
| Nuts/beans | 10 | ||
| Greens | 30 | ||
| Browse | 150 |
Fecal collection
The research protocols for this study (numbers A282-11-11 and A010-15-01) were approved by the Institutional Animal Care and Use Committee (IACUC) of Duke University. Fifty fresh fecal samples were collected from positively identified individuals at key developmental stages: introduction of solid foods, weaning, and fully weaned. Samples were stored in Whirl-pak bags (Nasco, Fort Atkinson, WI) and immediately frozen to -80°C to halt microbial reproduction and prevent DNA degradation.27
Metagenomic sequencing and analysis
DNA was extracted from each sample using the QIAamp Stool Mini Kit (QIAGEN, Hilden, Germany) following manufacturer guidelines, as previously described.3 DNA yields were quantified with a Qubit 3.0 (ThermoFisher Scientific, Massachusetts, USA). DNA aliquots were sent to New York Genome Center. Of the original 50 samples, only 20 passed quality control thresholds (length ≥1000 bp); all other samples contained DNA too fragmented and/or degraded. Of the samples that passed quality control, two were collected from siblings at the same time point and thus omitted, leaving 18 samples (Table 7). These 18 samples underwent library preparation for TruSeq 2 × 125bp sequencing on the Illumina HiSeq 2500 platform. Adapters were trimmed and quality filtering was performed using cutadapt.28 Low complexity reads and reads shorter than 50bp were filtered using prinseq-lite.29 Subsequently, phiX reads and host reads (identified from mmur 2.0 + P. coquereli genomes) were filtered using bbmap and bbduk from the biotools package (http://sourceforge.net/projects/bbmap/).
Table 7.
Fecal samples submitted for metagenomic sequencing and NMR spectroscopy. Only a subset of the available samples passed QC requirements for metagenomic sequencing.
| frugivorous |
folivorous |
||
|---|---|---|---|
| V. variegata | L. catta | P. coquereli | |
| Metagenomic sequencing | |||
| Intro solids | 1 | 2 | 2 |
| Daily solids | 2 | 3 | |
| Weaned | 2 | 3 | 3 |
| NMR spectroscopy | |||
| Weaned | 6 | 6 | 5 |
Taxonomic composition was determined using the marker-based approach MetaPhlAn2 (Truong 2015), which focuses on microbes, as well as an in-house developed pipline (taxMaps, available at https://github.com/nygenome/taxmaps) against the NCBI nucleotide database. The resulting table of relative taxonomic abundance per sample was converted to biom format for downstream analysis using QIIME (Quantitative Insights Into Microbial Ecology).30 We calculated Shannon-Weaver alpha diversity, which accounts for both species richness and evenness in each sample. We also used LEfSe (default settings, alpha = 0.0531) to detect significantly enriched taxa associated with diet (class = diet; no subclass; sample = SampleID) across all three lifestages. LEfSe detects differentially distributed pathways within each class using a Kruskall-Wallis test, then ranks enriched pathways by the log of their linear discriminant analysis scores.
Functional composition was determined using HUMAnN2 (v0.5.0, http://huttenhower.sph.harvard.edu/humann2), the aligner DIAMOND32 and the UniRef database (http://www.uniprot.org/help/uniref). HUMAnN2 details the abundance of each pathway in the community as a function of the abundances of the pathway's component reactions, with each reaction's abundance computed as the sum over abundances of genes catalyzing the reaction. We used jackknifed beta diversity to produce Principle Coordinate Analysis (PCoA) plots based on Bray Curtis distance between samples, and used the distance matrix of pairwise distances to visualize sample relationships in FigTree (v1.4.3, http://tree.bio.ed.ac.uk/software/figtree/) and complete statistical analyses.
We tested both taxonomic and functional distance matrices for significant effects of age, species, or diet on metagenomic composition using the nonparametric adonis(vegan 2.3–4) function in R.33 Adonis partitions the input distance matrix (default = 999 permutations) to statistically compare differences in metagenomic composition between sample classes (lifestage, species, and diet), and returns a pseudo F- and p-value. We also used t-tests with Bonferroni correction to compare the effect of host diet and species on pairwise Bray Curtis distances within and between categories. We next used LEfSe (default settings, alpha = 0.0531) to detect significantly enriched metabolic pathways associated with diet (class = diet; no subclass; sample = SampleID) across all three lifestages.
Accession numbers
Metagenomic sequencing data has been deposited in the Sequence Read Archive (Project ID PRJNA######).
Nuclear Magnetic Resonance (NMR) spectroscopy
We next quantified fecal metabolites using NMR, to check whether metagenomic profiles accurately predict microbial fermentation products. Frozen fecal samples were thawed and approximately 50 mgs were mixed with 200 µl phosphate buffered saline (PBS) prepared in D2O, pH 7.5. Samples were homogenized for 5 min at 30Hz. Samples were then centrifuged for 10 min at 14K x g at 4C. The supernatant was filtered through a 0.22 µm centrifugal filter. The pellet from the first centrifugation was re-extracted with another 200 µl PBS in 95% D2O, pH 7.5. The second slurry was homogenized for 5 min at 30Hz, followed by centrifugation with the supernatant filtered through a 0.22 µm filter as before. The supernatants were combined and 300 µl was mixed with 300 µl of 99.9% D2O containing 500 µM 3-(trimethylsilyl)-1-propanesulfonic acid-d6, sodium salt (DSS-d6).
NMR analysis was performed using an Avance III 700MHz NMR spectrometer (Bruker, Billerica, Massachusetts, USA) with a TXI triple resonance probe operating at 25C. Spectra were collected with a 1D NOESY pulse sequence covering 12 ppm. The spectra were digitized with 32768 points during a 3.9 second acquisition time. The mixing time was set to 100 ms and the relaxation delay between scans was set to 2.0 seconds.
NMR data were processed using Advanced Chemistry Development Spectrus Processor (version 2016.1, Toronto, Canada). The spectra were zero filled to 65536 points, apodized using a 0.3Hz decaying exponential function and fast Fourier transformed. Automated phase correction and 3rd order polynomial baseline correction was applied to all samples. Metabolite concentrations were quantified using the Chenomx NMR Suite (version 8.2, Edmonton, Canada). The DSS-d6 was used as a chemical shift and quantification reference for all spectra and was set to a chemical shift of 0.00 and a concentration of 250 µM. Quantitative fitting of each spectrum was carried out in batch mode, followed by manual adjustment for some spectra to correct for errors arising from spectral overlap. Final concentrations were normalized based on the weight of the feces used to prepare each sample. We used the Kruskal-Wallis rank sum test to identify significantly different metabolites across the three species, and compared between species with the Dunn test using the Benjamini-Hochberg adjustment for multiple comparisons. These and other statistical measures were calculated in R.
Disclosure of potential conflicts of interest
No potential conflict of interest was reported by the authors.
Acknowledgments
The authors would like to thank the staff at the Duke Lemur Center for their help and support. We are also grateful to Lydia Greene for helping to collect representative diet samples. This is Duke Lemur Center publication no. #1384.
Funding information
This research was funded by the Duke University.
References
- 1.Zhang C, Yin A, Li H, Wang R, Wu G, Shen J, Zhang M, Wang L, Hou Y, Ouyang H, et al.. Dietary Modulation of Gut Microbiota Contributes to Alleviation of Both Genetic and Simple Obesity in Children. EBioMedicine. 2015;2:968–84. doi: 10.1016/j.ebiom.2015.07.007. PMID:26425705 [DOI] [PMC free article] [PubMed] [Google Scholar]
- 2.Amato KR. Incorporating the gut microbiota into models of human and non‐human primate ecology and evolution. American journal of physical anthropology. 2016;159:S196–S215. doi: 10.1002/ajpa.22908. PMID:26808106 [DOI] [PubMed] [Google Scholar]
- 3.McKenney EA, Rodrigo A, Yoder AD. Patterns of gut bacterial colonization in three primate species. PLoS One. 2015;10:e0124618. doi: 10.1371/journal.pone.0124618. PMID:25970595 [DOI] [PMC free article] [PubMed] [Google Scholar]
- 4.David LA, Maurice CF, Carmody RN, Gootenberg DB, Button JE, Wolfe BE, Ling AV, Devlin AS, Varma Y, Fischbach MA, et al.. Diet rapidly and reproducibly alters the human gut microbiome. Nature. 2014;505:559–63. doi: 10.1038/nature12820. PMID:24336217 [DOI] [PMC free article] [PubMed] [Google Scholar]
- 5.Muegge BD, Kuczynski J, Knights D, Clemente JC, González A, Fontana L, Henrissat B, Knight R, Gordon JI. Diet drives convergence in gut microbiome functions across mammalian phylogeny and within humans. Science. 2011;332:970–4. doi: 10.1126/science.1198719. PMID:21596990 [DOI] [PMC free article] [PubMed] [Google Scholar]
- 6.Ochman H, Lawrence JG, Groisman EA. Lateral gene transfer and the nature of bacterial innovation. Nature. 2000;405:299–304. doi: 10.1038/35012500. PMID:10830951 [DOI] [PubMed] [Google Scholar]
- 7.Roberfroid MB. Introducing inulin-type fructans. British Journal of Nutrition. 2005;93:S13–S25. doi: 10.1079/BJN20041350. PMID:15877886 [DOI] [PubMed] [Google Scholar]
- 8.Cook S, Sellin J. Review article: short chain fatty acids in health and disease. Alimentary pharmacology & therapeutics 1998;12:499–507. doi: 10.1046/j.1365-2036.1998.00337.x. [DOI] [PubMed] [Google Scholar]
- 9.Argenzio R, Southworth M. Sites of organic acid production and absorption in gastrointestinal tract of the pig. American Journal of Physiology–Legacy Content. 1975;228:454–60. [DOI] [PubMed] [Google Scholar]
- 10.Owens F, Isaacson H. Ruminal microbial yields: factors influencing synthesis and bypass. Federation proceedings. 1977;36:198–202. PMID:838090 [PubMed] [Google Scholar]
- 11.Aherne SA, O'Brien NM. Dietary flavonols: chemistry, food content, and metabolism. Nutrition. 2002;18:75–81. doi: 10.1016/S0899-9007(01)00695-5. PMID:11827770 [DOI] [PubMed] [Google Scholar]
- 12.Schlemmer U, Frolich W, Prieto RM, Grases F. Phytate in foods and significance for humans: food sources, intake, processing, bioavailability, protective role and analysis. Mol Nutr Food Res. 2009;53(Suppl 2):S330–75. doi: 10.1002/mnfr.200900099. PMID:19774556 [DOI] [PubMed] [Google Scholar]
- 13.Bourriaud C, Robins RJ, Martin L, Kozlowski F, Tenailleau E, Cherbut C, Michel C. Lactate is mainly fermented to butyrate by human intestinal microfloras but inter-individual variation is evident. J Appl Microbiol. 2005;99:201–12. doi: 10.1111/j.1365-2672.2005.02605.x. PMID:15960680 [DOI] [PubMed] [Google Scholar]
- 14.Morrison DJ, Mackay WG, Edwards CA, Preston T, Dodson B, Weaver LT. Butyrate production from oligofructose fermentation by the human faecal flora: what is the contribution of extracellular acetate and lactate?. British Journal of Nutrition. 2006;96:570–7. PMID:16925864 [PubMed] [Google Scholar]
- 15.Vonk R, Kalivianakis M, Minich D, Bijleveld C, Verkade H. The metabolic importance of unabsorbed dietary lipids in the colon. Scandinavian journal of gastroenterology. 1997;32:65–7. doi: 10.1080/00365521.1997.11720722. [DOI] [PubMed] [Google Scholar]
- 16.Kato T, Hayashi Y, Inoue K, Yuasa H. Glycerol absorption by Na+-dependent carrier-mediated transport in the closed loop of the rat small intestine. Biological and Pharmaceutical Bulletin. 2005;28:553–5. doi: 10.1248/bpb.28.553. PMID:15744090 [DOI] [PubMed] [Google Scholar]
- 17.Fujimoto N, Inoue K, Ohgusu Y, Hayashi Y, Yuasa H. Enhanced uptake of glycerol by butyrate treatment in HCT-15 human colon cancer cell line. Drug metabolism and pharmacokinetics. 2007;22:195–8. doi: 10.2133/dmpk.22.195. PMID:17603220 [DOI] [PubMed] [Google Scholar]
- 18.Da Silva GP, Mack M, Contiero J. Glycerol: a promising and abundant carbon source for industrial microbiology. Biotechnology advances. 2009;27:30–9. doi: 10.1016/j.biotechadv.2008.07.006. PMID:18775486 [DOI] [PubMed] [Google Scholar]
- 19.Sauvageot N, Gouffi K, Laplace J-M, Auffray Y. Glycerol metabolism in Lactobacillus collinoides: production of 3-hydroxypropionaldehyde, a precursor of acrolein. International journal of food microbiology. 2000;55:167–70. doi: 10.1016/S0168-1605(00)00191-4. PMID:10791738 [DOI] [PubMed] [Google Scholar]
- 20.Vollenweider S, Grassi G, König I, Puhan Z. Purification and structural characterization of 3-hydroxypropionaldehyde and its derivatives. Journal of agricultural and food chemistry. 2003;51:3287–93. doi: 10.1021/jf021086d. PMID:12744656 [DOI] [PubMed] [Google Scholar]
- 21.Axelsson L, Chung T, Dobrogosz W, Lindgren S. Production of a broad spectrum antimicrobial substance by Lactobacillus reuteri. Microbial Ecology in Health and Disease. 1989;2:131–6. doi: 10.3109/08910608909140210. [DOI] [Google Scholar]
- 22.Cleusix V, Lacroix C, Vollenweider S, Duboux M, Le Blay G. Inhibitory activity spectrum of reuterin produced by Lactobacillus reuteri against intestinal bacteria. BMC microbiology. 2007;7:1. doi: 10.1186/1471-2180-7-101. PMID:17233889 [DOI] [PMC free article] [PubMed] [Google Scholar]
- 23.Stewart GS, Smith CP. Urea nitrogen salvage mechanisms and their relevance to ruminants, non-ruminants and man. Nutrition research reviews. 2005;18:49–62. doi: 10.1079/NRR200498. PMID:19079894 [DOI] [PubMed] [Google Scholar]
- 24.Larsen PE, Dai Y. Metabolome of human gut microbiome is predictive of host dysbiosis. Gigascience. 2015;4:42. doi: 10.1186/s13742-015-0084-3. PMID:26380076 [DOI] [PMC free article] [PubMed] [Google Scholar]
- 25.Lozupone C, Faust K, Raes J, Faith JJ, Frank DN, Zaneveld J, Gordon JI, Knight R. Identifying genomic and metabolic features that can underlie early successional and opportunistic lifestyles of human gut symbionts. Genome Res. 2012;22:1974–84. doi: 10.1101/gr.138198.112. PMID:22665442 [DOI] [PMC free article] [PubMed] [Google Scholar]
- 26.Sinha S, Chand S, Tripathi P. Microbial degradation of chitin waste for production of chitosanase and food related bioactive compounds. Applied biochemistry and microbiology. 2014;50:125. doi: 10.1134/S0003683814020173. [DOI] [PubMed] [Google Scholar]
- 27.Claesson MJ, O'Sullivan O, Wang Q, Nikkila J, Marchesi JR, Smidt H, de Vos WM, Ross RP, O'Toole PW. Comparative analysis of pyrosequencing and a phylogenetic microarray for exploring microbial community structures in the human distal intestine. PLoS One. 2009;4:e6669. doi: 10.1371/journal.pone.0006669. PMID:19693277 [DOI] [PMC free article] [PubMed] [Google Scholar]
- 28.Martin M. Cutadapt removes adapter sequences from high-throughput sequencing reads. EMBnet journal. 2011;17:pp. 10–2. doi: 10.14806/ej.17.1.200. [DOI] [Google Scholar]
- 29.Schmieder R, Edwards R. Quality control and preprocessing of metagenomic datasets. Bioinformatics. 2011;27:863–4. doi: 10.1093/bioinformatics/btr026. PMID:21278185 [DOI] [PMC free article] [PubMed] [Google Scholar]
- 30.Caporaso JG, Kuczynski J, Stombaugh J, Bittinger K, Bushman FD, Costello EK, Fierer N, Peña AG, Goodrich JK, Gordon JI, et al.. QIIME allows analysis of high-throughput community sequencing data. Nature methods. 2010;7:335–6. doi: 10.1038/nmeth.f.303. PMID:20383131 [DOI] [PMC free article] [PubMed] [Google Scholar]
- 31.Segata N, Izard J, Waldron L, Gevers D, Miropolsky L, Garrett WS, et al.. Metagenomic biomarker discovery and explanation. Genome biology. 2011;12:1. doi: 10.1186/gb-2011-12-6-r60. [DOI] [PMC free article] [PubMed] [Google Scholar]
- 32.Buchfink B, Xie C, Huson DH. Fast and sensitive protein alignment using DIAMOND. Nature methods. 2015;12:59–60. doi: 10.1038/nmeth.3176. PMID:25402007 [DOI] [PubMed] [Google Scholar]
- 33.Oksanen J, Kindt R, Legendre P, O'Hara RB, Stevens HH, Oksanen MJ, & Suggests MASS. The vegan package. Community ecology package 2007;10:631–637. [Google Scholar]
- 34.Campbell JL, Eisemann JH, Williams CV, Glenn KM. Description of the gastrointestinal tract of five lemur species: Propithecus tattersalli, Propithecus verreauxi coquereli, Varecia variegata, Hapalemur griseus, and Lemur catta. American Journal of Primatology. 2000;52:133–42. doi: 10.1002/1098-2345(200011)52:3%3c133::AID-AJP2%3e3.0.CO;2-. PMID:11078027 [DOI] [PubMed] [Google Scholar]
- 35.Campbell JL, Williams CV, Eisemann JH. Characterizing gastrointestinal transit time in four lemur species using barium-impregnated polyethylene spheres (BIPS). Am J Primatol. 2004;64:309–21. doi: 10.1002/ajp.20080. PMID:15538763 [DOI] [PubMed] [Google Scholar]
- 36.Ganzhorn JU. Feeding behavior ofLemur catta andLemur fulvus. International journal of primatology. 1986;7:17–30. doi: 10.1007/BF02692307. [DOI] [Google Scholar]