

ABSTRACT
Background: Conditions of excess androgen in women, such as polycystic ovary syndrome (PCOS), often exhibit intergenerational transmission. One way in which the risk for PCOS may be increased in daughters of affected women is through exposure to elevated androgens in utero. Hyperandrogenemic conditions have serious health consequences, including increased risk for hypertension and cardiovascular disease. Recently, gut dysbiosis has been found to induce hypertension in rats, such that blood pressure can be normalized through fecal microbial transplant. Therefore, we hypothesized that the hypertension seen in PCOS has early origins in gut dysbiosis caused by in utero exposure to excess androgen. We investigated this hypothesis with a model of prenatal androgen (PNA) exposure and maternal hyperandrogenemia by single-injection of testosterone cypionate or sesame oil vehicle (VEH) to pregnant dams in late gestation. We then completed a gut microbiota and cardiometabolic profile of the adult female offspring.
Results: The metabolic assessment revealed that adult PNA rats had increased body weight and increased mRNA expression of adipokines: adipocyte binding protein 2, adiponectin, and leptin in inguinal white adipose tissue. Radiotelemetry analysis revealed hypertension with decreased heart rate in PNA animals. The fecal microbiota profile of PNA animals contained higher relative abundance of bacteria associated with steroid hormone synthesis, Nocardiaceae and Clostridiaceae, and lower abundance of Akkermansia, Bacteroides, Lactobacillus, Clostridium. The PNA animals also had an increased relative abundance of bacteria associated with biosynthesis and elongation of unsaturated short chain fatty acids (SCFAs).
Conclusions: We found that prenatal exposure to excess androgen negatively impacted cardiovascular function by increasing systolic and diastolic blood pressure and decreasing heart rate. Prenatal androgen was also associated with gut microbial dysbiosis and altered abundance of bacteria involved in metabolite production of short chain fatty acids. These results suggest that early-life exposure to hyperandrogenemia in daughters of women with PCOS may lead to long-term alterations in gut microbiota and cardiometabolic function.
KEYWORDS: androgens, blood pressure, cardiometabolic, cardiovascular disease, cystatin C, hypertension, hyperandrogenemia, kidney, PCOS, Microbiota, testosterone
Background
Exposure to androgens can have a powerful effect on a developing female fetus. In humans, placental aromatase deficiency or congenital adrenal hyperplasia can expose the fetus to excess endogenous androgens.1-5 In the case of gestational hyperandrogenemia, polycystic ovary syndrome (PCOS), gestational luteoma6, or hyperreactio luteinalis,7 the fetus may also be exposed to high levels of testosterone from the maternal circulation.8,9 Hyperandrogenism during pregnancy causes fetal virilization,10,11 intrauterine growth restriction,12 and low birth weight.13 These prenatal complications positively correlate with the development in adulthood of hyperinsulinemia14,15 and metabolic disorders such as obesity,16,17 hypertension,18 and PCOS.19,20 Similar findings of obesity, hyperleptinemia,21 and hyperinsulinemia (19) have been shown in rats and other animals exposed to excess androgens in utero.22
In rats, gestational days 10–20 are the equivalent of the second trimester of human pregnancy.23,24 During this period, testosterone peaks between days 17–19.25,26 Excess prenatal androgens (PNA) during this period induce a hypertensive phenotype in adulthood that is characterized by impaired blood flow in the vascular endothelium12, increased blood volume27, and increased blood pressure in adult females and males.28,29 However, the mechanism by which androgens induce this hypertension is not clear. Interestingly, studies of microbial transplantation have demonstrated that the microbiome affects blood pressure.30
The microbiome exhibits alterations in PCOS patients and in animal models of excess androgens. Recent studies have found that the profiles of bacterial abundance exhibit similarities between the orders Clostridales and Bacteroidales.22,31,32 Obese and non-obese women with PCOS had enriched Bacteroidetes and a decreased abundance of Akkermansia (of the phylum Verrucomicrobia), Alistipes, Corprococcus, and Ruminococcus.33 Akkermansia prevalence decreased in diet-induced obesity rats and was inversely correlated with peripheral inflammation in adipose tissue.34 Alistipes, a bile acid-tolerant bacteria from the genus Bacteroidetes, was decreased in letrozole-treated PCOS mice. In addition, abundance of Alistipes positively correlated with fecal levels of short-chain fatty acids (SCFAs)35−37, which are thought to reduce obesity and insulin resistance.38,39 Finally, a decrease in bacteria of the genus Coprococcus and Ruminococcus were both associated with activation of the hypothalamus-pituitary-adrenal axis and stress-induced depression.40,41
Recent evidence also suggests that these microbial alterations may drive some of the metabolic derangements associated with PCOS. In an aromatase inhibitor-induced PCOS model, fecal microbial transplant from control animals alleviated symptoms associated with androgenization such as acyclicity, weight gain, and hyperleptinemia in adult rats.42 Therefore, understanding the origins of dysbiosis in PCOS may be crucial to preventing and treating this disorder.
How and when the changes in the microbiota occur in hyperandrogenemic states is currently unknown. Previous studies have found that colonization of the gut microbiota begins in utero43, although growth of bacterial populations that dominate during adulthood begins within a few days after birth.44 Further bacterial divergence occurs after puberty, suggesting that hormonal milieu can influence the microbiome. Interestingly, microbial transplantation of male cecum gut flora to females increases serum testosterone levels in both sham and ovariectomized females.45 Based on these accumulated findings, we hypothesize that the hypertension seen in PCOS has early origins in dysbiosis caused by in utero exposure to androgen excess. As a first step to testing this hypothesis, we examined whether in utero exposure to maternal hyperandrogenemia can persistently alter the microbiome of female rat offspring and lead to hypertension in adulthood.
Materials and methods
Animals
Male and female Wistar rats (approximately 11–12 weeks of age) were purchased from Charles River Laboratories and housed within the Department of Laboratory Animal Resources Facility of the University of Toledo College of Medicine and Life Sciences, Toledo, Ohio, USA. The animals were on a 12-hr light-dark room schedule and fed ad libitum. Female rats were paired with males for two days and separated. Pregnancy was determined by identification of a vaginal plug; that day was designated gestational day 1. The method for prenatal androgen exposure model is described in previous studies.20 Briefly, pregnant dams were subcutaneously injected on gestational day 20 under isoflurane with 5mg/kg of body weight with testosterone cypionate (Sigma-Aldrich) in sesame oil or vehicle (sesame oil only). A schematic of the experimental design and animal timeline can be found in Fig. 1. Only female offspring were used for metabolic, cardiovascular, and gut microbiota profile studies.
Figure 1.
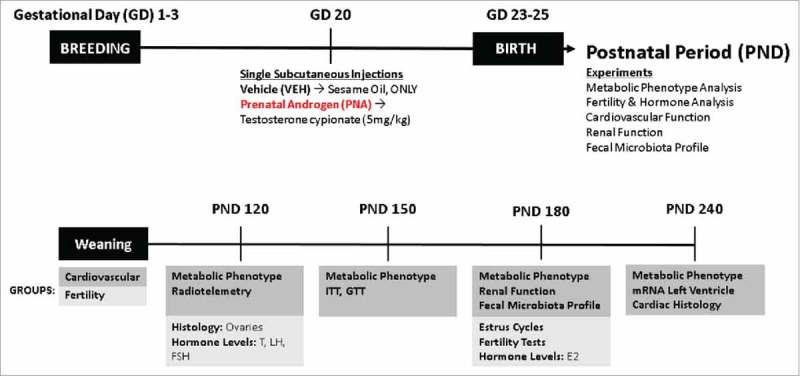
Schematic of Experimental Design and Animal Timeline. The animals were separated into two experimental cohorts: cardiovascular and fertility. The cardiovascular cohort experiments were performed from PND 120 to PND 240. Metabolic phenotype includes monthly body weight measurements, fecal sample collection at PND 120 (VEH = 10, PNA = 10), insulin tolerance tests (ITT), and glucose tolerance tests (GTT) (VEH = 12, PNA = 10). Cardiovascular function included Radiotelemetry performed at PND 120 (VEH = 12, PNA = 10), mRNA of the left ventricle of the heart at PND 240 and cardiac histology for assessment of cardiac hypertrophy (VEH = 4, PNA = 4). Renal function included serum and urine assays performed at PND 180 (VEH = 10, PNA = 10). The fertility cohort experiments were performed at PND 120 and PND 180. These experiments included ovarian histology at PND 120 and serum hormone analysis of testosterone (T), luteinizing hormone (LH), and follicle-stimulating hormone (FSH) (VEH = 12, PNA = 10). At PND 180, serum was collected for hormone levels of estradiol (E2), vaginal cytology was collected for assessment of estrus cycles (VEH = 12, PNA = 10). Finally, fertility tests were performed to determine pregnancy rates (VEH = 14, PNA = 8).
Metabolic phenotype assessment
Glucose tolerance tests (GTT) and Insulin tolerance tests (ITT) were performed at PND120 (VEH, n = 7; PNA, n = 7) as previously described.46,47 Body weight was measured monthly from PND120 to PND240 (VEH, n = 12; PNA, n = 10).
Cardiac histology
For animals used in cardiac histology and gene expression analyses, sacrifice occurred at PND 240 (VEH, n = 4; PNA, n = 4). Hearts were removed and weighed immediately after sacrifice. The heart was then cut on the short-axis exposing the right ventricle, left ventricle, and papillary muscles and then placed into 10% formalin for 24 hours and 70% ethanol before embedding into paraffin blocks and sectioning at a thickness of 5–7 microns. The sections were then stained with hematoxylin, eosin, and Masson's Trichrome. All photographs were taken at 4X magnification with a Bio-Tek Cytation 5 automated microscope (Bio-Tek, Winooski, Vermont, USA) provided by The University of Toledo Advanced Microscopy & Imaging Center (Toledo, Ohio, USA). Quantitation was performed using Image J Image Processing and Analysis.48
Radiotelemetry
Radiotelemetry transmitter implantation surgeries were performed on PND 120 (VEH, n = 12; PNA, n = 10) female rats as previously described.49,50 Briefly, the animals were surgically implanted with a radiotelemetry transmitter (Data Sciences International, St. Paul, Minnesota, USA) through the femoral artery. The device was further advanced through to the lower abdominal aorta. The animals were left undisturbed for four days in singly-housed cages before data collection began. Systolic blood pressure, diastolic blood pressure, mean arterial pressure, and heart rate were collected using a moving average every hour for 40 hours.
Hormone analysis
Serum was collected from PND120 animals for hormone level analysis by testosterone ELISA (Calbiotech, El Cajon, California, USA, #TE187S-100) and PND180 animals for hormone level analysis of estradiol (Calbiotech, El Cajon, California, USA, #ES180S-100) as previously described.51 Follicle stimulating hormone and luteinizing hormone were measured in serum at PND180 using the Millipore Pituitary Panel Multiplex kit by The Ligand Assay & Analysis Core of the Center for Research in Reproduction at The University of Virginia School of Medicine.
Fertility assessment
Vehicle and PNA animals were paired with males for four days and separated. The sight of a vaginal plug was designated Gestational Day 1. After 13–15 days of gestation, pregnancy was confirmed by palpation of abdominal region of pregnant dams. Animals were allowed to give birth and the pups were counted and sacrificed. Successful pregnancy was defined by the delivery of pups while unsuccessful/failed pregnancies were defined by the sighting of a vaginal plug but no presence of fetal pups at gestational day 13–15 with palpation or no delivery after 23–25 days of gestation.
Quantitative RT-PCR (qRT-PCR)
Approximately 15 mg of frozen left ventricle, ovarian tissue, inguinal white adipose tissue, and interscapular brown adipose tissue were separately homogenized in Trizol Lysis Reagent with the Qiagen TissueLyserLT. RNA was extracted using the Qiagen RNeasy Mini Kit and nucleic acid concentration was quantified with the NanoDrop 2000 spectrophotometer (Thermo Fisher Scientific, Wilmington, DE). cDNA was synthesized with the High-Capacity cDNA Reverse Transcription Kit (Cat No. #: 4368814, Applied Biosystems). The following thermal-cycling settings were used: Step 1: 25°C for 10 minutes, Step 2: 37°C for 120 minutes, Step 3: 85°C for 5 minutes, and Step 4: 4°C for no more than 1 hour. After thermal-cycling, the sample was diluted with 80 µL of RNAse-Free dH2O and frozen at −20°C until further analysis with qRT-PCR. PCR amplification of cDNA was performed by quantitative RT-PCR with the TrueAmp SYBR Green qPCR SuperMix (Smart Bioscience, Maumee, OH). The sequences of primers used for qRT-PCR experiments are listed in Table 1.
Table 1.
Quantitative real-time PCR primers.
| Gene | Forward (5′>3′) | Reverse (5′>3′) | Reference |
|---|---|---|---|
| 18S | GAGGTGAAATTCTTGGACCGG | CGAACCTCCGACTTTCGTTCT | 52 |
| aP2 | AGCGTAGAAGGGGACTTGGT | ATGGTGGTCGACTTTCCATC | 53 |
| AdipoQ | GGGAGACGCAGGTGTTCTTG | CTGAATGCTGAGTGATACATGTAAGC | 54 |
| AR | CCCATCGACTATTACTTCCC | TTACGAGCTCCCAGAGTCAT | 55 |
| ANP | GCCGGTAGAAGATGAGGTCA | GGGCTCCAATCCTGTCAATC | 56 |
| BNP | ATCTGTCGCCGCTGGGAGGT | GGATCCGGAAGGCGCTGTC | 56 |
| ERα | GGCTACGTCAAGTCGATTCC | ATCTTGTCCAGGACTCGGTG | 57 |
| ERβ | CTCACGTCAGGCACATCAGT | TGTGAGCATTCAGCATCTCC | 58 |
| Lep | AGACCATTGTCACCAGGATCAAT | CCCGGGAATGAAGTCCAAA | 59 |
| PKCδ | ACAGAAGAAGCCCACCAT | GAACTCAGCCTTCCCGTT | 60 |
| Ren | ATGCCTCTCTGGGCACTCTT | GTCAAACTTGGCCAGCATGA | 61 |
18S, Ribosomal 18S; aP2, adipocyte binding protein 2; AdipoQ, adiponectin; AR, Androgen receptor; ANP, Atrial natriuretic peptide; BNP,; ERα,; ERβ, Estrogen receptor beta; PKCδ, Protein kinase C delta; and Ren, Renin.
Fecal sample collection
Fresh fecal samples were collected at PND240 and stored in −80°C.
DNA Extraction and Quantification
Fecal samples (n = 20) were shipped to Wright Labs, LLC. Nucleic acid extractions were performed on approximately 0.25 g of each sample using a MoBio Powerfecal DNA Isolation kit following the manufacturer's instructions (MoBio Carlsbad, California, USA). The vortexing step was performed using the Disruptor Genie cell disruptor (Scientific Industries, Bohemia, NY). The resulting genomic DNA was eluted in 50 µl of 10 mM Tris. The Qubit 2.0 (Invitrogen) Fluorometer according to the Protocol of the dsDNA High Sensitivity option was then utilized to quantify total DNA.
16S rRNA Gene PCR Amplification
Illumina iTag Polymerase Chain Reactions (PCR) were performed at a total volume of 25 μL for each sample and contained final concentrations of 1X PCR buffer, 0.8 mM dNTP's, 0.625 U Taq, 0.2 μM 515F forward primer, 0.2 μM Illumina 806R reverse barcoded primer and ∼10 ng of template DNA per reaction. PCR was carried out on a MJ Research PTC-200 thermocycler (Bio-Rad, Hercules, California, USA) using the following cycling conditions: 98 °C for 3 min; 35 cycles of 98 °C for 1 min, 55 °C for 40 s, and 72 °C for 1 min; 72 °C for 10 min; and kept at 4 °C. PCR products were visualized on a 1% CYBRsafe E-gel.62
Library purification, verification, and sequencing
Pooled PCR products were gel purified using the Qiagen Gel Purification Kit (Qiagen, Frederick, Maryland, USA). Clean PCR products were quantified using the Qubit 2.0 Fluorometer (Life Technologies, Carlsbad, CA), and samples were combined in equimolar amounts. Prior to submission for sequencing, libraries were quality checked using the 2100 Bioanalyzer DNA 1000 chip (Agilent Technologies, Santa Clara, CA). Pooled libraries were stored at −20 °C until they were shipped on dry ice to the California State University (North Ridge, CA) for sequencing. Library pools were size verified using the Fragment Analyzer CE (Advanced Analytical Technologies Inc., Ames IA) and quantified using the Qubit High Sensitivity dsDNA kit (Life Technologies, Carlsbad, CA). After dilution to a final concentration of 1 nM and a 10% spike of PhiX V3 library (Illumina, San Diego CA), pools were denatured for 5 minutes in an equal volume of 0.1 N NaOH, then further diluted to 12 pM in Illumina's HT1 buffer. The denatured and PhiX-spiked 12 pM pool was loaded on an Illumina MiSeq V2 500 cycle kit cassette with 16S rRNA library sequencing primers and set for 250 base, paired-end reads.
Quality filtering and operational taxonomic unit (OTU) selection
Paired-end sequences were trimmed at a length of 250 bp and quality filtered at an expected error of less than 0.5% using USEARCH v7.63 After quality filtering, reads were analyzed using the QIIME 1.9.0 software package ([62, 64]. Chimeric sequences were identified using USEARCH61.65 A total of 680,091 sequences were obtained after quality filtering and chimera checking. Open reference operational taxonomic units (OTUs) were picked using the USEARCH61 algorithm, and taxonomy assignment was performed using the Greengenes 16S rRNA gene database (13–5 release, 97%).66 Assigned taxonomy were organized into a BIOM formatted OTU table and summarized within QIIME 1.9.0.
Alpha diversity analysis
Alpha diversity plots were generated within the Phyloseq sequence analysis package using a rarified OTU table.67 Rarefaction was conducted on sequences across all samples to a maximum depth of 20,923 sequences. Alpha diversities were then collated and plotted using observed species richness.
Beta diversity analysis
Principal coordinates analyses (PCoA) plots and ANOSIM tests for significance were generated from a weighted UniFrac distance matrix made within QIIME 1.9.0 from a CSS normalized OTU table.68
Taxonomic comparisons
Assigned taxonomy were organized into a BIOM formatted OTU table and were summarized within Qiime-1.
LefSe analysis of enriched taxa
Relative abundances of taxa were multiplied by 1 million and formatted.69 Comparisons were made with “Sample Type” as the main categorical variable (“Class”). Alpha levels of 0.01 were used for both the Kruskal–Wallis and pairwise Wilcoxon tests. Linear Discriminant Analysis (LDA) scores greater than 3.0 are displayed.
Predictive functional analysis
PICRUSt functional predictions were generated from a closed-reference OTU table generated within QIIME-1.9.0. Relative abundances of predicted functional genes were multiplied by 1 million and formatted.69 Comparisons were made with “Group” as the main categorical variable (“Class”). Alpha levels of 0.05 were used for both the Kruskal–Wallis and pairwise Wilcoxon tests. Linear Discriminant Analysis (LDA) scores greater than 2.0 are displayed.
Principal coordinates analysis (PCoA) plots
Principal Coordinates Analysis (PCoA) plots were used to visualize differences in weighted Unifrac distances of fecal samples from PNA (P) and VEH (V) cohorts. Points clustered more closely together are more similar in terms of phylogenetic distance, whereas points that are distant from each other are phylogenetically distinct. Samples cluster significantly based on their specific grouping (ANOSIM p = 0.002).
Relative abundance graphs
Taxonomic relative abundance graphs were prepared using operational taxonomic units and classification of microbiome populations into respective taxonomic phyla, order, family, and genus. Graphs were then prepared in GraphPad Prism 7 using relative abundance percentage of bacteria within control and prenatal androgen (PNA) groups.
Statistical analysis
All graphs were created with GraphPad Prism 7 (GraphPad Software, San Diego, CA). Data is reported as the mean and standard error of the mean. Data were analyzed using student's t-test for statistical significance and reported as follows: p ≤ 0.05 (*), ≤ 0.01 (**), and ≤ 0.001 (***).
Results
We first tested whether PNA treatment induced metabolic dysfunction in adulthood. Between PND 120 to PND 240, the body weight of the PNA animals was significantly higher than in control animals (Fig. 2a). After observing increased body weight, we investigated glucose and insulin sensitivity with glucose (GTT) and insulin tolerance tests (ITT). Insulin tolerance testing (ITT) revealed higher plasma glucose levels at 30 minutes and 60 minutes after intraperitoneal injection of insulin in the PNA animals, suggesting some degree of insulin resistance (Fig. 2b). Glucose clearance was not impaired in the PNA rats (Fig. 2c). However, the increased body weight within the PNA animal group led us to question whether there was differential mRNA expression of adipokines within the peripheral adipose tissue depots of the interscapular brown adipose tissue (iBAT) and inguinal white adipose tissue (iWAT) (Fig. 2f–k). We found significantly increased mRNA expression of adipocyte binding protein 2 (ap2), adiponectin (AdipoQ), and leptin (Lep) within the iWAT of the PNA animals, but similar expression of the markers within iBAT.
Figure 2.
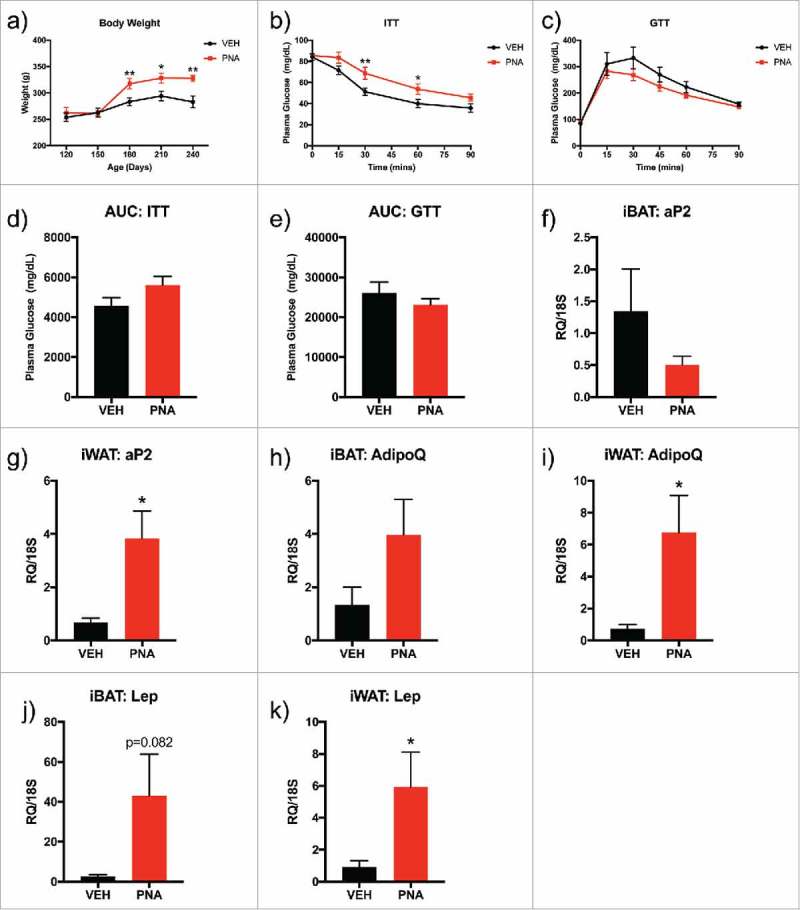
Metabolic Assessment: Body Composition, Glucose and Insulin Tolerance Tests, mRNA Expression of Adipokines within Adipose Tissue. (a) Body weight was measured from PND 120 to PND 240. (b) Glucose tolerance test (GTT) was performed at PND150 with intraperitoneal injection (IP) of dextrose and plasma glucose levels were recorded for time 0 to 120 minutes. (c) Insulin tolerance test (ITT) was performed at PND150 with IP injection of insulin and plasma glucose levels were recorded for time 0 to 90 minutes. (d) Area under the curve (AUC) for GTT was calculated for all plasma glucose levels between 0–120 minutes (e) Area under the curve (AUC) for ITT was calculated for all plasma glucose levels between 0–90 minutes. Bars represent mean and lines represent standard error (SEM); (f) iBAT aP2 mRNA expression, g) iWAT aP2 mRNA expression, (h) ibAT AdipoQ mRNA expression, (i) iWAT AdipoQ mRNA expression, (j) iBAT Lep mRNA expression, (k) iWAT Lep mRNA expression. The tissue was dissected from sacrificed animals at PND120 and the sample size was n = 6–7 animals per group (VEH or PNA). Bars represent means and the lines represent the standard error of the mean (SEM). Symbols in either black (VEH) or red (PNA) represent the distribution of relative expression (RQ) values within each group. All genes were normalized to the RQ of 18S.
We next tested whether PNA treatment induced reproductive dysfunction in adulthood. We found that early androgenization reduced the number of primordial, preovulatory, and the overall number of follicles within the ovaries of the PNA animals (Fig. 3a–c). Over a period of nine days, the PNA animals spent a significantly longer duration within the metestrus/diestrus stage of the estrus cycle (Fig. 3d–e) and a shorter period in estrus (Fig. 3f). There were no differences in time spent in proestrus. However, the PNA animals had a significantly lower pregnancy success rate after being paired with males for four days. Approximately 13% (VEH, n = 14; PNA, n = 8) of the PNA animals became pregnant compared to 57% of the vehicle animals (Fig. 3g). Previous reports have found altered reproductive hormone levels in this model between PND 75-PND 90.20 In our animals, we found no difference in the serum estradiol (Fig. 3h), testosterone (Fig. 3i), or FSH levels (Fig. 3j) of the VEH and PNA animals. Surprisingly, while the ratio of LH to FSH was unaltered, serum LH levels were significantly lower in the PNA animals (Fig. 3k).
Figure 3.
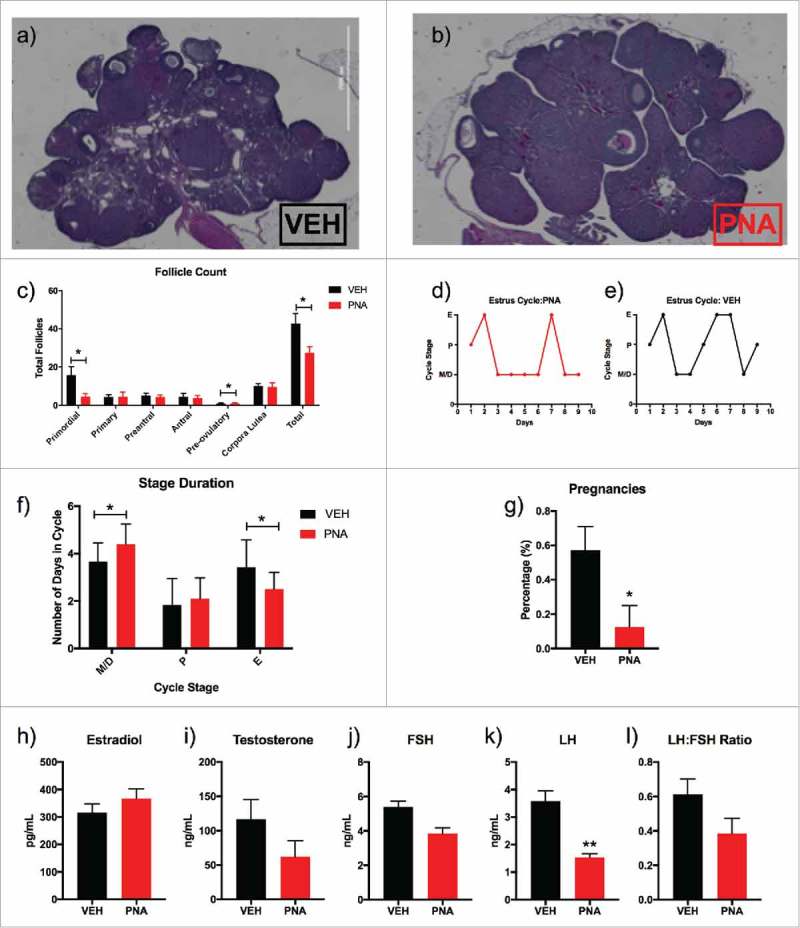
Fertility and Serum Hormone Analysis. (a) Hematoxylin and eosin stained ovary of female vehicle rat at PND 120; (b) Hematoxylin and eosin stained ovary of female PNA rat at PND 120; (c) Total follicle count of primordial, primary, preantral, antral, preovulatory, corpora lutea, and total follicle count; (d) Estrous cycle data for nine consecutive days of vaginal smearing of vehicle (n = 12) rats; (e) Estrous cycle data for nine consecutive days of vaginal smearing of and prenatal androgen rats (n = 11); (f) Duration of estrus cycle and number of days spent in each stage for PNA animals compared to vehicle; (g) Pregnancy success rates for vehicle (n = 14) and PNA (n = 8) rats at PND 180; (h) Serum beta-estradiol levels for VEH and PNA animals measured in picograms per milliliter at PND 180; (i) Serum testosterone levels for VEH and PNA animals measured in nanograms per milliliter at PND 120; (j) Serum follicle stimulating hormone (FSH) levels for VEH and PNA animals measured in nanograms per milliliter in animals at PND 180; (k) Serum luteinizing hormone (LH) levels for VEH and PNA animals measured in nanograms per milliliter in animals at PND 180; and (l) LH:FSH ratio measured for animals at PND 180.
Given reports of increased hypertension rates in obese women with PCOS18,70, we examined blood pressure in this model. Telemetry revealed that blood pressure was increased in PNA animals. Overall, systolic, diastolic and mean arterial blood pressures were higher in the PNA rats, particularly at night (Fig. 4a–c). Interestingly, heart rate was decreased in both day and night recording obtained from the PNA rats compared to the VEH group (Fig 4d). The BPM was significantly decreased between hour 8–12, and from hour 20–28 for the PNA rats. The heart rate was 440 ± 31 BPM for the vehicle group and 406 ± 25 BPM (Fig. 4d). Mean locomotor activity was also significantly reduced within the PNA animal group (Fig. 4e). Despite the lower heart rates, the increases observed in blood pressure in the PNA group are notable. The overall increased systolic and diastolic blood pressure places the PNA animals in the range of uncomplicated stage I hypertension (between 140/90 to 150/99 mmHg).71,72
Figure 4.
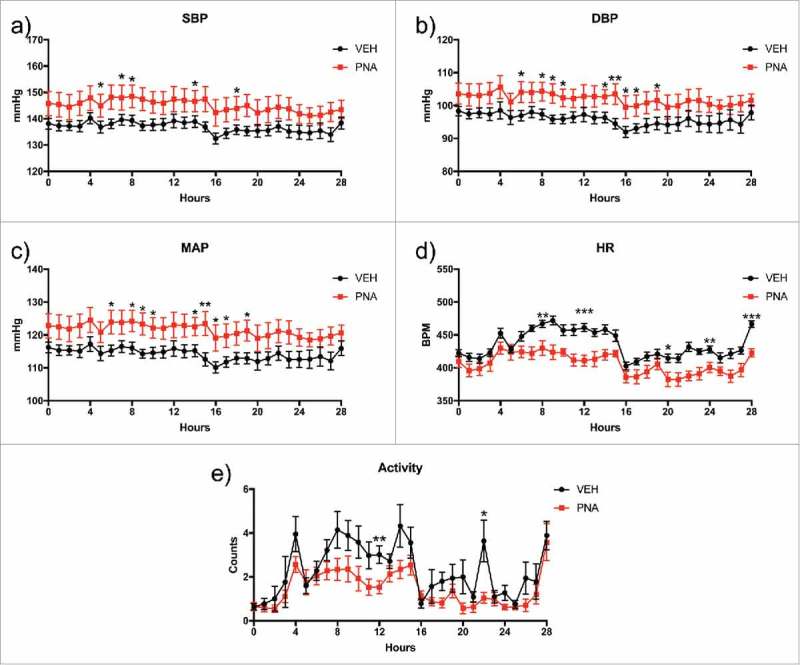
Radiotelemetry Blood Pressure, Heart Rate, and Locomotor Activity. Radiotelemetry analysis was performed for moving averages every hour for 28 hours with standard error calculated for each hour. The shaded areas on the graph represent night hours. (a) Systolic blood pressure (SBP), (b) diastolic blood pressure (DBP), (c) Mean arterial pressure (MAP), (d) heart rate (BPM), and (e) locomotor activity.
PNA animals showed significantly increased thickness of left ventricle (LV) anterior muscle wall (Fig. 5a), posterior muscle wall (Fig. 5b), and decreased left ventricle CSA (Fig. 5c). There were no differences observed in the wall thickness of the right ventricle between the inner endocardium and the outer epicardium (Fig. 5d–e). Masson's Trichrome staining of the short axis view of the rat hearts with angulation revealed the right ventricle, left ventricle, and papillary muscles (Fig. 5g, 5h) which allowed for measurements of the wall thickness and cross-sectional area. Next, we performed quantitative RT-PCR experiments to test for mRNA expression of sex steroid receptors and biomarkers of cardiovascular health to confirm if there was differential expression of markers associated with the development of cardiac hypertrophy and hypertension.56,60,73,74 Androgen receptor (Fig. 6a) mRNA expression was upregulated in the left ventricle of the PNA hearts while ERα and ERβ expression (Fig. 6b–c) was not significantly different in expression levels. ANP and BNP were not increased in the left ventricle of the PNA animals (Fig. 6d–e). However, mRNA expression of renin (REN) was increased in the left ventricle of PNA animals (Fig. 6f).
Figure 5.
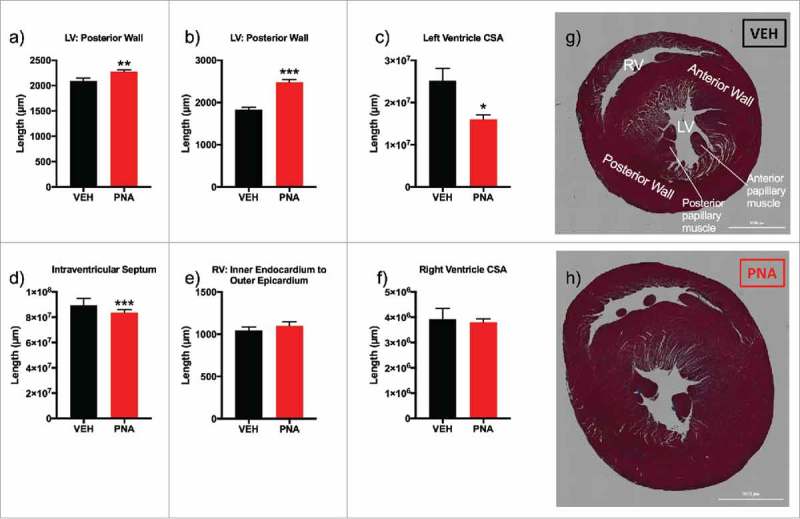
Cardiac morphology and gross anatomical measurements. (a) left ventricle (LV) anterior muscle wall; (b) LV posterior muscle wall; (c) left ventricle cross sectional area (CSA); (d) intraventricular septum (e) right ventricle (RV) inner endocardium to outer epicardium measurement; (f) right ventricle cross sectional area (CSA); (g) Masson's trichrome stain of short-axis cut with angulation to expose left ventricle papillary muscles and apex of right ventricle (RV) of VEH female rat; (h) Masson's trichrome stain of short-axis cut of heart with angulation to expose left ventricle papillary muscles and apex of right ventricle of PNA female rat.
Figure 6.
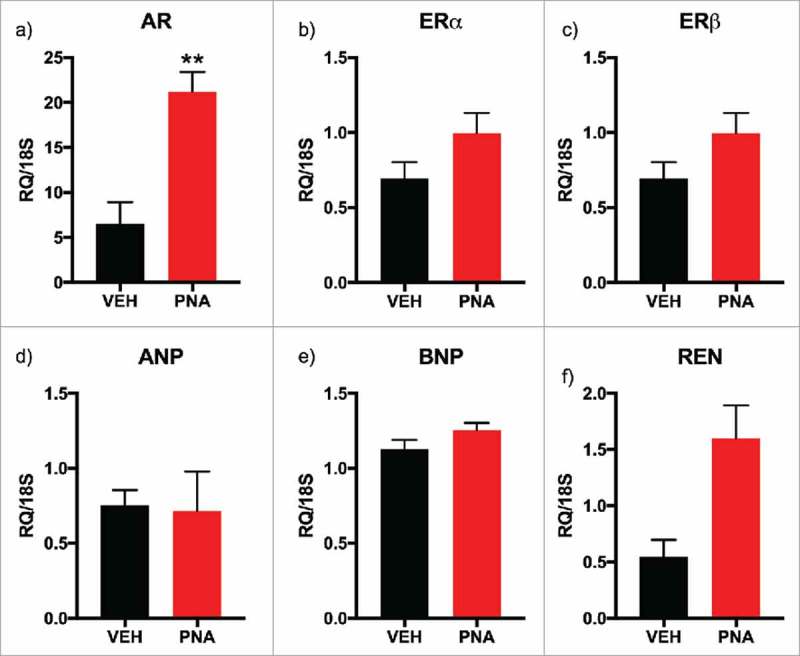
mRNA Expression of Sex Steroid Receptors, Cardiac Hypertrophy Markers, and Renin within Left Ventricle (LV) of the Heart. (a) AR, androgen receptor mRNA expression; (b) ERα, estrogen receptor alpha mRNA expression; (c) ERβ, estrogen receptor beta mRNA expression; (d) ANP, atrial naturetic protein mRNA expression; (e) BNP, B-type (brain) naturetic protein mRNA expression; (f) Ren, renin mRNA expression. All genes were normalized to 18S expression. All bars represent the mean values of relative expression (RQ) and lines represent standard error of the mean.
Kidney weight, urine output, urine microalbumin levels were similar between vehicle and PNA animals (Fig. 7a–c). However, we found decreased creatinine levels in urine (Fig. 7d). Measurement of the microalbumin to creatinine ratio (p = 0.070), and serum cystatin C (p = 0.057) appeared higher in the PNA animals, but did not reach significance (Fig. 7e–f). These findings suggested an early-stage, impaired glomerular filtration.
Figure 7.
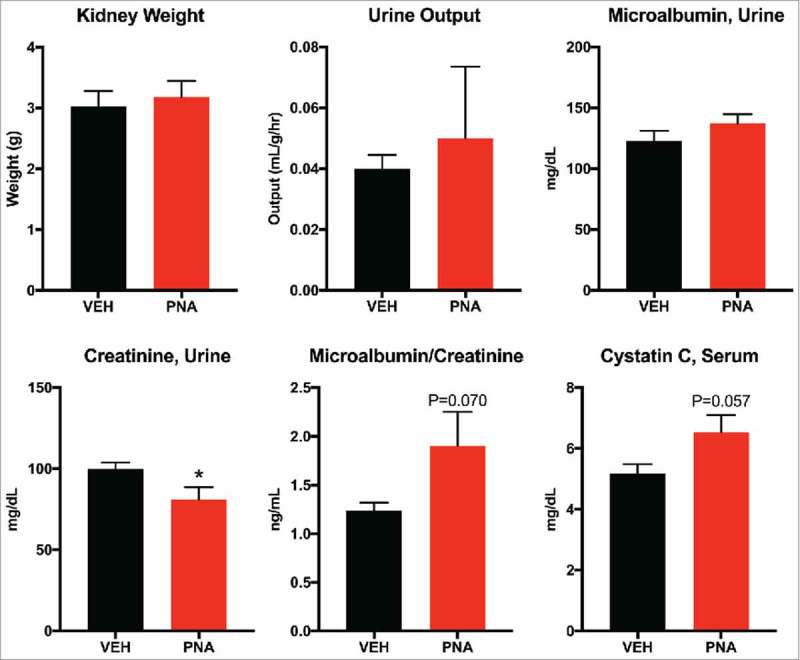
Renal Function Assessment of Serum Cystatin C and Urine Microalbumin and Creatinine. (a) paired kidney weight was measured immediately after dissection. (b) urine output was calculated from 24-hour urine volume in milliliters divided by body weight in grams, divided by 24-hours. (c) urine creatinine was measured from 24-hour fasting urine. (d) microalbumin was measured from 24-hour fasting urine. (e) microalbumin/creatinine ratio. (f) cystatin C concentration was measured using serum collected from PND180 animals.
Having established cardiometabolic dysfunction in our model, we looked for evidence of microbiome alterations using fecal samples obtained at PND 180. A profile of the fecal microbiota was produced at the phyla, order, family, and genus level for over 33,000 sequences found within the vehicle and PNA group after quality filtering of 20,923 to 64,164 sequences per sample. Each sample had a sequencing depth of over 1,000 sequences and were organized into CSS Normalized Operational Taxonomic Unit (OTU) Tables that included known information for kingdom, phylum, class, order, family, and genus. This information was then used to determine the total number of OTUs found within each sample at the various levels of classification and relative abundances was reported in percentages. We found the top 10 most abundant phyla were Actinobacteria, Bacteroidetes, Firmicutes, Proteobacteria, Verrucomicrobia, Tenericutes, Fusobacteria, Planctomycetes, Nitrospirae, and Spirochaetes (Supplemental Table 1). Bacteria found within the phyla Verrucomicrobia (V, 0.38%; P, 8.30%; p = 0.001) Proteobacteria (V, 2.63%; P, 5.29%; p = 0.044), and Planctomycetes (V, 0.00%; P, 0.06%; p = 0.002) were significantly enriched within the fecal microbiota of the PNA rats. Bacteria found within the phyla Fusobacteria (V, 0.53%; P, 0.26%; p = 0.005) and Spirochaetes (V, 0.03%; P, 0.02%; p = 0.042) were significantly decreased while there were no differences found in bacteria at the phylum level for Firmicutes, Bacteroidetes, Actinobacteria, Tenericutes, and Nitrospirae.
After we determined the most abundant phyla, we focused our subsequent analysis on the relative abundances of bacteria found within Actinobacteria (Fig. 8a), Bacteroidetes (Fig. 8b), Firmicutes (Fig. 8c), Proteobacteria (Fig. 8d), Verrucomicrobia (Fig. 8e).
Figure 8.
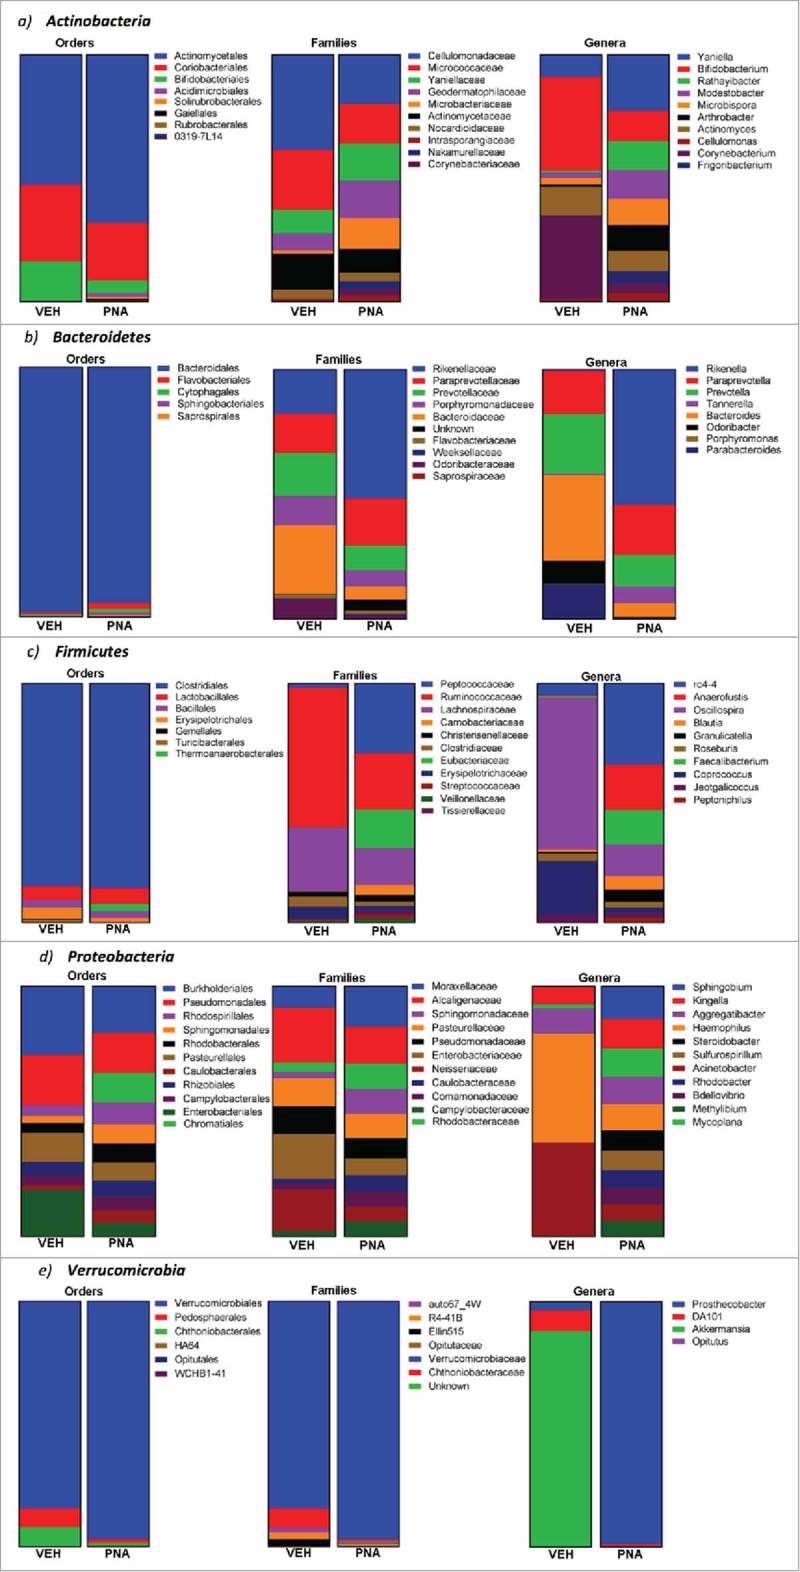
Relative abundance of bacteria within the most abundance phylum: Actinobacteria, Bacteroidetes, Firmicutes, Proteobacteria, and Verrucomicrobia. Relative abundance of bacteria at the phylum, order, family and genera levels were determined using operational taxonomic units for each. The graphs represent the percentages for the relative abundance of bacteria from the total OTU of each phylum, order, family, or genera.
Actinobacteria
Bifidobacteriales was the only order that was significantly reduced within the PNA animals (Fig. 8a, Supplementary Table 2). At the family level, bacteria from Yaniellaceae, Geodermatophilaceae, Microbacteriaceae, Nakamurellaceae, Corynebacteriaceae, Promicromonosporaceae, and Nocardiaceae were significantly enriched within the PNA animal fecal microbiota. Bacteria from Brevibacteriaceae and Dermabacteraceae were significantly decreased within the PNA fecal microbiota. At the genus level, bacteria from Yaniella, Rathayibacter, Modestobacter, Microbispora, Arthrobacter, Frigoribacterium, Cellulomonas, Aeromicrobium, Xylanimicrobium, and Rhodococcus were significantly enriched within the PNA animal fecal microbiota. Bacteria from Bifidobacterium, Corynebacterium, Brevibacterium, Brachybacterium, Adlercreutzia, and Rothia were significantly decreased within the PNA fecal microbiota.
Bacteroidetes
There were no significant differences observed within the relative abundance of bacteria from the orders Bacteroidales, Flavobacteriales, Cytophagales, Sphingobacteriales, and Saprospirales in the PNA animal fecal microbiota profile (Fig. 8b, Supplementary Table 3). We then further analyzed the individual families within each order to determine if there was differential abundance of bacteria. We found that at the family level, bacteria from Rikenellaceae, Paraprevotellaceae, and an unknown family within Bacteroidetes were significantly enriched within the PNA group fecal microbiota. Bacteria from Bacteroidaceae, Odoribacteraceae, and S24-7 were significantly decreased. At the genus level, bacteria from Rikenella, Paraprevotella, and Tannerella were significantly enriched within the PNA animal fecal microbiota. Bacteria from Bacteroides, Odoribacter, and Parabacteroides were significantly decreased within the PNA fecal microbiota.
Firmicutes
At the order level, bacteria from Thermoanaerobacterales were significantly enriched and Erysipelotrichales and Turicibacterales were significantly decreased within the PNA fecal microbiota (Fig. 8c, Supplementary Table 4). At the family level, bacteria from Peptococcaceae, Eubacteriaceae, Carnobacteriaceae, Tissierellaceae, Streptococcaceae, Veillonellaceae, Coprobacillus, and Leuconostocaceae were significantly enriched within the PNA animal fecal microbiota. Bacteria from Ruminococcaceae, Lachnospiraceae, Clostridiaceae, Erysipelotrichaceae, Dehalobacteriaceae, Lactobacillaceae, and Mogibacteriaceae were significantly decreased within the PNA fecal microbiota. At the genus level, bacteria from RC4-4, Anaerofustis, Faecalibacterium, Blautia, Granulicatella, Roseburia, Jeotgalicoccus, Peptoniphilus, Veillonella, Streptococcus, Oribacterium, Sporosarcina, Lactococcus, Selenomonas, Weissella, and Exiguobacterium were significantly enriched within the PNA animal fecal microbiota. Bacteria from Ruminococcus, Staphylococcus, Clostridium, Facklamia, Dehalobacterium, Lactobacillus, and Dorea were significantly decreased within the PNA fecal microbiota.
Proteobacteria
At the order level, bacteria from Chromatiales, Rhodospirillales, Sphingomonadales, Rhodobacterales, Caulobacterales, BD7-3, Rickettsiales, MIZ46, Legionellales, Alteromonadales, and an unknown order within the phylum Proteobacteria were significantly enriched within the PNA animal fecal microbiota (Fig. 8d, Supplementary Table 5). Bacteria from Burkholderiales, Pseudomonadales, Enterobacteriales, and Neisseriales were significantly decreased within the PNA fecal microbiota. At the family level, bacteria from Moraxellaceae, Rhodobacteraceae, Sphingomonadaceae, Caulobacteraceae, Comamonadaceae, Sinobacteraceae, Rhodospirillaceae, Piscirickettsiaceae, Hyphomicrobiaceae, and Coxiellaceae were significantly enriched within the PNA animal fecal microbiota. Bacteria from Enterobacteriaceae and Neisseriaceae were significantly decreased within the PNA fecal microbiota. At the genus level, bacteria from Sphingobium, Kingella, Mycoplana, Aggregatibacter, Steroidobacter, Methylibium, Buchnera, Bilophila, and Arcobacter were significantly enriched within the PNA animal fecal microbiota. Bacteria from Sutterella, Neisseria, and Pseudomonas were significantly decreased within the PNA fecal microbiota.
Verrucomicrobia
At the order level, bacteria from Verrucomicrobiales were significantly enriched within the PNA animal fecal microbiota (Fig. 8e, Supplementary Table 6). At the family level, bacteria from Verrucomicrobiaceae were significantly enriched within the PNA animal fecal microbiota. At the genus level, bacteria from Prosthecobacter were significantly enriched within the PNA animal fecal microbiota. Bacteria from Akkermansia were significantly decreased within the PNA fecal microbiota.
As the next step towards understanding whether dysbiosis contributes to the PCOS-like phenotype of these animals, we analyzed the potential function of bacteria found in their gut (Supplemental Table 7). A predictive function analysis associates microbiome bacteria and bacterial enzyme metabolites with a general function or disease. The values for each group are the average operation taxonomic units (OTU) and are derived from different bacteria classified into order, family, or genus based on their similarity.75 The predictive functional analysis revealed that the dysbiosis seen in prenatal androgen exposed animals was associated with adipokine production, prostaglandin activity, gastric mucosal secretion, and signaling pathways of growth factors recruited for cell proliferation and activity of epithelial cells throughout the gastrointestinal tract. PNA animals had an increased number of bacteria associated with overall amino acid (AA) metabolism, especially increased beta-alanine, arginine, proline, lysine, phenylalanine, and tryptophan metabolism.
Alpha diversity analysis (Supplemental Figure 2a) was performed utilizing Phyloseq sequence analysis on the samples to determine the species richness and evenness, or number of bacterial species within the fecal sample and the distribution of bacterial taxonomy, respectively.76 Alpha diversity revealed that the PNA animals had a higher average of species richness. Beta diversity analysis (Supplemental Figure 2b) was performed utilizing principal coordinate analyses plots to illustrate the phylogenetic distance of the bacterial communities of the fecal samples. The beta diversity analysis revealed that both cohorts had distinct clustering, however the PNA animal samples were further apart.
Discussion
Androgen excess disorders like PCOS affect between 5–20% of reproductive age women worldwide.42,77 PCOS has been linked to metabolic syndrome particularly insulin resistance78 and hypertension.79−82 When a pregnant mother with PCOS is subsequently diagnosed with hyperinsulinemia, hypertension, or hyperandrogenemia during pregnancy this increases maternal and fetal morbidity and mortality.83−85 The likelihood of developing obstetric complications during pregnancy such as gestational diabetes, preeclampsia, and early termination of pregnancy increase.86−89 While the etiology of metabolic derangement in PCOS women and their offspring is not well understood, this study describes a profile of cardiometabolic dysfunction that is associated with gut microbiota dysbiosis in offspring exposed to androgens prenatally.
Exposure to androgens in utero can cause reproductive consequences for the female human fetus depending on the extent of the exposure.90,91 In the male human fetus, testosterone production by the testis is detectable at 9 weeks and peaks between 12 to 14 weeks.92 Testosterone (T) levels then fall sharply, so that by the 20th week the fetal serum testosterone is back to sexually indifferent levels. In contrast, the female gonads produce few sex steroids during development. T-levels present up through the 14th week will masculinize the reproductive organs. High levels of T throughout the critical period will masculinize basal LH release during adulthood and eliminate the ability of the GnRH circuitry to generate a preovulatory surge in response to estradiol. T exposure within a narrower window around the normal T peak will masculinize sexual behavior and the brain regions that control it94,95 In contrast, low doses of T throughout this critical window will have no effect on genitalia, behavior, or adult basal LH release, but will partially impair LH surges.96
Our study has shown that prenatal exposure to excess androgens in late gestation negatively impacts metabolic profile into adulthood and impairs fertility likely by suppressing LH release. Early androgenization was sufficient to disrupt insulin sensitivity and increase body weight. PNA rats developed obesity with increased serum glucose levels after ITT, indicating impaired insulin sensitivity. They also showed increased mRNA expression of adipokines within iWAT. The inguinal fat depot of rodents is similar to the gluteofemoral subcutaneous depot in humans and this fat depot is more sensitive to insulin in humans97,98, however the effect in rodents has been found to be inconclusive. In obese women, there is increased 17β-hydroxysteroid dehydrogenase type 5 activity within subcutaneous fat depots compared to visceral fat depots indicating increased androgen synthesis within subcutaneous depots.99 Increased mRNA expression of adipokines within iWAT has also been associated with LPS-induced inflammation and required for healthy adipogenesis after acute inflammation.100 However, the release of leptin from white adipose tissue has been associated with increased risk for developing hypertension.101 Upregulation of adipokine mRNA in peripheral adipose tissues has been associated with PCOS, obesity, and hyperinsulinemia.102,103 Future directions for our studies could investigate the synthesis and release of androgens and adipokines into circulation and determine whether this also contributes to hyperandrogenemia or increased risks of cardiovascular disease in women with PCOS and other disorders that fall under metabolic syndrome.
We also found increased blood pressure and reduced heart rate in PNA exposed rats, providing the first evidence in an animal model that early androgenization in utero may increase risk of the development of hypertension and disrupt autonomic control of heart rate. We found that androgen receptor within the left ventricle was increased in the PNA animals, however we did not investigate cardiac insulin sensitivity and propose this as a future direction. Reduced insulin sensitivity or upregulated expression of androgen receptor within the heart has been found to impair cardiac function.104,105 The upregulation of androgen receptor that we observed within the PNA heart may alter the electrophysiology of the cardiomyocytes of the left ventricle by altering expression of receptors involved in the regulation of membrane potential.106,107 Androgens may promote the development of cardiomyopathy by upregulating potassium channel regulatory subunits and reducing cardiomyocyte repolarization.108,109 Indeed, the enlarged walls and decreased cross-sectional area of the left ventricle in the PNA animals resembles early-stage concentric cardiac hypertrophy, although mRNA expression of markers of cardiac hypertrophy were unchanged in PNA animals. Support for this possibility is provided by previous studies in which antiandrogenic treatment attenuated cardiac hypertrophy.110,111
Cystatin C is a low molecular weight protein (MW: 13.3 kDa) from the family of cysteine protease inhibitors that is found in all nucleated cell types including cardiac muscle.112,113 Cystatin C is freely filtered by the glomeruli, reabsorbed by tubular epithelial cells, and broken down; therefore, increased concentrations of Cystatin C in serum is related to impaired glomerular filtration.114−116 It is also associated with increased left ventricular mass, a precursor to cardiac left ventricular hypertrophy (LVH)117, which is associated with increased risk of hypertension.118 Our findings suggest that the kidneys of PNA animals may have impaired glomerular filtration as evident by increased serum cystatin C.
Models of excess sex steroid hormone synthesis have found that the gut microbiota profile is altered by excess androgens. In letrozole-induced PCOS models, gut microbiota exhibited a deficiency in bacteria from the genera Clostridium, Lactobacillus, Ruminococcus but an enrichment of Prevotella with no differences observed in bacteria from Bifidobacterium, Enterococcus, and Bacteroides.42 Another letrozole-induced PCOS model displayed an increase in bacteria of the genera Alistipes, Allobaculum, Blautia, and Ruminococcaceae.35 Neonatal exposure to a single-injection of testosterone increased the concentration of Ruminococcus and Coprococcus—two bacteria involved in bile acid synthesis and found to be increased in the gut of prediabetics.22,119
In the current study, hypertension within the PNA group was accompanied by dramatic changes in the gut microbiota profile. The fecal microbiota of PNA animals contained higher abundance of bacteria commonly associated with steroid hormone synthesis, including bacteria from the families Nocardiaceae120 and Clostridiaceae.121,122 In addition, PNA animals have significantly increased abundance of fecal bacteria associated with cardiovascular function including cardiac muscle contraction, proximal tubule bicarbonate reclamation, and the renin-angiotensin (RAS) system. In previous studies of the fecal microbiota of hypertensive rats, Allobaculum, Aggregatibacter, and Sutturela were enriched however, we found that only Aggregatibacter was enriched and Allobaculum and Sutturela were significantly decreased in relative abundance within the fecal microbiota of the PNA animals; these bacteria are associated with glucose metabolism and the specific role is unknown.123−125
We found that the gut microbiota profile resembles the profile of both patients and other animal models of PCOS; specifically the gut of androgenized women and female rats was found to be depleted of bacteria from Akkermansia, Bacteroides, Lactobacillus, Clostridium.33,42 Administration of Akkermansia as a probiotic was shown to improve the intestinal barrier of the gut by increasing the expression of mucin 2 within the colon.126 A decreased abundance of Akkermansia within the colon of PCOS patients and our prenatal androgen model may be associated with impaired mucosal maintenance. After treatment with Metformin, the gut microbiota of patients with PCOS became enriched with Akkermansia, bacteria that may be associated with glucose homeostasis.127 These gram-negative bacteria are associated with increased production of the bacterial metabolite, lipopolysaccharide (LPS) and induce T cell-mediated immune responses.128
PNA animals had an increased number of bacteria associated with biosynthesis and elongation of unsaturated short chain fatty acids (SCFAs), such as acetate, butyrate, and propionate. These metabolites from the fermentation of nondigested carbohydrates are absorbed by colonocytes within the cecum and colon.129−131 After absorption, SCFAs are processed in the liver for use in gluconeogenesis and lipogenesis.132−135 Interestingly, dietary supplementation with SCFAs has been shown in rodents to promote a switch from lipid synthesis to oxidation and to protect against obesity and insulin resistance.38,39 Bacteria from the family Enterobacteriaceae, particularly Escherichia coli, have been associated with increased systemic lipopolysaccharides136, increased risk of obesity, inflammation, reduced glomerular filtration rate, increased serum cystatin C and insulin resistance.71,137,138
Actinobacteria, Bacteroidetes, and Firmicutes were the most abundant phylum of bacteria found within the fecal microbiota of the control and PNA group. In the phylum Actinobacteria, bacteria from the families Coriobacteriaceae, Cellulomonadaceae, and Micrococcaceae share the highest abundance in both the control and PNA groups, however the PNA groups have increased abundance of Nocardioidaceae—bacteria that was absent in the vehicle group. Other bacteria families such as S24-7 and Odoribacteraceae from the order Bacteroidales were virtually absent within the PNA group. These two families contain bacteria associated with butyrate-production and are found in low-abundance in sedentary women, hypertensive Dahl salt-sensitive rats, and HFD mice fecal microbiota.30,139,140
Gram-positive bacteria, such as bacteria from the family Lachnospiraceae, have been implicated in the development and manifestation of ulcerative colitis.141,142 When the colonic epithelial barrier is disrupted, a negative immune response is triggered after exposure to Lachnospiraceae.143 Our study shows a significantly decrease in the OTU of bacteria from Lachnospiraceae, but other gram-positive bacteria such as Peptococcaceae, Eubacteriaceae, Tissierellaceae, Streptococcaceae, Veillonellaceae, Coprobacillus, and Leuconostocaceae were all significantly increased in abundance within the gut microbiota of PNA animals. The role of gram-positive bacteria and the disruption of the colonic epithelial cell permeability will require further investigation to determine which particular bacteria induce peripheral inflammatory responses in tissues such as the heart, brain and adipose.
Further investigation is needed into when PNA treatment alters gut microbial proliferation and whether early exposure to the maternal microbiota plays an important role. The maternal vaginal or gut flora may influence the development of gut microbial colonization. Mothers with hyperandrogenemia may also expose their fetus to high serum testosterone levels that alter the differentiation of gut epithelial cells and regulate their permeability or functionality. In addition, recent studies have shown that maternal antibodies alter postnatal immunity by increasing aryl hydrocarbon receptors for maternal bacterial metabolites.144 Additional study is needed into the role of steroidogenesis and gut epithelium function in the developing fetus.
In sum, our study is the first to document hypertension and gut microbiota dysbiosis in a rodent model of prenatal hyperandrogenemia. It also substantiates the powerful and long-lasting effect of sex steroids on microbiome composition and metabolic homeostasis. Understanding the relationship between fetal developmental programming, metabolic dysfunction, and gut microbiota dysbiosis is a critical step in developing potential treatment options or preventative therapies for the offspring of women who exhibit hyperandrogenemia during pregnancy.
Supplementary Material
Funding Statement
This study was unfunded.
Ethics approval and consent to participate
This study was carried out in strict accordance with the recommendations in the Guide for the Care and Use of Laboratory Animals by the National Institutes of Health. All procedures involving animals were approved by the Institutional Animal Care and Use Committee (IACUC) at the University of Toledo Health Science Campus, Toledo, Ohio, USA. The IACUC Approval Number is #108644.
Consent for publication
Not applicable
Availability of data and materials
The data generated and analyzed during this study are included in this manuscript and its supplementary information files.
Competing interests
The authors declare that they have no competing interests.
Authors contributions
SS performed studies and drafted the manuscript; NS performed injections and assisted with the studies; MS initiated the rat model in the Hill lab; AS performed the histology; BM performed the telemetry studies overseen by BJ; BJ had input into the project to study microbial dysbiosis and provided comments on the manuscript; JWH designed and oversaw the studies and edited the manuscript
Disclosure of potential conflicts of interest
No potential conflicts of interest were disclosed.
Acknowledgements
The Physiological Genomics Core Facility of the Center for Hypertension and Personalized Medicine at The University of Toledo College of Medicine and Life Sciences assisted in the cardiovascular assessment. Justin Wright and Regina Lamendella, Ph.D. of Wright Labs in Juniata, Pennsylvania for processing fecal microbiota samples, drafting the methods for microbiota analysis, and providing bioinformatics for gut microbial profile. We thank the University of Virginia Center for Research in Reproduction, Ligand Assay and Analysis Core for services provided under grant U54-HD028934.
References
- 1.Perez-Sepulveda A, Monteiro LJ, Dobierzewska A, España-Perrot PP, Venegas-Araneda P, Guzmán-Rojas AM, González Mí I, Palominos-Rivera M, Irarrazabal CE, Figueroa-Diesel H, et al.. Placental Aromatase Is Deficient in Placental Ischemia and Preeclampsia. PLoS One. 2015;10. doi: 10.1371/journal.pone.0139682. [DOI] [PMC free article] [PubMed] [Google Scholar]
- 2.Bulun SE. AROMATASE DEFICIENCY. Fertil Steril. 2014;101:323–329. doi: 10.1016/j.fertnstert.2013.12.022. [DOI] [PMC free article] [PubMed] [Google Scholar]
- 3.Merke DP, Poppas DP. Management of adolescents with congenital adrenal hyperplasia. Lancet Diabetes Endocrinol. 2013;1:341–352. doi: 10.1016/S2213-8587(13)70138-4. [DOI] [PMC free article] [PubMed] [Google Scholar]
- 4.Mnif MF, Kamoun M, Kacem FH, Mnif F, Charfi N, Naceur BB, Rekik N, Abid M. Reproductive outcomes of female patients with congenital adrenal hyperplasia due to 21-hydroxylase defi ciency. Indian J Endocrinol Metab. 2013;17:790–793. [DOI] [PMC free article] [PubMed] [Google Scholar]
- 5.Khattab A, Yuen T, Sun L, Yau M, Barhan A, Zaidi M, Lo YM, New MI. Noninvasive Prenatal Diagnosis of Congenital Adrenal Hyperplasia. Endocr Dev. 2016;30:37–41. [DOI] [PubMed] [Google Scholar]
- 6.Chen CH, Chen IC, Wang YC, Liu JY, Wu GJ, Tzeng CR. Boy born after gender preselection following successive gestational androgen excess of maternal luteoma and female disorders of sex development. Fertil Steril. 2009;91:2732.e2735–2737. doi: 10.1016/j.fertnstert.2008.10.074. [DOI] [PubMed] [Google Scholar]
- 7.Wajda KJ, Lucas JG, Marsh WL Jr.. Hyperreactio luteinalis. Benign disorder masquerading as an ovarian neoplasm. Arch Pathol Lab Med. 1989;113:921–925. [PubMed] [Google Scholar]
- 8.Palomba S, Marotta R, Di Cello A, Russo T, Falbo A, Orio F, Tolino A, Zullo F, Esposito R, La Sala GB. Pervasive developmental disorders in children of hyperandrogenic women with polycystic ovary syndrome: a longitudinal case-control study. Clin Endocrinol (Oxf). 2012;77:898–904. doi: 10.1111/j.1365-2265.2012.04443.x. [DOI] [PubMed] [Google Scholar]
- 9.Carlsen SM, Romundstad P, Jacobsen G. Early second-trimester maternal hyperandrogenemia and subsequent preeclampsia: a prospective study. Acta Obstet Gynecol Scand. 2005;84:117–121. doi: 10.1111/j.0001-6349.2005.00493.x. [DOI] [PubMed] [Google Scholar]
- 10.Wang YC, Su HY, Liu JY, Chang FW, Chen CH. Maternal and female fetal virilization caused by pregnancy luteomas. Fertil Steril. 2005;84:509. doi: 10.1016/j.fertnstert.2005.02.029. PMID:16086574. [DOI] [PubMed] [Google Scholar]
- 11.Angioni S, Portoghese E, Milano F, Melis GB, Fulghesu AM. Hirsutism and hyperandrogenism associated with hyperreactio luteinalis in a singleton pregnancy: a case report. Gynecol Endocrinol. 2007;23:248–251. doi: 10.1080/09513590701214513. [DOI] [PubMed] [Google Scholar]
- 12.Gopalakrishnan K, Mishra JS, Chinnathambi V, Vincent KL, Patrikeev I, Motamedi M, Saade GR, Hankins GD, Sathishkumar K. Elevated Testosterone Reduces Uterine Blood Flow, Spiral Artery Elongation, and Placental Oxygenation in Pregnant Rats. Hypertension. 2016;67:630–639. [DOI] [PMC free article] [PubMed] [Google Scholar]
- 13.Rosenfield RL, Ehrmann DA. The Pathogenesis of Polycystic Ovary Syndrome (PCOS): The Hypothesis of PCOS as Functional Ovarian Hyperandrogenism Revisited. Endocr Rev. 2016;37:467–520. doi: 10.1210/er.2015-1104. [DOI] [PMC free article] [PubMed] [Google Scholar]
- 14.Anderson AD. Childhood Obesity and Its Impact on the Development of Adolescent PCOS. 2014;32:202–213. [DOI] [PMC free article] [PubMed] [Google Scholar]
- 15.Dumesic DA, Abbott DH, Padmanabhan V. Polycystic ovary syndrome and its developmental origins. Rev Endocr Metab Disord. 2007;8:127–141. doi: 10.1007/s11154-007-9046-0. [DOI] [PMC free article] [PubMed] [Google Scholar]
- 16.Barrett ES, Swan SH. Stress and Androgen Activity During Fetal Development. Endocrinology. 2015;156:3435–3441. doi: 10.1210/en.2015-1335. [DOI] [PMC free article] [PubMed] [Google Scholar]
- 17.de Zegher F, Lopez-Bermejo A, Ibanez L. Adipose tissue expandability and the early origins of PCOS. Trends Endocrinol Metab. 2009;20:418–423. doi: 10.1016/j.tem.2009.06.003. [DOI] [PubMed] [Google Scholar]
- 18.Orio F, Muscogiuri G, Nese C, Palomba S, Savastano S, Tafuri D, Colarieti G, La Sala G, Colao A, Yildiz BO. Obesity, type 2 diabetes mellitus and cardiovascular disease risk: an uptodate in the management of polycystic ovary syndrome. Eur J Obstet Gynecol Reprod Biol. 2016;207:214–219. doi: 10.1016/j.ejogrb.2016.08.026. [DOI] [PubMed] [Google Scholar]
- 19.Dumesic DA, Schramm RD, Abbott DH. Early origins of polycystic ovary syndrome. Reprod Fertil Dev. 2005;17:349–360. doi: 10.1071/RD04092. [DOI] [PubMed] [Google Scholar]
- 20.Tehrani FR, Noroozzadeh M, Zahediasl S, Piryaei A, Azizi F. Introducing a rat model of prenatal androgen-induced polycystic ovary syndrome in adulthood. Exp Physiol. 2014;99:792–801. doi: 10.1113/expphysiol.2014.078055. PMID:24532600. [DOI] [PubMed] [Google Scholar]
- 21.Yan X, Dai X, Wang J, Zhao N, Cui Y, Liu J. Prenatal androgen excess programs metabolic derangements in pubertal female rats. J Endocrinol. 2013;217:119–129. doi: 10.1530/JOE-12-0577. [DOI] [PubMed] [Google Scholar]
- 22.Moreno-Indias I, Sanchez-Alcoholado L, Sanchez-Garrido MA, Martin-Nunez GM, Perez-Jimenez F, Tena-Sempere M, Tinahones FJ, Queipo-Ortuno MI. Neonatal Androgen Exposure Causes Persistent Gut Microbiota Dysbiosis Related to Metabolic Disease in Adult Female Rats. Endocrinology. 2016;157:4888–4898. doi: 10.1210/en.2016-1317. [DOI] [PubMed] [Google Scholar]
- 23.Wigal T, Amsel A. Behavioral and neuroanatomical effects of prenatal, postnatal, or combined exposure to ethanol in weanling rats. Behav Neurosci. 1990;104:116–126. doi: 10.1037/0735-7044.104.1.116. [DOI] [PubMed] [Google Scholar]
- 24.Zoeller RT, Rovet J. Timing of thyroid hormone action in the developing brain: clinical observations and experimental findings. J Neuroendocrinol. 2004;16:809–818. doi: 10.1111/j.1365-2826.2004.01243.x. [DOI] [PubMed] [Google Scholar]
- 25.Weisz J, Ward IL. Plasma testosterone and progesterone titers of pregnant rats, their male and female fetuses, and neonatal offspring. Endocrinology. 1980;106:306–316. doi: 10.1210/endo-106-1-306. [DOI] [PubMed] [Google Scholar]
- 26.Gibori G, Chatterton RT Jr., Chien JL. Ovarian and serum concentrations of androgen throughout pregnancy in the rat. Biol Reprod. 1979;21:53–56. doi: 10.1095/biolreprod21.1.53. [DOI] [PubMed] [Google Scholar]
- 27.More AS, Mishra JS, Hankins GD, Kumar S. Prenatal Testosterone Exposure Decreases Aldosterone Production but Maintains Normal Plasma Volume and Increases Blood Pressure in Adult Female Rats. Biol Reprod. 2016;95:42. doi: 10.1095/biolreprod.116.141705. PMID:27385784. [DOI] [PMC free article] [PubMed] [Google Scholar]
- 28.Nohara K, Waraich RS, Liu S, Ferron M, Waget A, Meyers MS, Karsenty G, Burcelin R, Mauvais-Jarvis F. Developmental androgen excess programs sympathetic tone and adipose tissue dysfunction and predisposes to a cardiometabolic syndrome in female mice. Am J Physiol Endocrinol Metab. 2013;304:E1321−1330. doi: 10.1152/ajpendo.00620.2012. [DOI] [PMC free article] [PubMed] [Google Scholar]
- 29.Blesson CS, Chinnathambi V, Hankins GD, Yallampalli C, Sathishkumar K. Prenatal testosterone exposure induces hypertension in adult females via androgen receptor-dependent protein kinase Cdelta-mediated mechanism. Hypertension. 2015;65:683–690. doi: 10.1161/HYPERTENSIONAHA.114.04521. [DOI] [PMC free article] [PubMed] [Google Scholar]
- 30.Mell B, Jala VR, Mathew AV, Byun J, Waghulde H, Zhang Y, Haribabu B, Vijay-Kumar M, Pennathur S, Joe B. Evidence for a link between gut microbiota and hypertension in the Dahl rat. Physiol Genomics. 2015;47:187–197. doi: 10.1152/physiolgenomics.00136.2014. [DOI] [PMC free article] [PubMed] [Google Scholar]
- 31.Tremellen K, Pearce K. Dysbiosis of Gut Microbiota (DOGMA)–a novel theory for the development of Polycystic Ovarian Syndrome. Med Hypotheses. 2012;79:104–112. doi: 10.1016/j.mehy.2012.04.016. [DOI] [PubMed] [Google Scholar]
- 32.Lindheim L, Bashir M, Münzker J, Trummer C, Zachhuber V, Leber B, Horvath A, Pieber TR, Gorkiewicz G, Stadlbauer V, et al. Alterations in Gut Microbiome Composition and Barrier Function Are Associated with Reproductive and Metabolic Defects in Women with Polycystic Ovary Syndrome (PCOS): A Pilot Study. PLoS One. 2017;12(1): e0168390. 10.1371/journal.pone.0168390. PMID:28045919. [DOI] [PMC free article] [PubMed] [Google Scholar]
- 33.Liu R, Zhang C, Shi Y, Zhang F, Li L, Wang X, Ling Y, Fu H, Dong W, Shen J, et al.. Dysbiosis of Gut Microbiota Associated with Clinical Parameters in Polycystic Ovary Syndrome. Front Microbiol. 2017;8:324. 10.3389/fmicb.2017.00324. [DOI] [PMC free article] [PubMed] [Google Scholar]
- 34.Schneeberger M, Everard A, Gomez-Valades AG, Matamoros S, Ramirez S, Delzenne NM, Gomis R, Claret M, Cani PD. Akkermansia muciniphila inversely correlates with the onset of inflammation, altered adipose tissue metabolism and metabolic disorders during obesity in mice. Sci Rep. 2015;5:16643. doi: 10.1038/srep16643. PMID:26563823. [DOI] [PMC free article] [PubMed] [Google Scholar]
- 35.Kelley ST, Skarra DV, Rivera AJ, Thackray VG. The Gut Microbiome Is Altered in a Letrozole-Induced Mouse Model of Polycystic Ovary Syndrome. PLoS One. 2016:e0146509. 10.1371/journal.pone.0146509. [DOI] [PMC free article] [PubMed] [Google Scholar]
- 36.Redinbo MR. The Microbiota, Chemical Symbiosis, and Human Disease. J Mol Biol. 2014;426:3877–3891. doi: 10.1016/j.jmb.2014.09.011. [DOI] [PMC free article] [PubMed] [Google Scholar]
- 37.Zhao Y, Wu J, Li JV, Zhou NY, Tang H, Wang Y. Gut microbiota composition modifies fecal metabolic profiles in mice. J Proteome Res. 2013;12:2987–2999. doi: 10.1021/pr400263n. [DOI] [PubMed] [Google Scholar]
- 38.Gao Z, Yin J, Zhang J, Ward RE, Martin RJ, Lefevre M, Cefalu WT, Ye J. Butyrate improves insulin sensitivity and increases energy expenditure in mice. Diabetes. 2009;58:1509–1517. doi: 10.2337/db08-1637. [DOI] [PMC free article] [PubMed] [Google Scholar]
- 39.den Besten G, Bleeker A, Gerding A, van Eunen K, Havinga R, van Dijk TH, Oosterveer MH, Jonker JW, Groen AK, Reijngoud DJ, Bakker BM. Short-Chain Fatty Acids Protect Against High-Fat Diet-Induced Obesity via a PPARgamma-Dependent Switch From Lipogenesis to Fat Oxidation. Diabetes. 2015;64:2398–2408. doi: 10.2337/db14-1213. [DOI] [PubMed] [Google Scholar]
- 40.Yu M, Jia H, Zhou C, Yang Y, Zhao Y, Yang M, Zou Z. Variations in gut microbiota and fecal metabolic phenotype associated with depression by 16S rRNA gene sequencing and LC/MS-based metabolomics. J Pharm Biomed Anal. 2017;138:231–239. doi: 10.1016/j.jpba.2017.02.008. [DOI] [PubMed] [Google Scholar]
- 41.Clark A, Mach N. Exercise-induced stress behavior, gut-microbiota-brain axis and diet: a systematic review for athletes. J Int Soc Sports Nutr. 2016;13. doi: 10.1186/s12970-016-0155-6. PMID:27924137. [DOI] [PMC free article] [PubMed] [Google Scholar]
- 42.Guo Y, Qi Y, Yang X, Zhao L, Wen S, Liu Y, Tang L. Association between Polycystic Ovary Syndrome and Gut Microbiota. PLoS One. 2016;11:e0153196. 10.1371/journal.pone.0153196. PMID:27093642. [DOI] [PMC free article] [PubMed] [Google Scholar]
- 43.Neu J. The microbiome during pregnancy and early postnatal life. Semin Fetal Neonatal Med. 2016;21:373–379. doi: 10.1016/j.siny.2016.05.001. [DOI] [PubMed] [Google Scholar]
- 44.Reinhardt C, Reigstad CS, Backhed F. Intestinal microbiota during infancy and its implications for obesity. J Pediatr Gastroenterol Nutr. 2009;48:249–256. doi: 10.1097/MPG.0b013e318183187c. [DOI] [PubMed] [Google Scholar]
- 45.Markle JG, Frank DN, Mortin-Toth S, Robertson CE, Feazel LM, Rolle-Kampczyk U, von Bergen M, McCoy KD, Macpherson AJ, Danska JS. Sex differences in the gut microbiome drive hormone-dependent regulation of autoimmunity. Science. 2013;339:1084–1088. doi: 10.1126/science.1233521. [DOI] [PubMed] [Google Scholar]
- 46.Qiu X, Dowling AR, Marino JS, Faulkner LD, Bryant B, Brüning JC, Elias CF, Hill JW. Delayed Puberty but Normal Fertility in Mice With Selective Deletion of Insulin Receptors From Kiss1 Cells. Endocrinology. 2013;154:1337–1348. doi: 10.1210/en.2012-2056. [DOI] [PMC free article] [PubMed] [Google Scholar]
- 47.Marino JS, Iler J, Dowling AR, Chua S, Bruning JC, Coppari R, Hill JW. Adipocyte dysfunction in a mouse model of polycystic ovary syndrome (PCOS): evidence of adipocyte hypertrophy and tissue-specific inflammation. PLoS One. 2012;7:e48643. doi: 10.1371/journal.pone.0048643. PMID:23119079. [DOI] [PMC free article] [PubMed] [Google Scholar]
- 48.Schneider CA, Rasband WS, Eliceiri KW. NIH Image to ImageJ: 25 years of image analysis. Nat Methods. 2012;9:671–675. doi: 10.1038/nmeth.2089. [DOI] [PMC free article] [PubMed] [Google Scholar]
- 49.Kumarasamy S, Gopalakrishnan K, Toland EJ, Yerga-Woolwine S, Farms P, Morgan EE, Joe B. Refined mapping of blood pressure quantitative trait loci using congenic strains developed from two genetically hypertensive rat models. Hypertens Res. 2011;34:1263–1270. doi: 10.1038/hr.2011.116. [DOI] [PMC free article] [PubMed] [Google Scholar]
- 50.Joe B, Garrett MR, Dene H, Rapp JP. Substitution mapping of a blood pressure quantitative trait locus to a 2.73 Mb region on rat chromosome 1. J Hypertens. 2003;21:2077–2084. doi: 10.1097/00004872-200311000-00017. [DOI] [PubMed] [Google Scholar]
- 51.Dowling AR, Nedorezov LB, Qiu X, Marino JS, Hill JW. Genetic Factors Modulate the Impact of Pubertal Androgen Excess on Insulin Sensitivity and Fertility. PLoS One. 2013;8:e79849. 10.1371/journal.pone.0079849. [DOI] [PMC free article] [PubMed] [Google Scholar]
- 52.Kolios G, Kotzampassi K, Manousou P, Paramythiotis D, Papanastasiou H, Drygiannakis I, Notas G, Tsagarakis N, Eleftheriadis E, Kouroumalis E. Enteral nutrition affects nitric oxide production in peripheral blood and liver after a postoperative lipopolysaccharide-induced endotoxemia in rats. Nutrition. 2007;23:575–581. doi: 10.1016/j.nut.2007.04.010. [DOI] [PubMed] [Google Scholar]
- 53.Leu YW, Chu PY, Chen CM, Yeh KT, Liu YM, Lee YH, Kuo ST, Hsiao SH. Early life ethanol exposure causes long-lasting disturbances in rat mesenchymal stem cells via epigenetic modifications. Biochem Biophys Res Commun. 2014;453:338–344. doi: 10.1016/j.bbrc.2014.09.083. [DOI] [PubMed] [Google Scholar]
- 54.Matsunami T, Sato Y, Ariga S, Sato T, Shimomura T, Kashimura H, Hasegawa Y, Yukawa M. Regulation of synthesis and oxidation of fatty acids by adiponectin receptors (AdipoR1/R2) and insulin receptor substrate isoforms (IRS-1/-2) of the liver in a nonalcoholic steatohepatitis animal model. Metabolism. 2011;60:805–814. doi: 10.1016/j.metabol.2010.07.032. [DOI] [PubMed] [Google Scholar]
- 55.Dieudonne MN, Pecquery R, Boumediene A, Leneveu MC, Giudicelli Y. Androgen receptors in human preadipocytes and adipocytes: regional specificities and regulation by sex steroids. Am J Physiol. 1998;274:C1645−1652. doi: 10.1152/ajpcell.1998.274.6.C1645. [DOI] [PubMed] [Google Scholar]
- 56.Mao HP, Wang XY, Gao YH, Chang YX, Chen L, Niu ZC, Ai JQ, Gao XM. Danhong injection attenuates isoproterenol-induced cardiac hypertrophy by regulating p38 and NF-kappab pathway. J Ethnopharmacol. 2016;186:20–29. doi: 10.1016/j.jep.2016.03.015. [DOI] [PubMed] [Google Scholar]
- 57.Faria Tda S, Brasil Fde B, Sampaio FJ, Ramos Cda F. Maternal malnutrition during lactation alters the folliculogenesis and gonadotropins and estrogen isoforms ovarian receptors in the offspring at puberty. J Endocrinol. 2008;198:625–634. [DOI] [PubMed] [Google Scholar]
- 58.Wisniewski P, Romano RM, Kizys MM, Oliveira KC, Kasamatsu T, Giannocco G, Chiamolera MI, Dias-da-Silva MR, Romano MA. Adult exposure to bisphenol A (BPA) in Wistar rats reduces sperm quality with disruption of the hypothalamic-pituitary-testicular axis. Toxicology. 2015;329:1–9. doi: 10.1016/j.tox.2015.01.002. [DOI] [PubMed] [Google Scholar]
- 59.White CL, Purpera MN, Ballard K, Morrison CD. Decreased Food Intake Following Overfeeding Involves Leptin-Dependent and Leptin-Independent Mechanisms. Physiol Behav. 2010;100:408–416. doi: 10.1016/j.physbeh.2010.04.006. [DOI] [PMC free article] [PubMed] [Google Scholar]
- 60.Xue Q, Patterson AJ, Xiao D, Zhang L. Glucocorticoid modulates angiotensin II receptor expression patterns and protects the heart from ischemia and reperfusion injury. PLoS One. 2014;9:e106827. doi: 10.1371/journal.pone.0106827. PMID:25265380. [DOI] [PMC free article] [PubMed] [Google Scholar]
- 61.Prieto-Carrasquero MC, Harrison-Bernard LM, Kobori H, Ozawa Y, Hering-Smith KS, Hamm LL, Navar LG. Enhancement of Collecting Duct Renin in Angiotensin II—Dependent Hypertensive Rats. Hypertension. 2004;44:223–229. doi: 10.1161/01.HYP.0000135678.20725.54. [DOI] [PMC free article] [PubMed] [Google Scholar]
- 62.Caporaso JG, Kuczynski J, Stombaugh J, Bittinger K, Bushman FD, Costello EK, Fierer N, Pena AG, Goodrich JK, Gordon JI, et al.. QIIME allows analysis of high-throughput community sequencing data. Nat Methods. 2010;7:335–336. doi: 10.1038/nmeth.f.303. [DOI] [PMC free article] [PubMed] [Google Scholar]
- 63.Edgar RC. UPARSE: highly accurate OTU sequences from microbial amplicon reads. Nat Methods. 2013;10:996–998. doi: 10.1038/nmeth.2604. [DOI] [PubMed] [Google Scholar]
- 64.Caporaso JG, Lauber CL, Walters WA, Berg-Lyons D, Lozupone CA, Turnbaugh PJ, Fierer N, Knight R. Global patterns of 16S rRNA diversity at a depth of millions of sequences per sample. Proc Natl Acad Sci U S A. 2011;108 Suppl 1:4516–4522. [DOI] [PMC free article] [PubMed] [Google Scholar]
- 65.Edgar RC. Search and clustering orders of magnitude faster than BLAST. Bioinformatics. 2010;26:2460–2461. doi: 10.1093/bioinformatics/btq461. [DOI] [PubMed] [Google Scholar]
- 66.DeSantis TZ, Hugenholtz P, Larsen N, Rojas M, Brodie EL, Keller K, Huber T, Dalevi D, Hu P, Andersen GL. Greengenes, a chimera-checked 16S rRNA gene database and workbench compatible with ARB. Appl Environ Microbiol. 2006;72:5069–5072. doi: 10.1128/AEM.03006-05. [DOI] [PMC free article] [PubMed] [Google Scholar]
- 67.McMurdie PJ, Holmes S. phyloseq: an R package for reproducible interactive analysis and graphics of microbiome census data. PLoS One. 2013;8:e61217. doi: 10.1371/journal.pone.0061217. PMID:23630581. [DOI] [PMC free article] [PubMed] [Google Scholar]
- 68.Paulson JN, Stine OC, Bravo HC, Pop M. Robust methods for differential abundance analysis in marker gene surveys. Nat Methods. 2013;10:1200–1202. doi: 10.1038/nmeth.2658. [DOI] [PMC free article] [PubMed] [Google Scholar]
- 69.Segata N, Izard J, Waldron L, Gevers D, Miropolsky L, Garrett WS, Huttenhower C. Metagenomic biomarker discovery and explanation. Genome Biol. 2011;12:R60. doi: 10.1186/gb-2011-12-6-r60. PMID:21702898. [DOI] [PMC free article] [PubMed] [Google Scholar]
- 70.Talbott E, Guzick D, Clerici A, Berga S, Detre K, Weimer K, Kuller L. Coronary heart disease risk factors in women with polycystic ovary syndrome. Arterioscler Thromb Vasc Biol. 1995;15:821–826. doi: 10.1161/01.ATV.15.7.821. [DOI] [PubMed] [Google Scholar]
- 71.Derad I, Obermann B, Katalinic A, Eisemann N, Knobloch JK, Sayk F, Wellhoner P, Lehnert H, Solbach W, Sufke S, et al.. Hypertension and mild chronic kidney disease persist following severe haemolytic uraemic syndrome caused by Shiga toxin-producing Escherichia coli O104:H4 in adults. Nephrol Dial Transplant. 2016;31:95–103. doi: 10.1093/ndt/gfv255. [DOI] [PubMed] [Google Scholar]
- 72.Sheppard JP, Fletcher K, McManus RJ, Mant J. Prevalence and costs of treating uncomplicated stage 1 hypertension in primary care: a cross-sectional analysis. Br J Gen Pract. 2014;64:e641−648. doi: 10.3399/bjgp14X681817. [DOI] [PMC free article] [PubMed] [Google Scholar]
- 73.Hong K, Zhao G, Hong Z, Sun Z, Yang Y, Clifford PS, Davis MJ, Meininger GA, Hill MA. Mechanical activation of angiotensin II type 1 receptors causes actin remodelling and myogenic responsiveness in skeletal muscle arterioles. J Physiol. 2016;594:7027–7047. doi: 10.1113/JP272834. [DOI] [PMC free article] [PubMed] [Google Scholar]
- 74.Zhao W, Zhao T, Chen Y, Zhao F, Gu Q, Williams RW, Bhattacharya SK, Lu L, Sun Y. A Murine Hypertrophic Cardiomyopathy Model: The DBA/2J Strain. PLoS One. 2015;10:e0133132. 10.1371/journal.pone.0133132. [DOI] [PMC free article] [PubMed] [Google Scholar]
- 75.Nguyen N-P, Warnow T, Pop M, White B. A perspective on 16S rRNA operational taxonomic unit clustering using sequence similarity. Npj Biofilms And Microbiomes. 2016;2:16004. doi: 10.1038/npjbiofilms.2016.4. PMID:28721243. [DOI] [PMC free article] [PubMed] [Google Scholar]
- 76.Morgan XC, Huttenhower C. Chapter 12: Human microbiome analysis. PLoS Comput Biol. 2012;8:e1002808. doi: 10.1371/journal.pcbi.1002808. PMID:23300406. [DOI] [PMC free article] [PubMed] [Google Scholar]
- 77.Azziz R, Carmina E, Chen Z, Dunaif A, Laven JSE, Legro RS, Lizneva D, Natterson-Horowtiz B, Teede HJ, Yildiz BO. Polycystic ovary syndrome. 2016;2:16057. [DOI] [PubMed] [Google Scholar]
- 78.Randeva HS, Tan BK, Weickert MO, Lois K, Nestler JE, Sattar N, Lehnert H. Cardiometabolic Aspects of the Polycystic Ovary Syndrome. Endocr Rev. 2012;33:812–841. doi: 10.1210/er.2012-1003. [DOI] [PMC free article] [PubMed] [Google Scholar]
- 79.Nohara K, Liu S, Meyers MS, Waget A, Ferron M, Karsenty G, Burcelin R, Mauvais-Jarvis F. Developmental androgen excess disrupts reproduction and energy homeostasis in adult male mice. J Endocrinol. 2013;219:259–268. doi: 10.1530/JOE-13-0230. [DOI] [PMC free article] [PubMed] [Google Scholar]
- 80.Bentley-Lewis R, Seely E, Dunaif A. Ovarian Hypertension: Polycystic Ovary Syndrome. Endocrinol Metab Clin North Am. 2011;40:433−x. doi: 10.1016/j.ecl.2011.01.009. [DOI] [PMC free article] [PubMed] [Google Scholar]
- 81.do Carmo JM, da Silva AA, Moak SP, Houghton HJ, Smith A, Hall JE. Regulation of Blood Pressure, Appetite, and Glucose by CNS Melanocortin System in Hyperandrogenemic Female SHR. Am J Hypertens. 2016;29:832–840. doi: 10.1093/ajh/hpv182. [DOI] [PMC free article] [PubMed] [Google Scholar]
- 82.Yanes LL, Romero DG, Moulana M, Lima R, Davis DD, Zhang H, Lockhart R, Reckelhoff JF. Cardiovascular-renal and metabolic characterization of a rat model of polycystic ovary syndrome. Gend Med. 2011;8:103–115. doi: 10.1016/j.genm.2010.11.013. [DOI] [PMC free article] [PubMed] [Google Scholar]
- 83.Yu H-F, Chen H-S, Rao D-P, Gong J. Association between polycystic ovary syndrome and the risk of pregnancy complications: A PRISMA-compliant systematic review and meta-analysis. Medicine (Baltimore). 2016;95:e4863. 10.1097/MD.0000000000004863. [DOI] [PMC free article] [PubMed] [Google Scholar]
- 84.Qin JZ, Pang LH, Li MJ, Fan XJ, Huang RD, Chen HY. Obstetric complications in women with polycystic ovary syndrome: a systematic review and meta-analysis. Reprod Biol Endocrinol. 2013;11:56. doi: 10.1186/1477-7827-11-56. PMID:23800002. [DOI] [PMC free article] [PubMed] [Google Scholar]
- 85.Legro RS, Arslanian SA, Ehrmann DA, Hoeger KM, Murad MH, Pasquali R, Welt CK. Diagnosis and Treatment of Polycystic Ovary Syndrome: An Endocrine Society Clinical Practice Guideline. J Clin Endocrinol Metab. 2013;98:4565–4592. doi: 10.1210/jc.2013-2350. [DOI] [PMC free article] [PubMed] [Google Scholar]
- 86.Vambergue A, Lautier C, Valat AS, Cortet-Rudelli C, Grigorescu F, Dewailly D. Follow-up study of two sisters with type A syndrome of severe insulin resistance gives a new insight into PCOS pathogenesis in relation to puberty and pregnancy outcome: a case report. Hum Reprod. 2006;21:1274–1278. doi: 10.1093/humrep/dei455. [DOI] [PubMed] [Google Scholar]
- 87.Rojas J, Chávez-Castillo M, Bermúdez V. The Role of Metformin in Metabolic Disturbances during Pregnancy: Polycystic Ovary Syndrome and Gestational Diabetes Mellitus. Int J Reprod Med. 2014;2014. 797681 doi: 10.1155/2014/797681. [DOI] [PMC free article] [PubMed] [Google Scholar]
- 88.Abell SK, De Courten B, Boyle JA, Teede HJ. Inflammatory and Other Biomarkers: Role in Pathophysiology and Prediction of Gestational Diabetes Mellitus. Int J Mol Sci. 2015;16:13442–13473. doi: 10.3390/ijms160613442. [DOI] [PMC free article] [PubMed] [Google Scholar]
- 89.Kell DB, Kenny LC. A Dormant Microbial Component in the Development of Preeclampsia. Front Med (Lausanne). 2016;3. PMID:27965958. [DOI] [PMC free article] [PubMed] [Google Scholar]
- 90.Hiort O. The differential role of androgens in early human sex development. BMC Med. 2013;11:152. doi: 10.1186/1741-7015-11-152. PMID:23800242. [DOI] [PMC free article] [PubMed] [Google Scholar]
- 91.Padmanabhan V, Cardoso RC, Puttabyatappa M. Developmental Programming, a Pathway to Disease. Endocrinology. 2016;157:1328–1340. doi: 10.1210/en.2016-1003. [DOI] [PMC free article] [PubMed] [Google Scholar]
- 92.Scott HM, Mason JI, Sharpe RM. Steroidogenesis in the Fetal Testis and Its Susceptibility to Disruption by Exogenous Compounds. Endocrine Reviews. 2009;30:883–925. doi: 10.1210/er.2009-0016. [DOI] [PubMed] [Google Scholar]
- 93.Rey R, Josso N, Racine C. Sexual Differentiation In Endotext. Edited by De Groot LJ, Chrousos G, Dungan K, Feingold KR, Grossman A, Hershman JM, Koch C, Korbonits M, McLachlan R, New M, et al.. South Dartmouth: (MA: );2000. [Google Scholar]
- 94.Clarke IJ, Scaramuzzi RJ, Short RV. Effects of Testosterone Implants in Pregnant Ewes on Their Female Offspring. J Embryol Exp Morphol. 1976;36:87–99. PMID:988109. [PubMed] [Google Scholar]
- 95.Roselli CE, Reddy RC, Estill CT, Scheldrup M, Meaker M, Stormshak F, Montilla HJ. Prenatal influence of an androgen agonist and antagonist on the differentiation of the ovine sexually dimorphic nucleus in male and female lamb fetuses. Endocrinology. 2014;155:5000–5010. doi: 10.1210/en.2013-2176. [DOI] [PMC free article] [PubMed] [Google Scholar]
- 96.Wood RI, Foster DL. Sexual differentiation of reproductive neuroendocrine function in sheep. Reviews of Reproduction. 1998;3:130–140. doi: 10.1530/ror.0.0030130. [DOI] [PubMed] [Google Scholar]
- 97.Rehrer CW, Karimpour-Fard A, Hernandez TL, Law CK, Stob NR, Hunter LE, Eckel RH. Regional differences in subcutaneous adipose tissue gene expression. Obesity (Silver Spring). 2012;20:2168–2173. doi: 10.1038/oby.2012.117. [DOI] [PMC free article] [PubMed] [Google Scholar]
- 98.Chusyd DE, Wang D, Huffman DM, Nagy TR. Relationships between Rodent White Adipose Fat Pads and Human White Adipose Fat Depots. Front Nutr. 2016;3:10. doi: 10.3389/fnut.2016.00010. PMID:27148535. [DOI] [PMC free article] [PubMed] [Google Scholar]
- 99.Quinkler M, Sinha B, Tomlinson JW, Bujalska IJ, Stewart PM, Arlt W. Androgen generation in adipose tissue in women with simple obesity–a site-specific role for 17beta-hydroxysteroid dehydrogenase type 5. J Endocrinol. 2004;183:331–342. doi: 10.1677/joe.1.05762. [DOI] [PubMed] [Google Scholar]
- 100.Asterholm IW. Adipocyte Inflammation is Essential for Healthy Adipose Tissue Expansion and Remodeling. 2014;20:103–118. [DOI] [PMC free article] [PubMed] [Google Scholar]
- 101.Asferg C, Mogelvang R, Flyvbjerg A, Frystyk J, Jensen JS, Marott JL, Appleyard M, Jensen GB, Jeppesen J. Leptin, not adiponectin, predicts hypertension in the Copenhagen City Heart Study. Am J Hypertens. 2010;23:327–333. doi: 10.1038/ajh.2009.244. [DOI] [PubMed] [Google Scholar]
- 102.Vidal H, Auboeuf D, De Vos P, Staels B, Riou JP, Auwerx J, Laville M. The expression of ob gene is not acutely regulated by insulin and fasting in human abdominal subcutaneous adipose tissue. J Clin Invest. 1996;98:251–255. doi: 10.1172/JCI118786. [DOI] [PMC free article] [PubMed] [Google Scholar]
- 103.Jalilian N, Haghnazari L, Rasolinia S. Leptin and body mass index in polycystic ovary syndrome. Indian J Endocrinol Metab. 2016;20:324–328. doi: 10.4103/2230-8210.180005. [DOI] [PMC free article] [PubMed] [Google Scholar]
- 104.Marsh JD, Lehmann MH, Ritchie RH, Gwathmey JK, Green GE, Schiebinger RJ. Androgen receptors mediate hypertrophy in cardiac myocytes. Circulation. 1998;98:256–261. doi: 10.1161/01.CIR.98.3.256. [DOI] [PubMed] [Google Scholar]
- 105.Leinwand LA. Sex is a potent modifier of the cardiovascular system. J Clin Invest. 2003;112:302–307. doi: 10.1172/JCI200319429. [DOI] [PMC free article] [PubMed] [Google Scholar]
- 106.Vicencio JM, Ibarra C, Estrada M, Chiong M, Soto D, Parra V, Diaz-Araya G, Jaimovich E, Lavandero S. Testosterone induces an intracellular calcium increase by a nongenomic mechanism in cultured rat cardiac myocytes. Endocrinology. 2006;147:1386–1395. doi: 10.1210/en.2005-1139. [DOI] [PubMed] [Google Scholar]
- 107.Ayaz O, Howlett SE. Testosterone modulates cardiac contraction and calcium homeostasis: cellular and molecular mechanisms. Biol Sex Differ. 2015;6:9. doi: 10.1186/s13293-015-0027-9. PMID:25922656. [DOI] [PMC free article] [PubMed] [Google Scholar]
- 108.Crump SM, Hu Z, Kant R, Levy DI, Goldstein SAN, Abbott GW. Kcne4 deletion sex- and age-specifically impairs cardiac repolarization in mice. Faseb j. 2016;30:360–369. doi: 10.1096/fj.15-278754. [DOI] [PMC free article] [PubMed] [Google Scholar]
- 109.Roepke TK, Kontogeorgis A, Ovanez C, Xu X, Young JB, Purtell K, Goldstein PA, Christini DJ, Peters NS, Akar FG, et al.. Targeted deletion of kcne2 impairs ventricular repolarization via disruption of I(K,slow1) and I(to,f). Faseb j. 2008;22:3648–3660. doi: 10.1096/fj.08-110171. [DOI] [PMC free article] [PubMed] [Google Scholar]
- 110.Baltatu O, Cayla C, Iliescu R, Andreev D, Bader M. Abolition of end-organ damage by antiandrogen treatment in female hypertensive transgenic rats. Hypertension. 2003;41:830–833. doi: 10.1161/01.HYP.0000048702.55183.89. [DOI] [PubMed] [Google Scholar]
- 111.Zwadlo C, Schmidtmann E, Szaroszyk M, Kattih B, Froese N, Hinz H, Schmitto JD, Widder J, Batkai S, Bahre H, et al.. Antiandrogenic therapy with finasteride attenuates cardiac hypertrophy and left ventricular dysfunction. Circulation. 2015;131:1071–1081. doi: 10.1161/CIRCULATIONAHA.114.012066. [DOI] [PubMed] [Google Scholar]
- 112.Xie L, Terrand J, Xu B, Tsaprailis G, Boyer J, Chen QM. Cystatin C increases in cardiac injury: a role in extracellular matrix protein modulation. Cardiovasc Res. 2010;87:628–635. doi: 10.1093/cvr/cvq138. [DOI] [PMC free article] [PubMed] [Google Scholar]
- 113.Shlipak MG, Matsushita K, Arnlov J, Inker LA, Katz R, Polkinghorne KR, Rothenbacher D, Sarnak MJ, Astor BC, Coresh J, et al.. Cystatin C versus creatinine in determining risk based on kidney function. N Engl J Med. 2013;369:932–943. doi: 10.1056/NEJMoa1214234. [DOI] [PMC free article] [PubMed] [Google Scholar]
- 114.Curhan G. Cystatin C: A Marker of Renal Function or Something More? Clinical Chemistry. 2005;51:293–294. doi: 10.1373/clinchem.2004.044388. [DOI] [PubMed] [Google Scholar]
- 115.Grubb A. Diagnostic value of analysis of cystatin C and protein HC in biological fluids. Clin Nephrol. 1992;38 Suppl 1:S20–27. [PubMed] [Google Scholar]
- 116.Sarkar PD, Rajeshwari G, Shivaprakash TM. Cystatin C-A novel marker of glomerular filtration rate: A review. Indian J Clin Biochem. 2005;20:139–144. doi: 10.1007/BF02893060. [DOI] [PMC free article] [PubMed] [Google Scholar]
- 117.Aumann N, Baumeister SE, Werner A, Wallaschofski H, Hannemann A, Nauck M, Rettig R, Felix SB, Dorr M, Volzke H, et al.. Inverse association of estimated cystatin C- and creatinine-based glomerular filtration rate with left ventricular mass: Results from the Study of Health in Pomerania. Int J Cardiol. 2013;167:2786–2791. doi: 10.1016/j.ijcard.2012.07.011. [DOI] [PubMed] [Google Scholar]
- 118.Cacciapuoti F. Molecular mechanisms of left ventricular hypertrophy (LVH) in systemic hypertension (SH)-possible therapeutic perspectives. J Am Soc Hypertens. 2011;5:449–455. doi: 10.1016/j.jash.2011.08.006. [DOI] [PubMed] [Google Scholar]
- 119.Zhang X, Fang Z, Zhang C, Xia H, Jie Z, Han X, Chen Y, Ji L. Effects of Acarbose on the Gut Microbiota of Prediabetic Patients: A Randomized, Double-blind, Controlled Crossover Trial. Diabetes Ther. 2017;8:293–307. doi: 10.1007/s13300-017-0226-y. [DOI] [PMC free article] [PubMed] [Google Scholar]
- 120.Bergstrand LH, Cardenas E, Holert J, Van Hamme JD, Mohn WW. Delineation of Steroid-Degrading Microorganisms through Comparative Genomic Analysis. MBio. 2016;7:e00166. PMID:26956583. [DOI] [PMC free article] [PubMed] [Google Scholar]
- 121.Rajilić-Stojanović M, de Vos WM. The first 1000 cultured species of the human gastrointestinal microbiota. FEMS Microbiol Rev. 2014;38:996–1047. doi: 10.1111/1574-6976.12075. [DOI] [PMC free article] [PubMed] [Google Scholar]
- 122.Lombardi P, Goldin B, Boutin E, Gorbach SL. Metabolism of androgens and estrogens by human fecal microorganisms. J Steroid Biochem. 1978;9:795–801. doi: 10.1016/0022-4731(78)90203-0. [DOI] [PubMed] [Google Scholar]
- 123.Petriz BA, Castro AP, Almeida JA, Gomes CP, Fernandes GR, Kruger RH, Pereira RW, Franco OL. Exercise induction of gut microbiota modifications in obese, non-obese and hypertensive rats. BMC Genomics. 2014;15:511. doi: 10.1186/1471-2164-15-511. PMID:24952588. [DOI] [PMC free article] [PubMed] [Google Scholar]
- 124.Dostal A, Chassard C, Hilty FM, Zimmermann MB, Jaeggi T, Rossi S, Lacroix C. Iron depletion and repletion with ferrous sulfate or electrolytic iron modifies the composition and metabolic activity of the gut microbiota in rats. J Nutr. 2012;142:271–277. doi: 10.3945/jn.111.148643. [DOI] [PMC free article] [PubMed] [Google Scholar]
- 125.Wang J, Tang H, Zhang C, Zhao Y, Derrien M, Rocher E, van-Hylckama Vlieg JE, Strissel K, Zhao L, Obin M, Shen J. Modulation of gut microbiota during probiotic-mediated attenuation of metabolic syndrome in high fat diet-fed mice. Isme j. 2015;9:1–15. doi: 10.1038/ismej.2014.99. PMID:24936763. [DOI] [PMC free article] [PubMed] [Google Scholar]
- 126.Derrien M, Vaughan EE, Plugge CM, de Vos WM. Akkermansia muciniphila gen. nov., sp. nov., a human intestinal mucin-degrading bacterium. Int J Syst Evol Microbiol. 2004;54:1469–1476. doi: 10.1099/ijs.0.02873-0. [DOI] [PubMed] [Google Scholar]
- 127.Shin NR, Lee JC, Lee HY, Kim MS, Whon TW, Lee MS, Bae JW. An increase in the Akkermansia spp. population induced by metformin treatment improves glucose homeostasis in diet-induced obese mice. Gut. 2014;63:727–735. doi: 10.1136/gutjnl-2012-303839. [DOI] [PubMed] [Google Scholar]
- 128.Weiss ST. Eat dirt–the hygiene hypothesis and allergic diseases. N Engl J Med. 2002;347:930–931. doi: 10.1056/NEJMe020092. [DOI] [PubMed] [Google Scholar]
- 129.Morrison DJ, Preston T. Formation of short chain fatty acids by the gut microbiota and their impact on human metabolism. Gut Microbes. 2016;7:189–200. doi: 10.1080/19490976.2015.1134082. [DOI] [PMC free article] [PubMed] [Google Scholar]
- 130.den Besten G, van Eunen K, Groen AK, Venema K, Reijngoud DJ, Bakker BM. The role of short-chain fatty acids in the interplay between diet, gut microbiota, and host energy metabolism. J Lipid Res. 2013;54:2325–2340. doi: 10.1194/jlr.R036012. [DOI] [PMC free article] [PubMed] [Google Scholar]
- 131.Nicholson JK, Holmes E, Kinross J, Burcelin R, Gibson G, Jia W, Pettersson S. Host-gut microbiota metabolic interactions. Science. 2012;336:1262–1267. doi: 10.1126/science.1223813. [DOI] [PubMed] [Google Scholar]
- 132.Fernandes J, Su W, Rahat-Rozenbloom S, Wolever TM, Comelli EM. Adiposity, gut microbiota and faecal short chain fatty acids are linked in adult humans. Nutr Diabetes. 2014;4:e121. doi: 10.1038/nutd.2014.23. PMID:24979150. [DOI] [PMC free article] [PubMed] [Google Scholar]
- 133.Puddu A, Sanguineti R. Evidence for the gut microbiota short-chain fatty acids as key pathophysiological molecules improving diabetes. 2014;2014:162021. [DOI] [PMC free article] [PubMed] [Google Scholar]
- 134.Schwiertz A, Taras D, Schafer K, Beijer S, Bos NA, Donus C, Hardt PD. Microbiota and SCFA in lean and overweight healthy subjects. Obesity (Silver Spring). 2010;18:190–195. doi: 10.1038/oby.2009.167. [DOI] [PubMed] [Google Scholar]
- 135.Wolever TM, Brighenti F, Royall D, Jenkins AL, Jenkins DJ. Effect of rectal infusion of short chain fatty acids in human subjects. Am J Gastroenterol. 1989;84:1027–1033. [PubMed] [Google Scholar]
- 136.Alcock J, Lin HC. Fatty acids from diet and microbiota regulate energy metabolism. F1000Res. 2015;4:738. PMID:27006755. [DOI] [PMC free article] [PubMed] [Google Scholar]
- 137.Laugerette F, Furet JP, Debard C, Daira P, Loizon E, Geloen A, Soulage CO, Simonet C, Lefils-Lacourtablaise J, Bernoud-Hubac N, et al.. Oil composition of high-fat diet affects metabolic inflammation differently in connection with endotoxin receptors in mice. Am J Physiol Endocrinol Metab. 2012;302:E374−386. doi: 10.1152/ajpendo.00314.2011. [DOI] [PubMed] [Google Scholar]
- 138.Espinar MJ, Miranda IM, Costa-de-Oliveira S, Rocha R, Rodrigues AG, Pina-Vaz C. Urinary Tract Infections in Kidney Transplant Patients Due to Escherichia coli and Klebsiella pneumoniae-Producing Extended-Spectrum beta-Lactamases: Risk Factors and Molecular Epidemiology. PLoS One. 2015;10:e0134737. doi: 10.1371/journal.pone.0134737. PMID:26237422. [DOI] [PMC free article] [PubMed] [Google Scholar]
- 139.Evans CC, LePard KJ, Kwak JW, Stancukas MC, Laskowski S, Dougherty J, Moulton L, Glawe A, Wang Y, Leone V, et al.. Exercise prevents weight gain and alters the gut microbiota in a mouse model of high fat diet-induced obesity. PLoS One. 2014;9:e92193. doi: 10.1371/journal.pone.0092193. PMID:24670791. [DOI] [PMC free article] [PubMed] [Google Scholar]
- 140.Bressa C, Bailén-Andrino M, Pérez-Santiago J, González-Soltero R, Pérez M, Montalvo-Lominchar MG, Maté-Muñoz JL, Domínguez R, Moreno D, Larrosa M. Differences in gut microbiota profile between women with active lifestyle and sedentary women. PLoS One. 2017;12:e0171352. doi: 10.1371/journal.pone.0171352. PMID:28187199. [DOI] [PMC free article] [PubMed] [Google Scholar]
- 141.Marques M, Rodrigues S, Mariz E, Pinto J, Videira T, Brito J, Reis C, Simoes-Ventura F, Magro F. Severe gram positive bacterial infection in an ulcerative colitis patient treated with Infliximab. J Crohns Colitis. 2010;4:110–113. doi: 10.1016/j.crohns.2009.08.005. [DOI] [PubMed] [Google Scholar]
- 142.Cummings JH, Macfarlane GT, Macfarlane S. Intestinal bacteria and ulcerative colitis. Curr Issues Intest Microbiol. 2003;4:9–20. [PubMed] [Google Scholar]
- 143.Nakanishi Y, Sato T, Ohteki T. Commensal Gram-positive bacteria initiates colitis by inducing monocyte/macrophage mobilization. Mucosal Immunol. 2015;8:152–160. doi: 10.1038/mi.2014.53. [DOI] [PubMed] [Google Scholar]
- 144.Gomez de Aguero M, Ganal-Vonarburg SC, Fuhrer T, Rupp S, Uchimura Y, Li H, Steinert A, Heikenwalder M, Hapfelmeier S, Sauer U, et al.. The maternal microbiota drives early postnatal innate immune development. Science. 2016;351:1296–1302. doi: 10.1126/science.aad2571. [DOI] [PubMed] [Google Scholar]
Associated Data
This section collects any data citations, data availability statements, or supplementary materials included in this article.
Supplementary Materials
Data Availability Statement
The data generated and analyzed during this study are included in this manuscript and its supplementary information files.