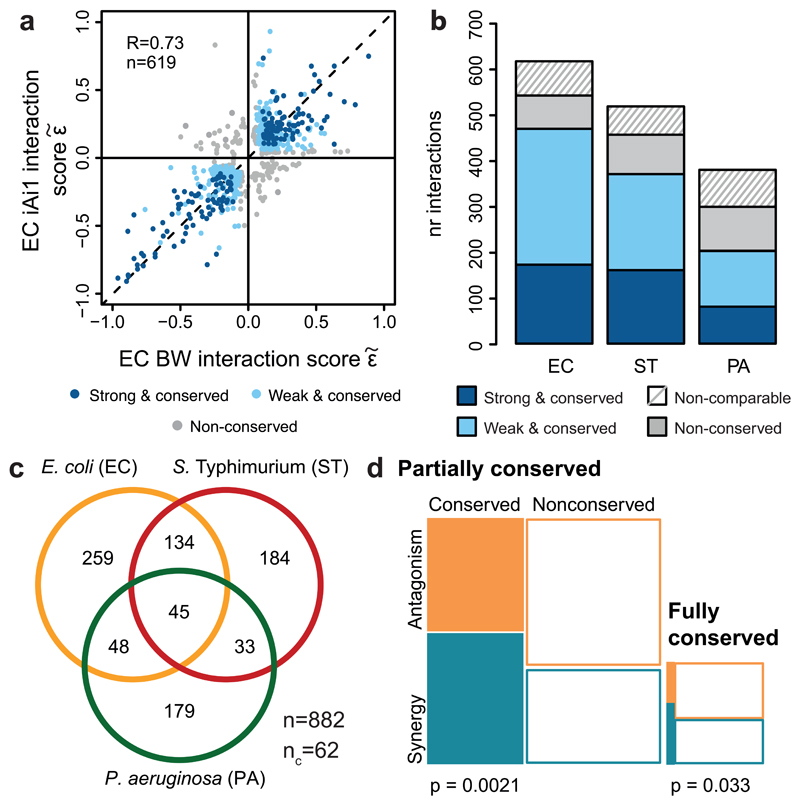
Figure 2. Drug-drug interaction conservation.
a) Drug-drug interactions are conserved in E. coli. Scatter plot of interaction scores from the two E. coli strains; significant interactions for at least one of the strains are shown. Dark blue: strong and conserved interactions in both strains; light blue: strong interactions in one strain and concordant behavior in other (weak and conserved); grey: interactions occurring exclusively in one strain or conflicting between strains (non-conserved). R denotes the Pearson correlation, n the number interactions plotted. b) Drug-drug interactions are highly conserved within species. Colors as in a; non-comparable refers to combinations that have significantly different single drug dose responses between strains (Methods). c) Drug-drug interactions are largely species-specific; n = total number of interactions; nc = conflicting interactions between species, not accounted for in Venn diagram. d) Synergies are more conserved than antagonisms. Mosaic plots and Chi-squared test p-values show the quantification of synergy and antagonism among conserved (fully and partially) and non-conserved interactions between species.

