

SUMMARY
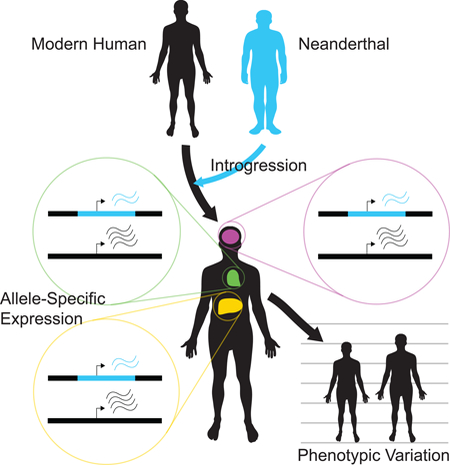
Regulatory variation influencing gene expression is a key contributor to phenotypic diversity, both within and between species. Unfortunately, RNA degrades too rapidly to be recovered from fossil remains, limiting functional genomic insights about our extinct hominin relatives. Many Neanderthal sequences survive in modern humans due to ancient hybridization, providing an opportunity to assess their contributions to transcriptional variation and test hypotheses about regulatory evolution. We developed a flexible Bayesian statistical approach to quantify allele-specific expression (ASE) in complex RNA-seq datasets. We identified widespread expression differences between Neanderthal and modern human alleles, indicating pervasive cis-regulatory impacts of introgression. Brain regions and testes exhibited significant downregulation of Neanderthal alleles relative to other tissues, consistent with natural selection influencing the tissue-specific regulatory landscape. Our study demonstrates that Neanderthal- inherited sequences are not silent remnants of ancient interbreeding, but have measurable impacts on gene expression that contribute to variation in modern human phenotypes.
Keywords: allele-specific expression, gene regulation, archaic hominin, introgression, gene flow, evolution, RNA-seq
Graphical Abstract
INTRODUCTION
The sequencing of the Neanderthal genome revealed that approximately 2% of the ancestry of each non-African modern human traces to ancient gene flow from Neanderthals (Green et al., 2010; Prüfer et al., 2014). Recent studies have extended this observation by developing approaches to identify Neanderthal-inherited haplotypes in individual modern human genomes from globally diverse populations (Vernot et al., 2014; Sankararaman et al., 2014; Vernot et al., 2016). Many of these sequences encompass protein-coding genes and other functional genomic features, raising the intriguing possibility that they may influence variation in modern human traits. Lending support to this hypothesis, several introgressed haplotypes overlap annotated hits from published genome-wide association studies (Sankararaman et al., 2014). Furthermore, a recent analysis of electronic medical records presented evidence that Neanderthal alleles are associated with a range of clinical traits, including depression, actinic keratosis, hypercoagulation, and tobacco use (Simonti et al., 2016). While these studies suggest phenotypes that may be impacted by past hybridization, the functional mechanisms by which these associations arise remain poorly characterized. Regulatory variation influencing gene expression is a key source of phenotypic variation within and between species (King and Wilson, 1975). We thus sought to characterize the functional legacy of ancient gene flow by systematically investigating the contribution of Neanderthal-introgressed sequence to the landscape of modern human cis-regulatory variation.
A powerful approach for detecting and quantifying the impacts of cis-regulatory variation is to test for allelic differences in transcript abundance for individuals heterozygous at transcribed polymorphisms (Yan et al., 2002; Skelley et al., 2009; Figure 1a). By contrasting counts of reads supporting each allele within heterozygous individuals, this approach is less susceptible than expression quantitative trait locus (eQTL) mapping to batch effects and other confounding variables. While sophisticated methods have been developed to detect ASE in a single sample (Skelley et al., 2009), across individuals (van de Geijn et al., 2015), or across tissues (Pirinen et al., 2015), no generalized approach has been developed to combine all information simultaneously. Integrating this information is complicated, however, by the complex structure of large- scale RNA-seq datasets such as Genotype-Tissue Expression (GTEx) Project (GTEx Consortium, 2015), wherein many individuals are sampled across many tissues, alleles vary in frequency, and genes vary in expression level across individuals and tissues. These challenges require a flexible method that capitalizes on the wealth of information contained in such complex data structures. To this end, we developed a Bayesian generalized linear mixed model (GLMM) approach (Figure 1a; STAR Methods) to combine expression data to estimate allele-specific effects, augmenting statistical power by integrating information across multiple individuals and tissues (Figure 1b). Applying this method on a genome-wide scale to the GTEx dataset (214 individuals, 52 tissues) revealed abundant cis-regulatory effects of Neanderthal-introgressed sequences and evidence of tissue-specific variation in regulatory divergence.
Figure 1. Schematic describing the method of detecting allele-specific expression (ASE) of Neanderthal-introgressed haplotypes.
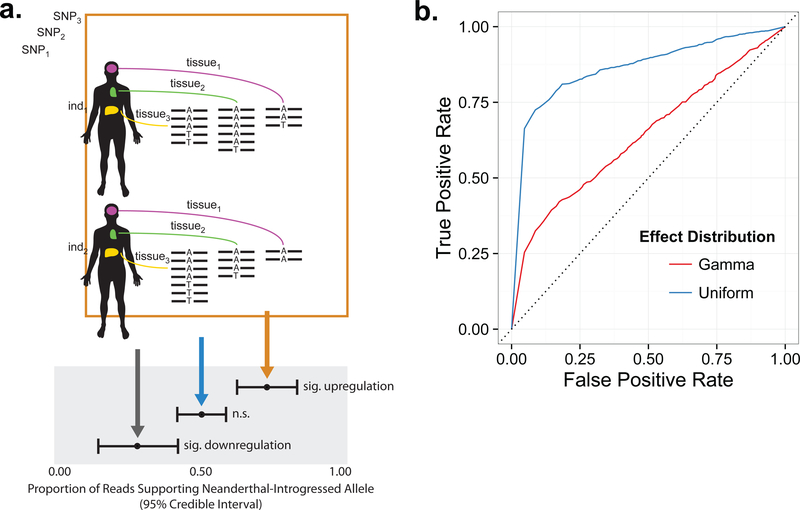
(a) We identified expressed variants (SNPi) that tag Neanderthal haplotypes and examined their expression across multiple tissues (tissuej) in heterozygous individuals (indk) from the GTEx dataset. (b) Receiver operating characteristic (ROC) curves for the Bayesian GLMM fit to data simulated under gamma (red) and uniform (blue) distributions of allelic effect sizes (see STAR Methods).
RESULTS AND DISCUSSION
Allele specific expression of Neanderthal-introgressed sequences
Within the GTEx dataset, we identified 5055 transcribed single nucleotide polymorphisms (SNPs) that tag Neanderthal-introgressed haplotypes (2034 genes; Figure S1). Across all samples and tissues, these SNPs comprised a total of 259,338 heterozygous (i.e. one modern human and one Neanderthal-introgressed allele) observations. As a control, we compared these data to 581,124 non-introgressed SNPs in 26,437 genes (52,040,533 total heterozygous observations) across the same set of samples.
Applying our statistical framework to the GTEx data identified 1236 introgressed SNPs (24.5%) in 767 genes that showed significant ASE at a false discovery rate (FDR) of 10% (Figure 2; Figure S2). Introgressed SNPs showing significant ASE were significantly enriched for directionally-concordant single-tissue eQTL identified in previous GTEx analyses (Fisher’s Exact Test: OR = 2.51, 95% CI [2.06, 3.06], P < 1 × 10⁻¹⁰), as were non-introgressed SNPs showing significant ASE (Fisher’s Exact Test: OR = 2.40, 95% CI [2.36, 2.44], P < 1 × 10⁻¹⁰). The magnitude of enrichment was greatest at low minor allele frequencies, reflecting the fact that rare variants must have large effects to be called as significant eQTL and are thus more likely to show concordant ASE (Figure S3). Of introgressed SNPs showing concordant ASE and eQTL effects, 80% fall within an eGene whose lowest p-value SNP has an alternative allele that matches an Altai Neanderthal allele, supporting the ability of our analysis to tag potential causal regulatory variants of Neanderthal-introgressed origin. Most of the remaining 20% are also expected to be Neanderthal in origin, with mismatches attributable to diversity within and between the introgressing Neanderthal and Altai Neanderthal populations.
Figure 2. Allelic effect estimates for Neanderthal-introgressed variants.
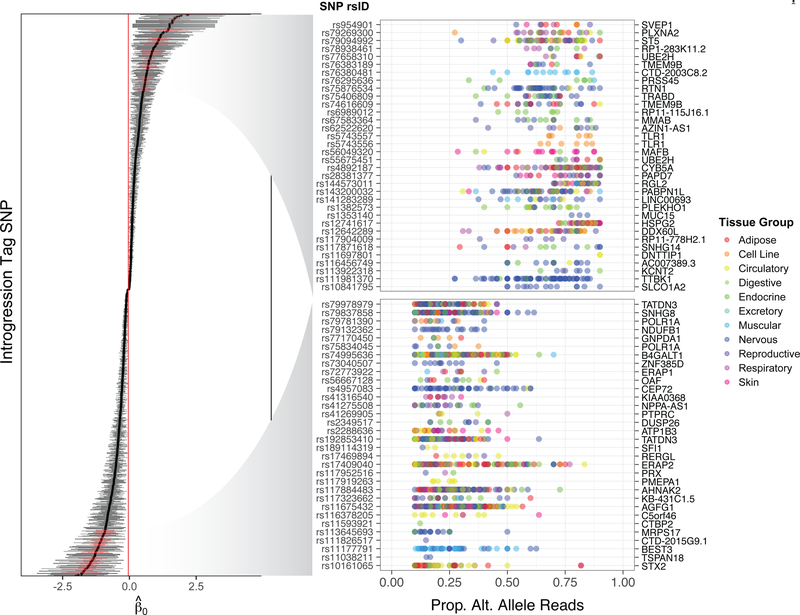
Estimates for 1236 Neanderthal tag SNPs exhibiting significant ASE at 10% FDR. Error bars indicate 95% credible intervals. The right panel depicts allelic imbalance at selected SNPs (highlighted in red) showing strongest evidence of ASE (lowest posterior predictive p-values in each tail [P < 1 × 10⁻⁵]). Each point represents one sample and is color-coded according to tissue group to convey the diversity of tissue expression patterns. See also Figure S2 and Table S2.
We observed that the Neanderthal allele was upregulated for 49.8% and downregulated for 50.2% of SNPs showing significant ASE, indicating no overall directional bias (binomial test: 95% CI [0.469, 0.526], P = 0.887). Notable examples of variants exhibiting extreme ASE include linked SNPs (r2 = 1.0) rs73236617, rs3924112, rs5743557, and rs5743556 in TLR1, an innate immunity gene previously suggested to be a target of adaptive introgression (Danneman et al., 2016; Gittelman et al., 2016; Quach et al., 2016; Nédélec et al., 2016). The Neanderthal haplotype is associated with significantly increased expression of TLR1 (rs5743557, binomial GLMM: β = 1.122, 95% CI [0.708, 1.563], P = 5.50 × 10⁻⁹, MAFEUR = 0.221), consistent with recent eQTL results from Danneman et al. (2016).
Several additional introgressed variants exhibiting significant ASE were previously linked to human disease traits in published genome-wide association studies (GWAS), suggesting potential cis-regulatory mechanisms underlying these associations. In total, we identified 8 Neanderthal regulatory variants associated with 9 distinct phenotypes, including rs3765107 (binomial GLMM: β = −0.428, 95% CI [−0.475, −0.384], P < 1 × 10⁻¹⁰, MAFEUR = 0.111), which lies within the lysosomal transporter- encoding gene SLC15A4 and is associated with systemic lupus erythematosus (Table 1; Han et al., 2009). SLC15A4 is required for endosomal Toll-like receptor (TLR) signaling and secretion of proinflammatory cytokines by plasmacytoid dendritic cells (Blasius et al., 2010). This example thus adds to growing evidence that Neanderthal introgression contributed to risk of autoimmune disorders (Sankararaman et al., 2014) and innate immune response (Quach et al., 2016; Nédélec et al., 2016).
Table 1. Neanderthal-introgressed haplotypes are associated with modern human phenotypes.
Negative values of indicate downregulation of Neanderthal alleles, while positive values indicate upregulation.
| Tag SNP | ASE P | Gene Symbol | GWAS P | Phenotype | |
|---|---|---|---|---|---|
| rs950169 | −0.413 | < 1 × 10⁻¹⁰ | ADAMTSL3 | 6 × 10⁻²³ 2 × 10⁻¹¹ |
height schizophrenia |
| rs72705102 | −0.813 | < 1 × 10⁻¹⁰ | CEP72 | 4 × 10⁻¹¹ | cystic fibrosis lung function |
| rs3765107 | −0.428 | < 1 × 10⁻¹⁰ | SLC15A4 | 2 × 10⁻¹¹ | systemic lupus erythematosus |
| rs5744258 | 0.474 | 1.89 × 10⁻⁹ | IL18 | 1 × 10⁻⁸ | IL18 levels |
| rs61854810 | −1.504 | 0.00264 | 2 × 10⁻¹⁰ | optic disc size | |
| rs2235371 | −0.146 | 0.0127 | IRF6 | 1 × 10⁻¹⁴ | cleft lip |
| rs10418340 | −0.103 | 0.0212 | CEP89 | 5 × 10⁻¹¹ | serum creatinine levels |
| rs35370743 | −0.120 | 7.17 × 10⁻⁶ | INTS12 | 1 × 10⁻¹⁶ | pulmonary function (interaction with smoking) |
Disease-associated Neanderthal regulatory variants furthermore reveal how hybridization contributed to the genomic complexity of modern humans. These include rs950169, a SNP in extracellular matrix protein ADAMTSL3 that is significantly associated with both height (Table 1; Wood et al., 2014) and schizophrenia risk (Table 1; Schizophrenia Working Group of the Psychiatric Genomics Consortium, 2014). In the GTEx data, rs950169 shows tissue-wide downregulation of the Neanderthal- introgressed allele (binomial GLMM: β = −0.413, 95% CI [−0.463, −0.362], P < 1 × 10⁻¹⁰, MAFEUR = 0.273), though a SNP on the same haplotype (rs2135551, r2 = 1.0) shows nearly balanced expression of the two alleles (binomial GLMM: β = −0.020, 95% CI [- 0.030, 0.073], P = 0.0151, MAFEUR = 0.273). This pattern is consistent with a model of splicing regulation proposed by Need et al. (2009), which provides a detailed mechanistic explanation for the observed ASE. Specifically, the Neanderthal allele introduces a splice acceptor site in exon 30 (Figure 3), resulting in alternative splicing and truncation of the protease and lacunin (PLAC) domain encompassing rs950169.
Figure 3. Introgression introduced functional variants with complex regulatory effects.
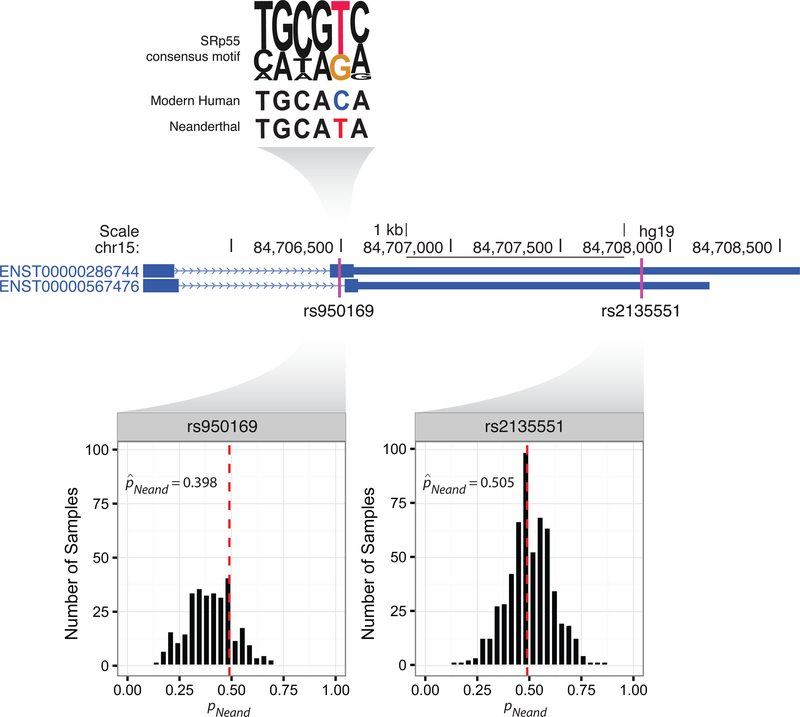
Height and schizophrenia-associated introgression tag SNP (rs950169) in ADAMTSL3 shows evidence of ASE mediated by an effect on splicing regulation. The Neanderthal-introgressed (T) allele of this variant is predicted to increase binding of the SRp55 splicing factor compared to the modern human (C) allele and splice out a portion of exon 30 containing the SNP itself. Patterns of ASE (histograms) are consistent with this model of splicing regulation. The SRp55 consensus motif was obtained from http://krainer01.cshl.edu/tools/ESE2/ESEmatrix.html (Liu et al., 1998).
Introgressed variants are not enriched for regulatory effects
Recent theoretical work predicts that Neanderthals suffered a high load of weakly deleterious mutations accumulated during extended population bottlenecks (Harris and Nielsen, 2016). Assuming additive fitness effects, this mutational burden was estimated to have reduced Neanderthal fitness by at least 40% compared to modern humans (Harris and Nielsen, 2016). Under this model, deleterious haplotypes introgressed into larger modern human populations would have been subject to strong selection during the first ~20 generations after hybridization—a prediction with growing empirical support from genetic data (Sankararaman et al., 2014; Vernot et al., 2016; Currat and Excoffier, 2011; Sankararaman et al., 2016). Nevertheless, many weakly deleterious variants (s < x 10−4) are predicted to persist in present-day human populations, with a cumulative impact comparable to that of the Out-of-Africa bottleneck (Harris and Nielsen, 2016). As many of these deleterious mutations presumably influence gene regulation, we hypothesized that Neanderthal-introgressed variants may be enriched for ASE compared to segregating mutations that arose in modern humans. We therefore contrasted the proportions of introgressed and non-introgressed variants exhibiting significant ASE, stratifying by derived allele frequency to control for power differences (see STAR Methods). Within frequency bins, we found no significant differences between the proportions of introgressed and non-introgressed SNPs exhibiting ASE (Figure 4b). This finding suggests that purifying selection after introgression has largely equalized the frequencies of introgressed and non-introgressed regulatory variants with similar magnitudes of allelic effects.
Figure 4. Evidence of purifying selection on introgressed regulatory variation.
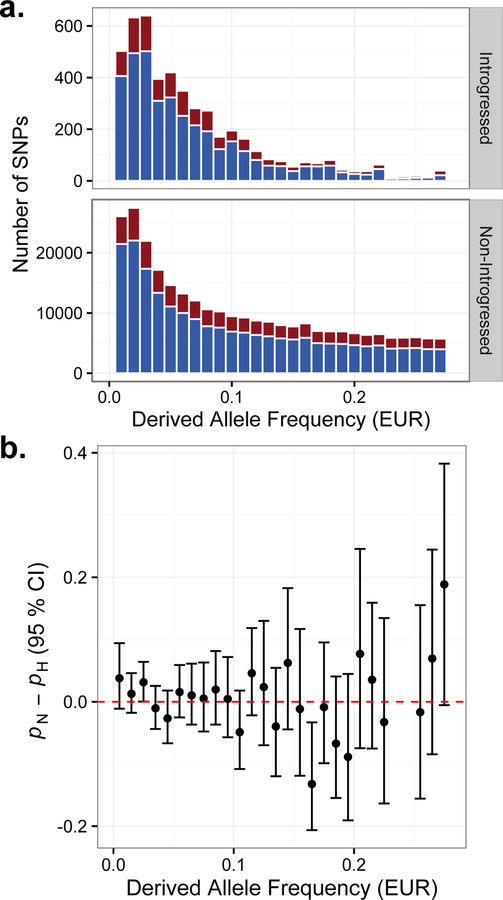
(a) Allele frequency spectra of variants tagging Neanderthal-introgressed haplotypes (upper panel) and non-introgressed variants (bottom panel). SNPs with significant ASE are plotted in red, and while non-significant SNPs are plotted in blue in the stacked histograms. (b) No significant differences in the estimated proportions of introgressed (pN) and non-introgressed (pH) variants showing significant ASE (at 10% FDR), stratified by derived allele frequency. Error bars indicate 95% credible intervals.
Brain sub-regions show downregulation of Neanderthal alleles
The model for detecting ASE described above effectively averages information across tissues. To test more fine-scaled regulatory hypotheses, we therefore extended our mixed model approach to consider all introgressed SNPs together and examine whether the direction of ASE varied among tissues. A model including tissue parameters was favored over a reduced model without this term (ΔWAIC = 150; χ2(df = 51) = 281.3, P < 10−10), indicating significant differences across tissues (Figure 5a; see STAR Methods). Contributing to this result, we observed a striking bias toward downregulation of Neanderthal alleles in the brain and testes (Figure 5a). This observation was robust when limiting the analysis to 1) common variants with derived allele frequency >5% and 2) variants that were also called as eQTL in one or more tissue based on published GTEx data, together suggesting that linked rare variants do not drive the effect (Figure S4). Brain regions had significantly lower expression of Neanderthal alleles (binomial GLMM: β = −0.0168, 95% CI [−0.0200, −0.0136], P < 10−10) than non-brain tissues, particularly in the neuron-rich cerebellum (BRNCHA) and basal ganglia regions (BRNCDT, BRNPTM, BRNNCC). Supporting analyses confirmed that this effect was not driven by reference mapping bias, as Neanderthal haplotypes of brain-expressed genes have lower levels of divergence with the human reference genome than genes expressed in other tissues (Figure S6). This level of downregulation is exceptional, as equal-sized samples of non-introgressed SNPs matched for sample sizes of individuals and tissues showed no such bias (P < 1 × 10⁻³). Further consistent with these data, brain regions including the cerebellum were enriched for significantly downregulated compared to significantly upregulated Neanderthal SNPs (binomial test [BRNCHA]: P = 1.7 × 10⁻⁴; Figure 5b; Table S1). Significant downregulation of introgressed alleles in the brainis particularly remarkable given the previous observation by the GTEx Consortium that brain-expressed genes show less ASE overall, a finding which was attributed to reduced levels of genetic diversity in this gene set (GTEx Consortium, 2015).
Figure 5. The impact of Neanderthal introgression on ASE varies across tissues.
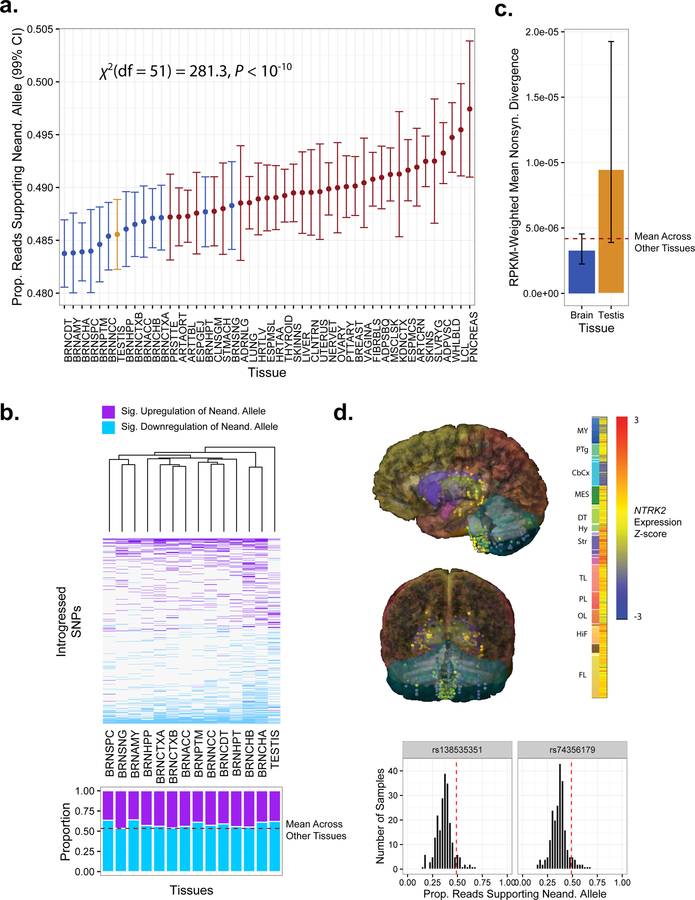
(a) Model estimates of the proportion of reads supporting the Neanderthal allele per tissue (see Table S2 for tissue abbreviations). Tissues with fewer than 10 samples are excluded. (b) Heatmap (upper panel) of SNPs showing significant ASE in the testes or at least one brain region. Purple cells indicate significant upregulation of the Neanderthal allele, while blue cells indicate significant downregulation. The lower panel contrasts the proportions of up- and downregulation for all SNPs with significant ASE in that tissue. (c) Tissue-specific expression-weighted levels of nonsynonymous divergence per site between the human reference and Altai Neanderthal genomes. Error bars indicate 95% confidence intervals. (d) Expression of NTRK2 (probe A_23_P216779), a brain-specific gene exemplifying the pattern of downregulation of Neanderthal-introgressed alleles. Sagittal (left panel) and coronal (right panel) views of NTRK2 expression profile from donor H0351.2002 in the Allen Human Brain Atlas (Hawrylycz et al., 2012). NTRK2 is broadly expressed across brain tissues, with somewhat elevated expression in the basal ganglia and reduced expression in the cerebellar cortex, as indicated by expression Z-scores across samples from different brain tissues. Histograms (lower panel) demonstrate that Neanderthal haplotype- tagging SNPs in NTRK2 exhibit allele-specific expression biased against the introgressed allele. See also Figures S4, S5, S6, S7, and Tables S1 and S2.
One brain-specific gene that exemplifies this pattern of downregulation is NTRK2 (Figure 5d), which encodes a neurotrophic tyrosine receptor kinase that regulates neuron survival and differentiation as well as synapse formation (Nakagawara, 2001). This gene contains a pair of adjacent Neanderthal tag SNPs, heterozygous in 22 individuals, which show strong signatures of downregulation (rs138535351, binomial GLMM: β = −0.542, 95% CI [−0.604, −0.480], P < 10−10, MAFEUR = 0.037; rs74356179, binomial GLMM: β = −0.554, 95% CI [−0.615, −0.493], P < 10−10; MAFEUR = 0.037). Mutations and polymorphisms in this gene have been associated with a range of neuropsychiatric and neurological disorders including depression (Juhasz et al., 2011), suicide attempts (Murphy et al., 2008; Kohli et al., 2010), impaired speech and language development (Yeo et al., 2004), severe obesity (Gray et al., 2007), autism (Correia et al., 2010), obsessive-compulsive disorder (Alonso et al., 2008), Alzheimer’s disease (Chen et al., 2008), anorexia nervosa (Ribases et al., 2005), nicotine dependence (Li et al., 2008; Beuten et al., 2007), and pilocytic astrocytoma (Jones et al., 2013). Intriguingly, NTRK2 is among a small set of brain-specific genes whose regulatory domains overlap signatures of modern human selective sweeps that occurred after divergence from Neanderthals (Peyregne et al., 2016).
Morphometric studies of hominin fossils have demonstrated substantial anatomical differences between brains of Neanderthals and modern humans that may be consistent with divergent regulatory evolution targeting this organ. While overall brain size was similar, Neanderthal endocranial capacity was less than that of modern humans when adjusted for body size and size of the visual system (Pearce et al., 2013). Our analysis revealed that downregulation of Neanderthal alleles was especially pronounced in the cerebellum and basal ganglia (Figure 5a). These brain regions have traditionally been associated with motor control and perception, but a broader role in cognitive function—including language processing—and behavior is now appreciated (Booth et al., 2007; Mariën et al., 2014). Intriguingly, the cerebellum has undergone rapid expansion in the great ape lineage (Barton and Venditti, 2014), and modern humans possess proportionally larger cerebella (greater cerebellum to total brain volume ratio) than did Neanderthals (Hublin et al., 2015).
Neanderthal alleles are down-regulated in the testes
Similar to brain-expressed genes, testis-expressed genes exhibited significant downregulation of Neanderthal alleles relative to genes expressed in other tissues (Figure 5a; binomial GLMM: β = −0.0145, 95% CI [−0.0231, −0.0058], P = 0.001). This pattern was again evident in the excess of significantly down- versus upregulated testis- expressed SNPs (binomial test: P = 5.5 × 10⁻⁴; Figure 5b; Table S1) and is unexpected based on equivalent samples of non-introgressed SNPs (P = 0.04). Testis-expressed genes exemplifying the broader pattern of downregulation of Neanderthal alleles include DNALI1 (rs41267319, binomial GLMM: β = −0.476, 95% CI [−0.519, −0.432], P < 10−10, MAFEUR = 0.055), which encodes an axonemal dynein protein that functions in the sperm flagella. Highlighting the potential fitness consequences of introgression on testis-expressed genes, altered regulation of this gene set has been shown to contribute to hybrid incompatibility in other species (Turner and Harr, 2014). Consistent with this observation, genes with high expression in the testes are significantly depleted of Neanderthal ancestry, suggesting that purifying selection disproportionately removed Neanderthal haplotypes at these genes following introgression (Sankararaman et al., 2014). This finding is also consistent with the hypothesis that male hybrid individuals may have incurred reduced fertility (Sankararaman et al., 2014; Currat and Excoffier, 2011; Sankararaman et al., 2016).
Tissue-specific effects of individual introgressed variants
Of 3401 introgressed SNPs expressed in more than one tissue, we identified only SNPs showing strong evidence of tissue heterogeneity of ASE (Bayes factor [BF] > 10) and 9 additional SNPs showing weak to moderate evidence (1 < BF < 10). The paucity of SNPs exhibiting large effects is consistent with previous studies showing that cis-regulatory effects are generally consistent across tissues and experimental conditions (Price et al., 2011). While we note that power to detect heterogeneity for any individual SNP may be limited, this finding also implies that the tissue-specific patterns we previously observed are largely attributable to genes differentially expressed among tissues. Indeed, introgressed SNPs with more total read counts in brain than non-brain tissues (i.e. genes differentially expressed in the brain) had lower representation of Neanderthal alleles than other SNPs, even when limiting the analysis to non-brain samples (binomial GLMM: β = −0.0227, 95% CI [−0.0421, −0.0033], P = 0.022). The small set of variants displaying strong effects is nevertheless intriguing. The most extreme example (BF = 3.01 × 10⁹) is rs746885 (MAFEUR = 0.055) in the apelin receptor gene (APLNR). This variant exhibits strong ASE favoring the Neanderthal allele in brain tissues (binomial GLMM: β = 0.631, 95% CI [0.470, 0.791], P = 1.48 × 10⁻⁹), but ASE favoring the modern human allele in non-brain tissues (binomial GLMM: β = −0.340, 95% CI [−0.491, −0.191], P = 3.06 × 10⁻⁴). Apelin is a signal peptide that influences several aspects of cardiac, digestive, brain, and vascular function, including regulation of oxygen levels. The peptide and its receptor encoded by APLNR have been implicated in cardiovascular disease (Yu et al., 2014) and regulation of fluid homeostasis (O’Carroll et al., 2013).
Models of tissue-specific regulatory divergence
We propose that downregulation of Neanderthal alleles in brain- and testes- expressed genes may be explained by elevated rates of regulatory divergence affecting these tissues. Regulatory divergence may manifest as gene expression divergence, but expression divergence is not necessary in the case of compensatory co-evolution between cis- and trans-elements of regulatory circuits (Landry et al., 2005). When Neanderthal cis-regulatory elements introgressed into the modern human trans- regulatory background, genes may have failed to be expressed at the same level as in their native regulatory environments (Figure 6). Such epistasis between cis- and trans- acting factors is well documented in nature, can arise rapidly as a consequence of selection on gene regulation, and is known to contribute to hybrid incompatibilities (Mack & Nachman, 2017). We note, however, that the functional epistasis invoked by our model need not affect fitness and is presumably much more common than the fitness epistasis contributing to hybrid dysfunction. While misregulation due to epistasis may also lead to increased expression, decreased expression may be more common, as recently concluded by Guerrero et al. (2016) who found significant downregulation of introgressed genes in nightshade plants. Global downregulation compared to parental strains has also been documented for Drosophila interspecific F1 hybrids (Michalak et al., 2003) and was specifically enriched among male reproductive genes, which are known to experience rapid divergence in both sequence and gene expression (Brawand et al., 2011). More recent work on heterospecific introgression in fertile Drosophila found comparable levels of downregulation of autosomal introgressed spermatogenesis-related genes, which were similarly attributed to regulatory incompatibilities (Ferguson et al., 2013). Elevated regulatory divergence in the brain— especially neuron-rich sub-regions—is meanwhile supported by enrichment of human- accelerated conserved non-coding sequences for regulation of genes with neuronal activity (Prabhakar et al., 2006; Capra et al., 2013; Gittelman et al., 2015). Furthermore, modern human genomic regions with signatures of ancient selective sweeps, postdating divergence from Neanderthals, are enriched for regulatory elements of brain-expressed genes (Peyrégne et al., 2016).
Figure 6. A model of regulatory incompatibility arising from cis-trans regulatory divergence.
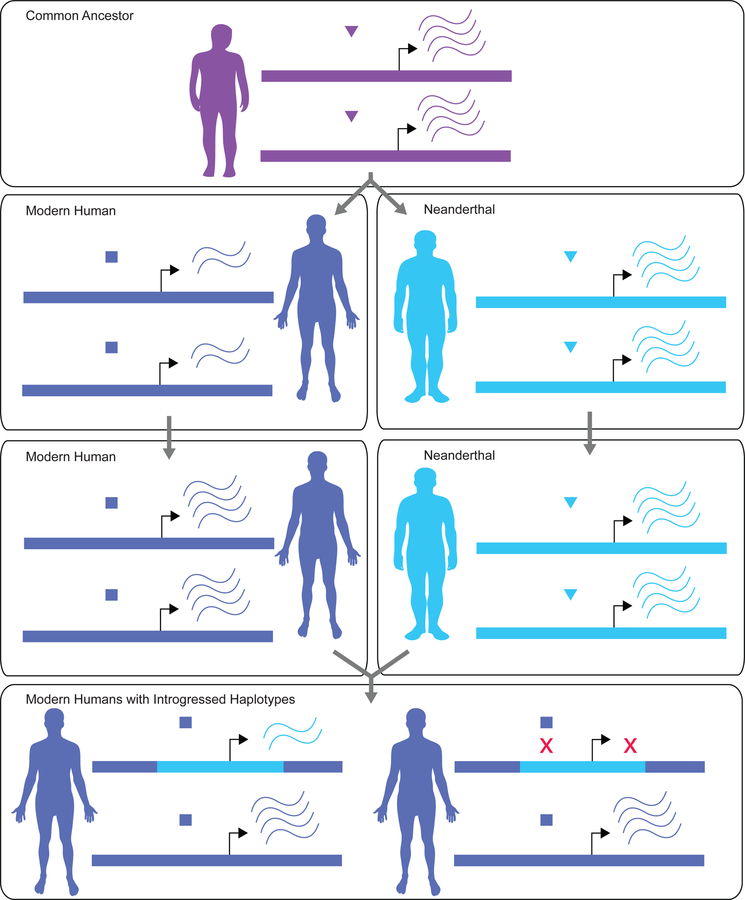
Levels of RNA transcription depend on interactions between trans-acting factors and cis-regulatory regions (e.g. binding of a transcription factor to a gene promoter). Lineage-specific co-evolution between cis- and trans-elements (left panels) of regulatory networks can generate incompatibilities at introgressed loci, potentially leading to reduced transcriptional output (lower panel). In the absence of cis-trans co-evolution, similar incompatibilities can arise due to changes in cis-regulatory elements in one species along with changes in interacting trans-regulatory elements of the other species (reviewed in Mack & Nachman, 2017).
One alternative model to explain our observations is a bias toward upregulation of brain- and testis-expressed genes in the modern human lineage or downregulation of these genes in the Neanderthal lineage. Human-specific upregulation of brain- expressed genes was indeed suggested in several early comparative studies of gene expression (Cáceres et al., 2003), but is now thought to be an artifact of species- specific microarray probes (Gilad et al., 2006). Furthermore, these studies compared expression in humans to extant non-human primates, such that most of the “human- specific” expression divergence is likely to have been shared with Neanderthals.
A second alternative model involves selection to attenuate the expression of deleterious Neanderthal alleles, for example by purging Neanderthal alleles that confer upregulation of genes expressed in the brain or testes. To assess the evidence for this model, we tested whether Neanderthal haplotypes harboring deleterious introgressed variants showed any bias toward downregulation. We detected no significant association between the maximum (binomial GLMM: β = −0.00398, 95% CI [−0.0122, 0.00422], P = 0.338) or mean (binomial GLMM: β = −7.58 × 10⁻⁵, 95% CI [−0.0218, 0.0217], P = 0.989) CADD score (Kircher et al., 2014) of Neanderthal tag SNPs on introgressed haplotypes and the level of downregulation. Neanderthal-introgressed haplotypes possessing missense variants predicted as deleterious with SIFT (Kumar et al., 2009; binomial GLMM: β = 0.00426, 95% CI [−0.0553, 0.0637], P = 0.893) or PolyPhen2 (Adzhubei et al., 2010; binomial GLMM: β = −0.0154, 95% CI [−0.0774, 0.0466], P = 0.622) also showed no significant biases toward downregulation.
One phenomenon potentially complicating our interpretations is that some mutations on introgressed haplotypes arose in the modern human lineage subsequent to admixture. If such variants were to confer regulatory effects, these could drive ASE that we would spuriously attribute to regulatory substitutions that occurred prior to introgression. Based on coalescent theory and reasonable estimates of demographic parameters, we estimate that these recent mutations comprise only 5–10% of all differences between the average introgressed and non-introgressed haplotype (see STAR Methods). This result arises from the fact that introgression occurred recently (~50 kya) relative to the time of divergence between modern humans and Neanderthals (~700 kya). The incorporation of a more complex demographic model including recent human population growth should not qualitatively alter this estimate, as levels of individual variation are relatively insensitive to the resulting excess of rare mutations at the population level (Fu et al., 2014).
Neanderthals went extinct approximately 40,000 years ago, yet much of their DNA lives on in the genomes of modern humans. Our study demonstrates that many of these sequences are functionally significant, contributing to genome complexity and patterns of gene expression variation in modern humans. Together, these data provide the first functional genomic evidence that divergence in the regulatory architecture of modern humans and Neanderthals varied across tissues, with implications for phenotypes that may have distinguished our species.
All results generated by our study can be accessed through an interactive web application that facilitates visualization of ASE patterns at individual loci: https://neanderthal-ase.shinyapps.io/neanderthal_ase. This resource should be useful for experimental studies seeking to map the causal variants underlying these signals as well as further investigation of evolutionary mechanisms driving tissue-specific patterns.
STAR METHODS
Contact for Reagent and Resource Sharing
Further information and requests for resources should be directed to and will be fulfilled by the Lead Contact, Joshua Akey (akeyj@uw.edu).
Experimental Model and Subject Details
All analyses were performed using published RNA-seq data obtained from GTEx Consortium (v6; phs000424.v6.p1), which derive from 53 tissues from 544 deceased individuals, 449 of whom were also genotyped to facilitate eQTL analysis. Information about the donors (gender, ethnicity, age, cause of death) can be found at http://www.gtexportal.org/home/tissueSummaryPage#donorInfo. The donor enrollment, biospecimen acquisition, and the consent process is thoroughly described in Lonsdale et al. (2013) and at https://biospecimens.cancer.gov/resources/sops/library.asp.
Method Details
Overview of GTEx RNA-seq data
RNA-seq data were collected and processed as part of the GTEx Project (GTEx Consortium, 2015; Version 6; dbGaP Accession phs000424.v6.p1). The GTEx Consortium aligned data to the human genome (hg19) using TopHat (Kim et al., 2013) based on GENCODE (Harrow et al., 2012; V19) reference annotations of 57,820 transcribed genes. They then used the GATK (McKenna et al., 2010; v3.4) ASEReadCounter tool (Castel et al., 2015) to tabulate reads supporting each allele at heterozygous sites which were identified based on separate exome sequencing. As reference allele bias has the potential to confound analysis of ASE (Degner et al., 2009), we undertook multiple steps to filter potentially biased sites in accordance with best practices (Castel et al., 2015), as well as confirming the robustness of key results in light of possible residual biases (see below). We further required at least 10 total reads per site per sample and between 10% and 90% of reads supporting the alternative allele (i.e. 10–90% reference ratio). This step eliminates the contribution of erroneous heterozygous genotypes to false ASE signal, but has the side effect of filtering true cases of monoallelic expression (Castel et al., 2015).
Identifying Neanderthal-introgressed haplotypes
Neanderthal-introgressed haplotypes were previously identified (Vernot et al., 2014; Vernot et al., 2016) using the S* approach (Plagnol and Wall., 2006), which detects putative introgressed sequences based on extreme divergence from the human reference and high identity to the Neanderthal reference genome. Tag SNPs were then defined as the set of SNPs that maximized S* on an individual haplotype that was later classified as putatively introgressed from Neanderthals (Vernot et al., 2014; Vernot et al., 2016). S* is a dynamic programming algorithm that enriches for archaic haplotypes before comparing to an archaic genome (Plagnol and Wall, 2006). S*-maximizing SNPs are thus SNPs that define highly divergent haplotypes not present in the African reference population. An S* value for an individual in a 50 Kb window is considered significant if it is in the 99th percentile based on simulations. Putative Neanderthal-introgressed haplotypes are the set of S* significant haplotypes, bounded by the furthest S*-maximizing SNPs that have a significant match to the Neanderthal genome (Vernot et al., 2014; Vernot et al., 2016).
We restricted analysis to the RNA-seq read counts from individuals whose self- reported race was white. We note that these individuals also cluster together when applying principal component analysis (PCA) to a genotype matrix of all samples, indicating that the grouping is biologically meaningful in this case. This subsample was chosen on the basis that 1) Neanderthal ancestry is limited to non-African individuals, 2) introgressed haplotypes and the SNPs tagging those haplotypes were discovered in an ethnically similar population (Vernot et al., 2014; Vernot et al., 2016), and 3) the subsample comprises more than half of the total number of individuals in the GTEx dataset. Of 139,694 SNPs (genic and non-genic) meeting the initial tag-SNP criteria, 5674 SNPs within 2230 unique annotated genes as well as unannotated transcribed regions were observed among the sequences in the filtered GTEx dataset.
To further refine the set of tag SNPs, we used the 1000 Genomes data (1000 Genomes Project Consortium, 2012) to require that the alternative allele at each SNP be nearly fixed (frequency > 0.9) on Neanderthal-introgressed haplotypes and nearly absent (frequency < 0.1) on non-introgressed haplotypes or vice versa (Figure S1), reducing the set to 5055 tag SNPs in 2034 unique genes and unannotated regions. All other SNPs were considered non-introgressed.
Estimating the proportion of recent mutations
Suppose we have identified an individual heterozygous for an introgressed haplotype. We wish to estimate the proportion of variants on the Neanderthal haplotype that arose more recently than introgression, as these are variants that arose in the modern human population. We use a coalescent argument in a simplified demographic model in which introgression occurred tGF coalescent time units ago, and Neanderthals and modern humans share a common ancestor tN coalescent time units ago. Given that the two haplotypes coalesce T time units ago (n.b. T > tN by assumption that the individual is heterozygous for a Neanderthal haplotype), the proportion of variants that arose on the Neanderthal haplotype in the human lineage is simply tGF / T. We then need to integrate over all possible T, noting that
after expanding in a Taylor series about E(T). Under the standard coalescent model, T =tN + THN where THN, the waiting time for coalescence in the human-Neanderthal ancestral population, is distributed exponentially with rate 1. Hence, E(T) = tN + 1 and Var(T) = 1. So, the expected proportion of variants that arose more recently than introgression is approximately
which is expected to be accurate for tGF << tN. Taking tGF to be between 50,000 and 100,000 years ago, tN to be between 500,000 and 800,000 years ago, an effective population size of 10,000, and a generation time of 25 years, we estimate that approximately 4.5 to 10% of the mutations arose in the modern human population.
Generation of figures
Graphs were generated using the ggplot2 (Wickham, 2009) and gplots packages in R.
Quantification and Statistical Analysis
Statistical model to detect ASE
We developed a Bayesian generalized linear mixed model approach to quantify ASE based on RNA-seq counts. The model was implemented using the INLA package (Rue et al., 2009) in the R statistical computing environment (R Core Team, 2015). For the individual SNP analyses, data were subset by SNP and a binomial mixed model was fit with counts of reference and non-reference reads as the outcome variable and random effects of tissue (αt) and subject (γi): logit(pit) = β0 + αt + γi, where pit is the proportion of reads supporting the alternative allele in individual i and tissue t. The posterior probability distribution of the intercept term (β0) was used to quantify the degree of ASE. Confidence intervals were estimated by taking empirical quantiles of these distributions, and two-tailed posterior predictive p-values were calculated based on the areas in the tail more extreme than the null alternative allele ratio. This null ratio (0.4896) was based on the median across all observations (introgressed and non-introgressed) in the filtered dataset. Based on these p-values, we used the Benjamini–Hochberg procedure (Benjamini and Hochberg, 1995) to control the FDR at 10%. Results for a range of FDRs are presented in Figure S2.
When comparing the proportions of SNPs with significantly up-versus downregulated Neanderthal alleles within tissues (Figure 5b), we did not use the FDR procedure, but instead considered variants significant if a 95% credible interval of the marginal posterior distribution of the intercept term did not include the null alternative allele ratio. Direction was then assessed by considering whether the Neanderthal allele matched the reference or alternative allele at each SNP.
Evaluating the method using simulation
To evaluate the sensitivity and specificity of our statistical method, we simulated alternative allele read counts by sampling from the total read counts in the observed data. This approach maintains important structure of the data: sample sizes of individuals, sample sizes of tissues, allele frequencies, and gene expression patterns. We performed simulation under two different distributions of allelic effects (proportion of alternative alleles), rescaled to the interval (0.5, 1): a gamma distribution (shape and scale parameters of 1) and a uniform distribution. While the true distribution of effect sizes is unknown, we suspect that it more closely resembles the gamma distribution, with many regulatory variants of small effect. We then logit transformed these effect sizes and added tissue-specific, individual-specific, and random noise, all of which were sampled from a normal distribution (mean of 0 and standard deviation of 0.1). We also simulated an equal number of SNPs with null effects (proportion of alternative alleles =0.5), again adding tissue-specific, individual-specific and random noise to these observations. Receiver operating characteristic (ROC) curves (Figure 1b) were calculated by combining the null SNPs with the effect SNPs and determining the true positive and false positive rates at various thresholds of the posterior predictive p-values.
Comparison of ASE results to eQTL data
Overlaps between ASE and eQTL effects were assessed using published single-tissue eQTL data obtained from the GTEx Portal (http://gtexportal.org/static/datasets/gtex_analysis_v6/single_tissue_eqtl_data/GTEx_Analysis_V6_eQTLs.tar.gz). A 2×2 Fisher’s Exact test was used to evaluate the proportion of introgressed SNPs with/without significant ASE with/without significant eQTL effects in the same gene and same direction in one or more tissues. This analysis was then repeated for non-introgressed SNPs and stratifying into 5% bins of European minor allele frequency (Figure S3).
Significant eQTL were defined according to thresholds described by the GTEx Consortium (http://www.gtexportal.org/static/doc/analysis/Portal_Analysis_Methods_v6_08182016.pdf). Briefly, within tissues, genes with significant eQTL (“eGenes”) were identified by permuting sample labels for gene expression matrix data. For each permuted set, the minimum nominal p-value for all SNPs in a cis- window (±1 Mb from the transcription start site) of a given gene was used as a test statistic to produce an empirical distribution. The observed minimum p-value was compared to this distribution to produce an empirical p-value. These empirical p-values were then used to control the FDR at 5% using the method of Storey (2003). To define significant eQTL within eGenes, a permutation threshold was then defined as the empirical p-value of the gene falling on the q-value = 0.05 threshold. For each eGene, a gene-specific nominal p-value threshold was calculated as the minimum p-value from the permutations that corresponded to this permutation threshold. SNPs with nominal p-values less than or equal to the gene-specific nominal p-value threshold were defined as significant eQTL of that eGene.
Contrasting ASE at non-introgressed SNPs
At an FDR of 10%, a total of 1236 introgressed SNPs (24.5%) in 767 genes showed significant ASE (Figure 2; Figure S2). In comparison, 161,590 non-introgressed SNPs (27.8%) in 19,955 genes showed significant ASE at the same FDR. We restricted analysis to the 526,000 biallelic SNPs (4964 introgressed and 521,036 non-introgressed) for which the ancestral state was confidently inferred by the 1000 Genomes Project (1000 Genomes Project Consortium, 2012) and matched either the reference or alternative allele. Complicating comparison between introgressed and non-introgressed SNPs, power to detect ASE is a function of the number of heterozygous samples, which in turn depends on allele frequency and expression profile across tissues.
We thus repeated the calculation of the proportion of SNPs showing significant ASE, stratifying by derived allele frequency in bins of 1% (Figure 4a). Frequencies were based on the European (EUR) individuals in the 1000 Genomes Project, Phase 3 and polarized based on the ancestral allele recorded in the same VCF files. As expected, the proportion of SNPs showing significant ASE was highest at intermediate derived allele frequencies (where the number of heterozygotes is maximized). To assess differences within bins, we used the following procedure. Suppose that the true proportion of introgressed SNPs showing ASE is pN, while the true proportion of non-introgressed SNPs showing ASE is pH. The total number of introgressed and non-introgressed SNPs are denoted by NN and NH, respectively. The number of introgressed and non-introgressed SNPs in our dataset observed to show significant ASE at 10% FDR (YN and YH, respectively) are then drawn from binomial distributions:
Assuming uniform priors on pN and pH, we have:
For each frequency bin, we then simulated 100,000 draws from each of these distributions to form the distribution of pN – pH, taking empirical 2.5% and 97.5% quantiles of this distribution to form credible intervals (Figure 4b). We note that while the FDR (10% overall) may vary across frequency bins, it is not expected to differ between introgressed and non-introgressed SNPs within frequency bins.
Overlap with GWAS data
Intersection with GWAS results was conducted by first identifying all SNPs in strong linkage disequilibrium with Neanderthal introgression tag-SNPs that showed significant ASE at 10% FDR. This step was implemented using the SNAP Proxy Search tool (Johnson et al., 2008), extracting all SNPs with pairwise r2 > 0.8 based on European populations from the 1000 Genomes Pilot dataset. We excluded SNPs that had a frequency greater than 5% in any African population from the 1000 Genomes dataset, then queried the GWAS Central (Beck et al., 2014) and NHGRI-EBI Catalog of Published GWAS (Welter et al., 2014) for overlaps with this remaining set.
Models to test differences in across tissues
The binomial mixed model approach was extended to test for associations between the direction of ASE and various fixed effect predictors, such as tissue. Rather than subsetting by SNP, we included all SNPs together and added a random effect of gene (ζg) to the model including the random effect of subject (γi) and converted the random effect of tissue (previously αt) to a fixed effect (βt): logit(pit) = β0 + βt + γi + ζg. We then compared this model to a model without tissue parameters using the Watanabe-Akaike information criterion (WAIC; Watanabe, 2010; Gelman et al., 2014), thereby assessing the significance of the tissue parameters. We also fit the same model using frequentist methods with lme4 (Bates et al., 2015) and compared them with a likelihood ratio test.
To further examine the robustness of downregulation of brain- and testis-expressed Neanderthal-introgressed alleles, we fit GLMMs to all introgressed SNPs with binary variables indicating whether the tissue was brain/non-brain (βbrain) or testis/non-testis (βtestis): logit(pit) = β0 + βbrain/testis + αt + γi + ζg. We then compared the relevant regression coefficient estimates (𝛽̂, respectively) to those obtained from an equal sized control samples of non-introgressed SNPs matched on number of subjects, number of tissues, and number of genes. Covariate matching was implemented using the Matching package (Sekhon, 2011) in R. This procedure was repeated a sufficient number of times to achieve accurate empirical p-value estimates to one significant digit. Empirical p-values were obtained by taking the proportion of matched samples of non-introgressed SNPs with coefficient estimates as extreme or more extreme than that estimated for introgressed SNPs.
Measuring divergence across tissues
To understand how divergence varied across genes expressed in different tissues, we calculated mean sequence divergence between the Neanderthal and human reference gene sequences, weighting by corresponding gene expression in each tissue. Expression was defined as the median RPKM across individuals, taken from summary data available in the GTEx Portal (http://www.gtexportal.org/static/datasets/gtex_analysis_v6/rna_seq_data/GTEx_Analysis_v6_RNA-seq_RNA-SeQCv1.1.8_gene_median_rpkm.gct.gz). Divergent sites were defined by considering all genomic positions where the Altai Neanderthal is homozygous for an allele that is at less than 2% frequency in African modern human populations (based on continental frequencies recorded in the Altai Neanderthal VCFs). We applied minimal quality filters to the Altai variants (map35_50%; https://bioinf.eva.mpg.de/altai_minimal_filters/) and limited the analysis to the 2034 expressed genes harboring Neanderthal tag SNPs (i.e. the data underlying all previous analyses).
Individual SNPs exhibiting tissue-specific ASE
In addition to detecting overall differences in patterns of ASE across tissues, we were interested in identifying individual SNPs that showed tissue-specific effects. To this end, we tested for each SNP whether a model including tissue as a fixed effect (M1:logit(pit) = β0 + βt + γi) fit the data significantly better than a reduced model without this term (M0: logit(pit) = β0 + γi), where pit is the proportion of reads supporting the alternative allele in individual i and tissue t and γi is the random effect of individual. We then compared the likelihoods of the nested models by calculating a Bayes factor (BF):
We considered SNPs with BF > 10 as showing strong evidence of tissue heterogeneity in ASE.
Accounting for reference mapping bias
Reads originating from alleles that match the reference genome preferentially map to that reference (Degner et al., 2009). This phenomenon is amplified by sequencing error and may confound analyses of ASE by generating an allelic bias that is technical rather than biological in origin. While some studies have argued that this confounding effect is limited (Panousis et al., 2014), analyses involving introgression may especially susceptible because introgressed haplotypes are more divergent from the reference genome than are alternative haplotypes of intraspecific origin. We thus undertook several steps to mitigate this effect:
We restricted the analysis to high quality tag SNPs (Vernot et al., 2014; Vernot et al., 2016).
We removed SNPs in regions of low mappability (ENCODE 50-mer mappability score < 1). Mappability reflects the uniqueness of a genomic region. Repetitive regions of low mappability can cause false mapping and inaccurate quantitation of read originating from a given genomic location. This effect may be magnified by attempting to map divergent introgressed haplotypes (which may themselves be repetitive) to these regions.
We removed SNPs that showed mapping bias in simulation (Panousis et al., 2014; http://jungle.unige.ch/~lappalainen/EUR01_50bp_result_stats_05bias_fixed.vcf.gz). Previous work demonstrated that this reduces the proportion of sites with strong bias by approximately 50% (Castel et al., 2015).
We adjusted the null alternative allele ratio to the median across all sites (0.4896). This accounts for the modest mapping bias that remains after removing known biased sites.
Further supporting the robustness of our results, we detected no consequential effect of sequence divergence on tissue-specific patterns of downregulation, indicating that the impact of reference bias on this analysis is minimal. To test this effect, we extended the GLMM to include sequence divergence in the corresponding gene: logit(pit) = β0 + βt + βdiv + γi + ζg, where γi is the random effect of individual, ζg is the random effect of gene, βt is the fixed effect of tissue, and βdiv is the fixed effect of Neanderthal-modern human divergence of the gene in which the SNP lies. While we detected a marginally significant negative effect of divergence on representation of Neanderthal alleles (binomial GLMM: β = −38.3, 95% CI [−69.2, −7.32], P = 0.0151), this did not alter the qualitative pattern of downregulation across tissues, with both brain and testis remaining strongly enriched for downregulation (Figure S5).
Furthermore, we observed that brain-expressed genes had lower rates of sequence divergence—both overall divergence (Figure S6) and non-synonymous divergence (Figure 5c)—than other tissues, consistent with previous observations in mammals (Brawand et al., 2011). These less divergent haplotypes should be less susceptible to reference mapping bias, thereby indicating that the apparent downregulation of Neanderthal alleles in brain tissues is not an artifact of reference bias.
Correlation in ASE among linked SNPs
The presence of multiple SNPs tagging a single introgressed haplotype may amplify apparent directional patterns of ASE in particular tissues. The previously-described mixed model approach (Figure 5a) accounts for this issue by including a random effect of gene and thus combining across SNPs within genes. We also examined the robustness of comparisons between counts of significantly up- and downregulated SNPs to linkage among SNPs within genes by randomly sampling one SNP per gene and repeating the calculation of these proportions. As expected, the signal is reduced upon accounting for correlated effects of SNPs within genes in this manner, yet brain tissues and testis both remain enriched for SNPs with down- versus upregulation of Neanderthal-introgressed alleles (Figure S7).
KEY RESOURCES TABLE
The table highlights the genetically modified organisms and strains, cell lines, reagents, software, and source data essential to reproduce results presented in the manuscript. Depending on the nature of the study, this may include standard laboratory materials (i.e., food chow for metabolism studies), but the Table is not meant to be comprehensive list of all materials and resources used (e.g., essential chemicals such as SDS, sucrose, or standard culture media don’t need to be listed in the Table). Items in the Table must also be reported in the Method Details section within the context of their use. The number of primers and RNA sequences that may be listed in the Table is restricted to no more than ten each. If there are more than ten primers or RNA sequences to report, please provide this information as a supplementary document and reference this file (e.g., See Table S1 for XX) in the Key Resources Table.
Supplementary Material
ACKNOWLEDGEMENTS
We thank Joshua Schraiber for assistance estimating the proportions of mutations arising pre- and post-introgression. Thank you to Timothy Sullivan, Stephane Castel, Tuuli Lappalainen, and the GTEx Laboratory, Data Analysis, and Coordinating Center (LDACC). Thanks also to Thomas Montine, Benjamin Vernot, and members of the Akey lab for helpful feedback. RCM is supported by NIH/NHGRI training grant 5T32HG000035-22 to the University of Washington. This work is also partially supported by NIH grant R01GM110068 to JMA. The Genotype-Tissue Expression (GTEx) Project was supported by the Common Fund of the Office of the Director of the NIH. Additional funds were provided by the NCI, NHGRI, NHLBI, NIDA, NIMH, and NINDS. Donors were enrolled at Biospecimen Source Sites funded by NCI\SAIC- Frederick, Inc. (SAIC-F) subcontracts to the National Disease Research Interchange (10XS170), Roswell Park Cancer Institute (10XS171), and Science Care, Inc. (X10S172). The LDACC was funded through a contract (HHSN268201000029C) to The Broad Institute, Inc. Biorepository operations were funded through an SAIC-F subcontract to Van Andel Institute (10ST1035). Additional data repository and project management were provided by SAIC-F (HHSN261200800001E). The Brain Bank was supported by supplements to University of Miami grants DA006227 & DA033684 and to contract N01MH000028. Statistical Methods development grants were made to the University of Geneva (MH090941 & MH101814), the University of Chicago (MH090951, MH090937, MH101820, MH101825), the University of North Carolina - Chapel Hill (MH090936 & MH101819), Harvard University (MH090948), Stanford University (MH101782), Washington University St Louis (MH101810), and the University of Pennsylvania (MH101822).
Footnotes
Publisher's Disclaimer: This is a PDF file of an unedited manuscript that has been accepted for publication. As a service to our customers we are providing this early version of the manuscript. The manuscript will undergo copyediting, typesetting, and review of the resulting proof before it is published in its final citable form. Please note that during the production process errors may be discovered which could affect the content, and all legal disclaimers that apply to the journal pertain.
Data and Software Availability
Raw GTEx v6 data are available through dbGaP (phs000424.v6.p1) and summarized data are available through the GTEx Portal: http://www.gtexportal.org. Analysis scripts are posted on GitHub: https://github.com/rmccoy7541/neanderthal_ase. ASE results for all introgressed variants are freely available through our interactive browser: https://neanderthal-ase.shinyapps.io/neanderthal_ase/.
REFERENCES
- 1000 Genomes Project Consortium. (2012). An integrated map of genetic variation from 1,092 human genomes. Nature, 491, 56–65. [DOI] [PMC free article] [PubMed] [Google Scholar]
- Adzhubei IA, Schmidt S, Peshkin L, Ramensky VE, Gerasimova A, et al. (2010). Nat. Methods, 7, 248–249. [DOI] [PMC free article] [PubMed] [Google Scholar]
- Alonso P, Gratacòs M, Menchón JM, Saiz-Ruiz J, Segalàs C et al. (2008). Extensive genotyping of the BDNF and NTRK2 genes define protective haplotypes against obsessive-compulsive disorder. Biol. Psychiatry, 63, 619–628. [DOI] [PubMed] [Google Scholar]
- Barton RA, Venditti C (2014). Rapid evolution of the cerebellum in humans and other great apes. Curr. Biol, 20, 2440–2444. [DOI] [PubMed] [Google Scholar]
- Bates D, Mächler M, Bolker B, Walker S (2015). Fitting linear mixed-effects models using lme4. J. Stat. Softw 67, 1–48. [Google Scholar]
- Beck T, Hastings RK, Gollapudi S, Free RC, Brookes AJ (2014). GWAS Central: a comprehensive resource for the comparison and interrogation of genome- wide association studies. Eur. J. Hum. Genet, 22, 949–952. [DOI] [PMC free article] [PubMed] [Google Scholar]
- Benjamini Y, Hochberg Y (1995). Controlling the false discovery rate: a practical and powerful approach to multiple testing. J. R. Stat. Soc, 57, 289–300. [Google Scholar]
- Beuten J, Ma JX, Payne TJ, Dupont RT, Lou XY et al. (2007). Association of specific haplotypes of neurotrophic tyrosine kinase receptor 2 gene (NTRK2) with vulnerability to nicotine dependence in African-Americans and European-Americans. Biol. Psychiatry, 61, 48–55. [DOI] [PubMed] [Google Scholar]
- Blasius AL, Arnold CN, Georgel P, Rutschmann S, Xia Y et al. (2010). Slc15a4, AP-3, and Hermansky-Pudlak syndrome proteins are required for Toll-like receptor signaling in plasmacytoid dendritic cells. Proc. Natl. Acad. Sci. U.S.A, 107, 19973– 19978. [DOI] [PMC free article] [PubMed] [Google Scholar]
- Booth JR, Wood L, Lu D, Houk JC, Bitan T (2007). The role of the basal ganglia and cerebellum in language processing. Brain Res, 1133, 136–144. [DOI] [PMC free article] [PubMed] [Google Scholar]
- Brawand D, Soumillon M, Necsulea A, Julien P, Csárdi G et al. (2011). The evolution of gene expression levels in mammalian organs. Nature, 478, 343–348. [DOI] [PubMed] [Google Scholar]
- Cáceres M, Lachuer J, Zapala MA, Redmond JC, Kudo L, et al. (2003). Elevated gene expression levels distinguish human from non-human primate brains. Proc. Natl. Acad. Sci. U.S.A, 100, 13030–13035. [DOI] [PMC free article] [PubMed] [Google Scholar]
- Capra JA, Erwin GD, McKinsey G, Rubenstein JL, Pollard KS (2013). Many human accelerated regions are developmental enhancers. Phil. Trans. R. Soc. B, 368, 20130025. [DOI] [PMC free article] [PubMed] [Google Scholar]
- Castel SE, Levy-Moonshine A, Mohammadi P, Banks E, Lappalainen T (2015). Tools and best practices for data processing in allelic expression analysis. Genome Biol, 16, 1–12. [DOI] [PMC free article] [PubMed] [Google Scholar]
- Chen Z, Simmons M, Perry RT, Wiener HW, Harrell LE, et al. (2008). Genetic association of neurotrophic tyrosine kinase receptor type 2 (NTRK2) with Alzheimer’s disease. Am. J. Med. Genet. B Neuropsychiatr. Genet, 147, 363–369. [DOI] [PubMed] [Google Scholar]
- Correia CT, Coutinho AM, Sequeira AF, Sousa IG, Lourenço Venda L et al. (2010). Increased BDNF levels and NTRK2 gene association suggest a disruption of BDNF/TrkB signaling in autism. Genes Brain Behav, 9, 841–848. [DOI] [PubMed] [Google Scholar]
- Currat M, Excoffier L (2011). Strong reproductive isolation between humans and Neanderthals inferred from observed patterns of introgression. Proc. Natl. Acad. Sci. U.S.A, 108, 15129–15134. [DOI] [PMC free article] [PubMed] [Google Scholar]
- Danneman M, Andrés A, Kelso J (2016). Introgression of Neandertal- and Denisovan-like Haplotypes Contributes to Adaptive Variation in Human Toll-like Receptors. Am. J. Hum. Genet, 98, 22–33. [DOI] [PMC free article] [PubMed] [Google Scholar]
- Degner JF, Marioni JC, Pai AA, Pickrell JK, Nkadori E et al. (2009). Effect of read-mapping biases on detecting allele-specific expression from RNA-sequencing data. Bioinformatics, 25, 3207–3212. [DOI] [PMC free article] [PubMed] [Google Scholar]
- Deschamps M, Laval G, Fagny M, Itan Y, Abel L et al. (2016). Genomic Signatures of Selective Pressures and Introgression from Archaic Hominins at Human Innate Immunity Genes. Am. J. Hum. Genet, 98, 5–21. [DOI] [PMC free article] [PubMed] [Google Scholar]
- Ferguson J, Gomes S, Civetta A (2013). Rapid male-specific regulatory divergence and down regulation of spermatogenesis genes in Drosophila species hybrids. PloS One, 8, e61575. [DOI] [PMC free article] [PubMed] [Google Scholar]
- Fu W, Gittelman RM, Bamshad MJ, Akey JM (2014). Characteristics of neutral and deleterious protein-coding variation among individuals and populations. Am. J. Hum. Genet, 95, 421–436. [DOI] [PMC free article] [PubMed] [Google Scholar]
- Gelman A, Hwang J, Vehtari A (2014). Understanding predictive information criteria for Bayesian models. Stat. Comput 24, 997–1016. [Google Scholar]
- Gilad Y, Oshlack A, Smyth GK, Speed TP, White KP (2006). Expression profiling in primates reveals a rapid evolution of human transcription factors. Nature, 440, 242–245. [DOI] [PubMed] [Google Scholar]
- Gittelman RM, Hun E, Ay F, Madeoy J, Pennacchio L, et al. (2015). Comprehensive identification and analysis of human accelerated regulatory DNA. Genome Res, 25, 1245–1255. [DOI] [PMC free article] [PubMed] [Google Scholar]
- Gittelman RM, Schraiber JG, Vernot B, Mikacenic C, Wurfel MM, Akey JM (2016). Archaic Hominin Admixture Facilitated Adaptation to Out-of-Africa Environments. Curr. Biol, 26, 1–8. [DOI] [PMC free article] [PubMed] [Google Scholar]
- Gray J, Yeo G, Hung C, Keogh J, Clayton P et al. (2007). Functional characterization of human NTRK2 mutations identified in patients with severe early- onset obesity. Int. J. Obes, 31, 359–364. [DOI] [PubMed] [Google Scholar]
- Green RE, Krause J, Briggs AW, Maricic T, Stenzel U et al. (2010). A draft sequence of the Neandertal genome. Science, 328, 710–722. [DOI] [PMC free article] [PubMed] [Google Scholar]
- Guerrero RF, Posto AL, Moyle LC, Hahn MW (2016). Genome-wide patterns of regulatory divergence revealed by introgression lines. Evolution, 70, 696–706. [DOI] [PubMed] [Google Scholar]
- Han JW, Zheng HF, Cui Y, Sun LD, Ye DQ et al. (2009). Genome-wide association study in a Chinese Han population identifies nine new susceptibility loci for systemic lupus erythematosus. Nat. Genet, 41, 1234–1237. [DOI] [PubMed] [Google Scholar]
- Harris K, Nielsen R The genetic cost of Neanderthal introgression. (2016). Genetics, 203, 881–891. [DOI] [PMC free article] [PubMed] [Google Scholar]
- Harrow J, Frankish A, Gonzalez JM, Tapanari E, Diekhans M et al. (2012). GENCODE: the reference human genome annotation for The ENCODE Project. Genome Res, 22, 1760–1774. [DOI] [PMC free article] [PubMed] [Google Scholar]
- Hawrylycz MJ, Lein ES, Guillozet-Bongaarts AL, Shen EH, Ng L et al. (2012). An anatomically comprehensive atlas of the adult human brain transcriptome. Nature, 489, 391–399. [DOI] [PMC free article] [PubMed] [Google Scholar]
- Hublin JJ, Neubauer S, Gunz P (2015). Brain ontogeny and life history in Pleistocene hominins. Phil. Trans. R. Soc. B, 370, 20140062. [DOI] [PMC free article] [PubMed] [Google Scholar]
- Johnson AD, Handsaker RE, Pulit SL, Nizzari MM, O’Donnell CJ et al. (2008). SNAP: a web-based tool for identification and annotation of proxy SNPs using HapMap. Bioinformatics, 24, 2938–2939. [DOI] [PMC free article] [PubMed] [Google Scholar]
- Jones DT, Hutter B, Jäger N, Korshunov A, Kool M et al. (2013). Recurrent somatic alterations of FGFR1 and NTRK2 in pilocytic astrocytoma. Nature Genet, 45, 927–932. [DOI] [PMC free article] [PubMed] [Google Scholar]
- Juhasz G, Dunham JS, McKie S, Thomas E, Downey D et al. (2011). The CREB1-BDNF-NTRK2 pathway in depression: multiple gene-cognition-environment interactions. Biol. Psychiatry, 69, 762–771. [DOI] [PubMed] [Google Scholar]
- Kim D, Pertea G, Trapnell C, Pimentel H, Kelley R et al. (2013). TopHat2: accurate alignment of transcriptomes in the presence of insertions, deletions and gene fusions. Genome Biol, 14, R36. [DOI] [PMC free article] [PubMed] [Google Scholar]
- King MC, Wilson AC (1975). Evolution at two levels in humans and chimpanzees. Science, 188, 107–116. [DOI] [PubMed] [Google Scholar]
- Kircher M, Witten DM, Jain P, O’Roak BJ, Cooper GM et al. (2014). A general framework for estimating the relative pathogenicity of human genetic variants. Nature Genet, 46, 310–315. [DOI] [PMC free article] [PubMed] [Google Scholar]
- Kohli MA, Salyakina D, Pfennig A, Lucae S, Horstmann S et al. (2010). Association of Genetic Variants in the Neurotrophic Receptor–Encoding Gene NTRK2 and a Lifetime History of Suicide Attempts in Depressed Patients. Arch. Gen. Psychiatry, 67, 348–359. [DOI] [PMC free article] [PubMed] [Google Scholar]
- Kumar P, Henikoff S, Ng PC (2009). Predicting the effects of coding non- synonymous variants on protein function using the SIFT algorithm. Nat. Protoc, 4, 1073–1081. [DOI] [PubMed] [Google Scholar]
- Landry CR, Wittkopp PJ, Taubes CH, Ranz JM, Clark AG et al. (2005). Compensatory cis-trans Evolution and the Dysregulation of Gene Expression in Interspecific Hybrids of Drosophila. Genetics, 171, 1813–1822. [DOI] [PMC free article] [PubMed] [Google Scholar]
- Li MD, Lou XY, Chen G, Ma JZ, Elston RC (2008). Gene-gene interactions among CHRNA4, CHRNB2, BDNF, and NTRK2 in nicotine dependence. Biol.Psychiatry, 64, 951–957. [DOI] [PMC free article] [PubMed] [Google Scholar]
- Liu HX, Zhang M, Krainer AR (1998). Identification of functional exonic splicing enhancer motifs recognized by individual SR proteins. Genes Dev, 12, 1998–2012. [DOI] [PMC free article] [PubMed] [Google Scholar]
- Lonsdale J, Thomas J, Salvatore M, Phillips R, Lo E, et al. (2013). The genotype- tissue expression (GTEx) project. Nat. Genet, 45, 580–585. [DOI] [PMC free article] [PubMed] [Google Scholar]
- Mack KL, Nachman MW (2017). Gene Regulation and Speciation. Trends Genet, 33, 68–80. [DOI] [PMC free article] [PubMed] [Google Scholar]
- Mariën P, Ackermann H, Adamaszek M, Barwood CH, Beaton A et al. (2014). Consensus paper: language and the cerebellum: an ongoing enigma. Cerebellum, 13, 386–410. [DOI] [PMC free article] [PubMed] [Google Scholar]
- McKenna A, Hanna M, Banks E, Sivachenko A, Cibulskis K et al. (2010). The Genome Analysis Toolkit: A MapReduce framework for analyzing next-generation DNA sequencing data. Genome Res, 20, 1297–1303. [DOI] [PMC free article] [PubMed] [Google Scholar]
- Michalak P, Noor MA (2003). Genome-wide patterns of expression in Drosophila pure species and hybrid males. Mol. Biol. Evol, 20, 1070–1076. [DOI] [PubMed] [Google Scholar]
- Murphy TM, Ryan M, Foster T, Kelley C, McClelland R et al. (2011). Risk and protective genetic variants in suicidal behaviour: association with SLC1A2, SLC1A3, 5- HTR1B & NTRK2 polymorphisms. Behav. Brain Funct, 7. [DOI] [PMC free article] [PubMed] [Google Scholar]
- Nakagawara A (2001). Trk receptor tyrosine kinases: a bridge between cancer and neural development. Cancer Letters, 169, 107–114. [DOI] [PubMed] [Google Scholar]
- Nédélec Y Sanz J, Baharian G, Szpiech ZA, Pacis A et al. (2016). Genetic Ancestry and Natural Selection Drive Population Differences in Immune Responses to Pathogens. Cell, 167, 657–669. [DOI] [PubMed] [Google Scholar]
- Need AC, Ge D, Weale ME, Maia J, Feng S et al. (2009). A genome-wide investigation of SNPs and CNVs in schizophrenia. PLoS Genet, 5, e1000373. [DOI] [PMC free article] [PubMed] [Google Scholar]
- O’Carroll AM, Lolait SJ, Harris LE and Pope GR (2013). The apelin receptor APJ: journey from an orphan to a multifaceted regulator of homeostasis. J. Endocrinol, 219, R13–R35. [DOI] [PubMed] [Google Scholar]
- Panousis NI, Gutierrez-Arcelus M, Dermitzakis ET, Lappalainen T (2014). Allelic mapping bias in RNA-sequencing is not a major confounder in eQTL studies. Genome Biol, 15, 467. [DOI] [PMC free article] [PubMed] [Google Scholar]
- Pearce E, Stringer C, Dunbar RIM (2013). New insights into differences in brain organization between Neanderthals and anatomically modern humans. Proc. R. Soc. B, 280, 20130168. [DOI] [PMC free article] [PubMed] [Google Scholar]
- Peyrégne S, Dannemann M, Prüfer K (2016). Detecting ancient positive selection in humans using extended lineage sorting. bioRxiv, 092999. [DOI] [PMC free article] [PubMed] [Google Scholar]
- Pirinen M, Lappalainen T, Zaitlen NA, Dermitzakis ET, Donnelly P et al. (2015). Assessing allele-specific expression across multiple tissues from RNA-seq read data. Bioinformatics, 31, 2497–2504. [DOI] [PMC free article] [PubMed] [Google Scholar]
- Plagnol V, Wall JD (2006). Possible ancestral structure in human populations. PLoS Genet, 2, e105. [DOI] [PMC free article] [PubMed] [Google Scholar]
- Prabhakar S, Noonan JP, Pääbo S, Rubin EM (2006). Accelerated evolution of conserved noncoding sequences in humans. Science, 314, 786–786. [DOI] [PubMed] [Google Scholar]
- Price AL, Helgason A, Thorleifsson G, McCarroll SA, Kong A et al. (2011). Single-tissue and cross-tissue heritability of gene expression via identity-by-descent in related or unrelated individuals. PLoS Genet, 7, e1001317. [DOI] [PMC free article] [PubMed] [Google Scholar]
- Prüfer K, Racimo F, Patterson N, Jay F, Sankararaman S et al. (2014). The complete genome sequence of a Neanderthal from the Altai Mountains. Nature, 505, 43–49. [DOI] [PMC free article] [PubMed] [Google Scholar]
- Quach H, Rotival M, Pothlichet J, Loh Y-HE, Dannemann M et al. (2016). Genetic Adaptation and Neandertal Admixture Shaped the Immune System of Human Populations. Cell, 167, 643–656. [DOI] [PMC free article] [PubMed] [Google Scholar]
- R Core Team. (2015). R: A Language and Environment for Statistical Computing (R Foundation for Statistical Computing, Vienna, 2012). URL: http://www.R-project.org. [Google Scholar]
- Ribases M, Gratacos M, Badia A, Jimenez L, Solano R et al. (2005). Contribution of NTRK2 to the genetic susceptibility to anorexia nervosa, harm avoidance and minimum body mass index. Mol. Psychiatry, 10, 851–860. [DOI] [PubMed] [Google Scholar]
- Rue H, Martino S, Chopin N (2009). Approximate Bayesian inference for latent Gaussian models by using integrated nested Laplace approximations. J. R. Stat. Soc, 71, 319–392. [Google Scholar]
- Sankararaman S, Mallick S, Dannemann M, Prüfer K, Kelso J et al. (2014). The genomic landscape of Neanderthal ancestry in present-day humans. Nature, 507, 354– 357. [DOI] [PMC free article] [PubMed] [Google Scholar]
- Sankararaman S, Mallick S, Patterson N, Reich D (2016). The Combined Landscape of Denisovan and Neanderthal Ancestry in Present-Day Humans. Curr. Biol, 26, 1–7. [DOI] [PMC free article] [PubMed] [Google Scholar]
- Schizophrenia Working Group of the Psychiatric Genomics Consortium. (2014). Biological insights from 108 schizophrenia-associated genetic loci. Nature, 511, 421– 427. [DOI] [PMC free article] [PubMed] [Google Scholar]
- Sekhon JS (2011). Multivariate and propensity score matching software with automated balance optimization: the matching package for R. J. Stat. Softw, 42, 1–52. [Google Scholar]
- Simonti CN, Vernot B, Bastarache L, Bottinger E, Carrell DS et al. (2016). The phenotypic legacy of admixture between modern humans and Neandertals, Science, 351, 737–741. [DOI] [PMC free article] [PubMed] [Google Scholar]
- Skelley DA, Ronald J, Akey JM (2009). Inherited variation in gene expression. Annu. Rev. Hum. Genet, 10, 313–332. [DOI] [PubMed] [Google Scholar]
- Storey JD (2003). The positive false discovery rate: a Bayesian interpretation and the q-value. Ann. Stat, 31, 2013–2035. [Google Scholar]
- The GTEx Consortium. (2015). The Genotype-Tissue Expression (GTEx) pilot analysis: Multitissue gene regulation in humans. Science, 348, 648–660. [DOI] [PMC free article] [PubMed] [Google Scholar]
- Turner LM, Harr B (2014). Genome-wide mapping in a house mouse hybrid zone reveals hybrid sterility loci and Dobzhansky-Muller interactions. Elife, 3, e02504. [DOI] [PMC free article] [PubMed] [Google Scholar]
- van de Geijn B, McVicker G, Gilad Y, Pritchard JK (2015). WASP: allele-specific software for robust molecular quantitative trait locus discovery. Nature Methods, 12, 1061–1063. [DOI] [PMC free article] [PubMed] [Google Scholar]
- Vernot B, Akey JM (2014). Resurrecting surviving Neandertal lineages from modern human genomes. Science, 343, 1017–1021. [DOI] [PubMed] [Google Scholar]
- Vernot B, Tucci S, Kelso J, Schraiber JG, Wolf AB et al. (2016). Excavating Neandertal and Denisovan DNA from the genomes of Melanesian individuals, Science, 352, 235–239. [DOI] [PMC free article] [PubMed] [Google Scholar]
- Watanabe S (2010). Asymptotic equivalence of Bayes cross validation and widely applicable information criterion in singular learning theory. J. Mach. Learn. Res, 11, 3571–3594. [Google Scholar]
- Welter D, MacArthur J, Morales J, Burdett T, Hall P et al. (2014). The NHGRI GWAS Catalog, a curated resource of SNP-trait associations. Nucleic Acids Res, 42, D1001–D1006. [DOI] [PMC free article] [PubMed] [Google Scholar]
- Wickham H (2009). ggplot2: elegant graphics for data analysis Springer Science & Business Media. [Google Scholar]
- Wood AR, Esko T, Yang J, Vedantam S, Pers TH et al. (2014). Defining the role of common variation in the genomic and biological architecture of adult human height. Nat. Genet, 46, 1173–1186. [DOI] [PMC free article] [PubMed] [Google Scholar]
- Yan H, Yuan W, Velculescu VE, Kinzler KW (2002). Allelic variation in human gene expression. Science, 297, 1143–1143. [DOI] [PubMed] [Google Scholar]
- Yeo GS, Connie Hung CC, Rochford J, Keogh J, Gray J et al. (2004). A de novo mutation affecting human TrkB associated with severe obesity and developmental delay. Nat. Neurosci, 7, 1187–1189. [DOI] [PubMed] [Google Scholar]
- Yu XH, Tang ZB, Liu LJ, Qian H, Tang SL et al. (2014). Apelin and its receptor APJ in cardiovascular diseases. Clin. Chim. Acta, 428, 1–8. [DOI] [PubMed] [Google Scholar]
Associated Data
This section collects any data citations, data availability statements, or supplementary materials included in this article.