Abstract
Dysregulated bile acid (BA) synthesis is accompanied by dysbiosis, leading to compromised metabolism. This study analyzes the effect of epigallocatechin-3-gallate (EGCG) on diet-induced obesity through regulation of BA signaling and gut microbiota. The data revealed that EGCG effectively reduced diet-increased obesity, visceral fat, and insulin resistance. Gene profiling data showed that EGCG had a significant impact on regulating genes implicated in fatty acid uptake, adipogenesis, and metabolism in the adipose tissue. In addition, metabolomics analysis revealed that EGCG altered the lipid and sugar metabolic pathways. In the intestine, EGCG reduced the FXR agonist chenodeoxycholic acid, as well as the FXR-regulated pathway, suggesting intestinal FXR deactivation. However, in the liver, EGCG increased the concentration of FXR and TGR-5 agonists and their regulated signaling. Furthermore, our data suggested that EGCG activated Takeda G protein receptor (TGR)-5 based on increased GLP-1 release and elevated serum PYY level. EGCG and antibiotics had distinct antibacterial effects. They also differentially altered body weight and BA composition. EGCG, but not antibiotics, increased Verrucomicrobiaceae, under which EGCG promoted intestinal bloom of Akkermansia muciniphila. Excitingly, A. muciniphila was as effective as EGCG in treating diet-induced obesity. Together, EGCG shifts gut microbiota and regulates BA signaling thereby having a metabolic beneficial effect.—Sheng, L., Jena, P. K., Liu, H.-X., Hu, Y., Nagar, N., Bronner, D. N., Settles, M. L., Bäumler, A. J., Wan, Y.-J. Y. Obesity treatment by epigallocatechin-3-gallate–regulated bile acid signaling and its enriched Akkermansia muciniphila.
Keywords: tea, catechin, probiotics, gut microbiota, bile acid receptor
Polyphenols present in tea prevent lifestyle–related diseases. Among these polyphenols, epigallocatechin-3-gallate (EGCG) has potent antioxidant, anti-inflammatory, antiobesity, antibacterial, and anticancer effects (1–10). Published data revealed that EGCG can interact with cell surface receptors, activate second messengers and signal transduction pathways, and regulate transcriptional activation, DNA methylation, and autophagy (5, 11). In the current study, we analyzed the impact of EGCG on bile acid (BA)–regulated signaling and gut microbiota.
BAs are signaling molecules that show how gut microbiota regulate host metabolism, because they are jointly produced by hepatic and bacterial enzymes (12–14). Specifically, hepatic enzymes generate free and conjugated primary BAs, and bile salt hydrolase, found in Bifidobacterium and Lactobacillus, deconjugates BAs. Moreover, 7α-dehydroxylase from Firmicutes converts primary BAs into secondary BAs (15, 16). Therefore, dysregulated BA synthesis and dysbiosis are implicated in the development of metabolic diseases, including nonalcoholic steatohepatitis, obesity, type 2 diabetes, and carcinogenesis in the digestive tract (15, 17–22). Together, gut microbiota affect the production of BAs and have an impact on the action of BA receptors [i.e., nuclear receptor farnesoid x receptor (FXR) and membrane receptor Takeda G protein receptor (TGR)-5] (12–14, 23).
FXR is predominantly expressed in the liver and intestines. It plays a key role in regulating BA homeostasis (15, 18, 24–28). FXR increases the expression of hepatic small heterodimer partner (SHP) and intestinal fibroblast growth factor (FGF)-15, which in turn inhibits hepatic cholesterol 7α-hydroxylase (CYP7A1), a rate-limiting enzyme for BA synthesis. These inhibitory pathways are important because a high concentration of hydrophobic BAs is toxic (29, 30). It has been shown that EGCG inhibits FXR-mediated transcriptional activation of a hepatitis B viral promoter (31). In contrast, acute EGCG treatment increases the expression of FXR target genes (32). Thus, EGCG most likely influences FXR-regulated activity. The effect of EGCG on BA synthesis, which in turn affects metabolism and inflammation regulated by FXR and TGR-5, has not been studied.
In contrast to FXR, which is mainly expressed in the liver and intestine, TGR-5 is ubiquitously expressed (33). Activation of TGR-5 induces the expression of the preproglucagon gene and glucagon-like peptide (GLP)-1 secretion in the intestinal enteroendocrine L cells (34, 35). GLP-1 is a peripherally expressed incretin that potentiates postprandial insulin secretion (36). Activation of TGR-5 also releases neuropeptide hormone peptide tyrosine tyrosine (PYY), which reduces gastric mobility and food intake (37). Moreover, PYY increases phagocytosis and regulates inflammatory signaling (38). Another unique role of TGR-5 is to induce type II iodothyronine deiodinase (DIO)-2, which generates tri-iodothyronine, a major component involved in cellular basal metabolism (39). The potential effect of EGCG in regulating TGR-5–mediated signaling warrants investigation.
The current study was conducted to uncover EGCG-regulated metabolites and gut microbiota that might have beneficial effects in reducing obesity. Our data showed that both EGCG and antibiotics have antimicrobial effects. However, they have opposite effects on regulating body weight. Moreover, EGCG uniquely enriched specific microbial and BAs that have metabolic benefits.
MATERIALS AND METHODS
Mice
Specific pathogen-free male C57BL/6 wild-type (WT) mice (The Jackson Laboratory, Sacramento, CA, USA) were fed a Western diet (WD) (21% fat, 34% sucrose, and 0.2% cholesterol, w/w) or control diet (CD, 5% fat, 12% sucrose, and 0.01% cholesterol, w/w; Harlan Teklad, Indianapolis, IN, USA) after weaning (3 wk). When the mice were 8 mo old, WD-fed WT mice were randomly assigned to 2 groups and received vehicle (PBS) or EGCG daily [100 μg/d per gram body weight, orally (Teavigo; DSM Nutritional Products, Basel, Switzerland)] for 2 mo. Mice were euthanized when they were 10 mo old. Age- and diet-matched whole-body FXR knockout (KO) mice were used to identify FXR-target genes (40). For antibiotic treatment, WD-fed WT mice (7 mo old) were given vancomycin (Vcm, 500 mg/L, Gram-positive coverage), polymyxin B (PolyB, 100 mg/L, Gram-negative coverage), and Abx (broad spectrum coverage) that included ampicillin (1 g/L), neomycin (1 g/L), metronidazole (1 g/L), and Vcm (500 mg/L; Research Products International Corp., Mount Prospect, IL, USA) in drinking water for 3 mo, and mice were euthanized when they were 10 mo old. For Akkermansia muciniphila supplementation, WD-fed WT mice (6 mo old) received PBS or A. muciniphila (BAA-835, 109 CFU/mouse per day, orally; American Type Culture Collection, Manassas, VA, USA) for 1 mo, and mice were euthanized at 7 mo of age. Experiments were conducted in accordance with the Guide for the Care and Use of Laboratory Animals (National Institutes of Health, Bethesda, MD, USA) under protocols approved by the Institutional Animal Care and Use Committee of the University of California, Davis.
Biochemical analysis
Serum LPS (Thermo Fisher Scientific, Waltham, MA, USA), triglyceride (BioAssay Systems, Hayward, CA, USA), cholesterol (BioAssay Systems), alanine transaminase (Pointe Scientific, Canton, MI, USA), and alkaline phosphatase (Pointe Scientific) levels were quantified according to the manufacturer’s instructions.
Insulin tolerance test
After the mice were unfed for 6 h, tail vein blood was used to establish fasting blood glucose levels. For insulin tolerance testing, insulin (1 U/kg body weight, i.p.; MilliporeSigma, Burlington, MA, USA) was given followed by monitoring blood glucose levels at various times with the OneTouch Ultra 2 (Johnson & Johnson Co., New Brunswick, NJ, USA). The area under the curve (AUC) of the blood glucose levels over time was calculated.
PYY quantification and GLP-1 secretion assay
After mice were unfed for 12 h, serum PYY levels were quantified by ELISA (Raybiotech, Norcross, GA, USA). For GLP-1 secretion assays, mice were unfed for 12 h and then orally administered dipeptidyl peptidase-4 inhibitor, sitagliptin (3 μg/g body weight; TSZ Chem, Framingham, MA, USA) and a liquid diet of Ensure Plus (10 µl/g body weight; Ross Laboratories, Columbus, OH, USA), which contains 15% protein, 57% carbohydrate, and 28% fat to stimulate GLP-1 secretion, as described in Pathak et al.(41). Blood samples were collected immediately (time 0) and 15, and 30 min after oral administration of Ensure Plus followed by quantification of serum GLP-1 with an ELISA kit (Raybiotech).
Quantification of bile acids
Serum (30 µl) and liver tissue (50–100 mg) were collected for BA quantification. BAs were analyzed with a Prominence UFLC System (Shimadzu, Kyoto, Japan) coupled to an API 4000 Qtrap mass spectrometer (ABSciex, Redwood City, CA, USA) operated in the negative ionization mode. Chromatography was performed on a Kinetex C18 column (50 × 2.1 mm, 2.6 μm; Phenomenex, Torrance, CA, USA) maintained at 40°C preceded by a high-pressure column prefilter. The mobile phase consisted of methanol gradient delivered at a flow rate of 0.4 ml/min (20–22).
Gene expression profiling
RNA was extracted using Trizol Reagent (Thermo Fisher Scientific) followed by generating cDNA using a High Capacity RNA-to-cDNA Kit (Thermo Fisher Scientific). qPCR was performed on an ABI 7900HT Fast Real-Time PCR System using Power Sybr Green PCR Master Mix (Thermo Fisher Scientific). Primers were designed by using Primer3 Input Software (v.0.4.0) and mRNA levels were normalized to the level of Gapdh mRNA.
Protein quantification by Western blot analysis
Protein lysates (40 μg) were subjected to SDS-PAGE under reducing conditions following by transfer to PVDF membranes. The membranes were incubated with 5% nonfat milk followed by an antibody. The following primary antibodies (catalog number and dilutions) were used: CD36 (bs-8873R, 1:1000; Bioss Antibodies, Woburn, MA, USA), fatty acid synthase (FASN; 3180, 1:1000; Cell Signaling Technology, Danvers, MA, USA), sterol regulatory element–binding protein (SREBP)-1C (ab3259, 1:1000; Abcam, Cambridge, United Kingdom), peroxisome proliferator–activated receptors (PPAR)-γ (sc-7196, 1:250; Santa Cruz Biotechnology, Dallas, TX, USA), stearoyl-CoA desaturase (2438, 1:1000; Cell Signaling Technology), Leptin (AF398, 1:500; R&D Systems, Minneapolis, MN, USA), F4/80 (14-4801-81, 1:1000; eBioscience, San Diego, CA, USA), FXR (sc-25309, 1:250; Santa Cruz Biotechnology), CYP8B1 (TA313734, 1:1000; OriGene, Rockville, MD, USA), FGF-15 (sc-16816, 1:250; Santa Cruz Biotechnology), and β-Actin (A1978, 1:10000; MilliporeSigma). Membranes were then incubated with horseradish peroxidase–conjugated secondary antibodies. The signals were detected with an ECL system with Pierce SuperSignal West Pico chemiluminescent substrates (Thermo Fisher Scientific).
Untargeted metabolomic study
Cecal content was extracted, and metabolite levels were quantified by gas chromatography–time-of-flight mass spectrometry (GC-TOF-MS) at West Coast Metabolomics Center (University of California, Davis) (42). Acquired spectra were processed with the BinBase database (43, 44), filtered (45), and matched against the Fiehn Mass Spectral Library of 1200 authentic metabolite spectra with retention index and mass spectrum information or against the National Institution of Standards and Technology (NIST) library. Partial least squares–discriminant analysis, heat map, and pathway analysis were generated by MetaboAnalyst 3.0 (46). Chemical similarity enrichment analysis was performed by ChemRich (47).
Quantification of bacterial DNA and 16S ribosomal RNA gene sequencing
Bacterial DNA in the cecal content (100 mg) was extracted by using a ZR Fecal DNA MiniPrep Kit (Zymo Research, Irvine, CA, USA), quantified by NanoDrop 8000 (Thermo Fisher Scientific), and amplified using primers based on published sequences (Supplemental Table 1). A dissociation step was included to analyze the melting profile of amplified products. In parallel, qPCR was performed with 10-fold serial diluted synthetic DNA fragments of bacterial gene with known concentrations. Bacterial DNA concentration was calculated by using standard curves of diluted synthetic DNA fragment. Sequencing of tagged 16S rRNA gene amplicons of bacterial DNA was performed according to published methods (48–50). The V4 region of 16S rRNA gene was amplified and sequenced with MiSeq (Illumina, Orange, CT, USA).
Bioinformatics and statistical analysis
Family-level taxon abundances were used in Statistical Analysis of Metagenomic Profiles (STAMP, v.2.0; http://kiwi.cs.dal.ca/Software/images/7/70/STAMP_Users_Guide.pdf) software to generate principal component analysis (PCA) plots. Spearman’s correlations were performed with R Statistical Software (The R Project for Statistical Computing; https://www.r-project.org/). Data are expressed as means ± sd. Differences between groups in microbiota family level were calculated by Kruskal-Wallis test. All other comparisons were calculated by 2-tailed Student’s t test or 1-way ANOVA followed by Tukey’s test, with using Prism 6 software (GraphPad Software, Inc., La Jolla, CA, USA). Significance values were adjusted for multiple comparisons by using false discovery rate. A value of P < 0.05 was considered statistically significant.
RESULTS
EGCG reduces WD-increased body fat and serum lipids
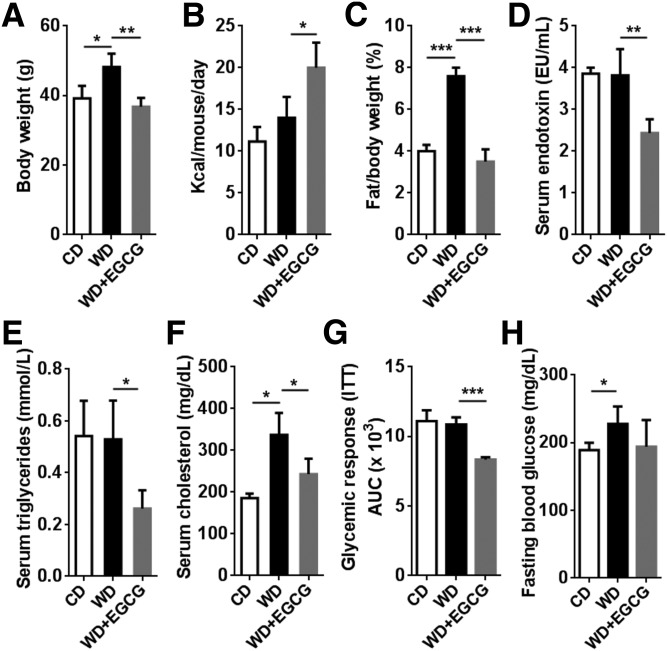
WD-fed mice had increased body weight, and EGCG supplementation reduced it to levels comparable to those of CD-fed mice (Fig. 1A). However, EGCG-treated mice had increased caloric intake (Fig. 1B). EGCG also completely reversed WD-increased visceral fat:body weight ratio (Fig. 1C), but had no effect on reducing liver:body weight ratio (Supplemental Fig. 1A). In addition, EGCG markedly reduced serum endotoxin (LPS), triglyceride, and cholesterol levels (Fig. 1D–F). Moreover, EGCG improved insulin sensitivity, but did not change fasting blood glucose level, (Fig. 1G, H). Furthermore, EGCG reduced WD-induced serum alanine transferase and alkaline phosphatase (Supplemental Fig. 1B, C), indicating the provided EGCG did not cause liver toxicity.
Figure 1.
Phenotypes of CD, WD, and WD+EGCG-fed mice. A–F) Body weight (A); food intake (B); visceral fat:body weight ratio (C); serum endotoxin level (D); serum triglycerides (E); and cholesterol level (F). G, H) AUC in an insulin sensitivity test (G) and fasting blood glucose level (H) (n = 3–4/group). Data are expressed as means ± sd. *P < 0.05, **P < 0.01, ***P < 0.001 (1-way ANOVA with Tukey’s correction).
EGCG regulates fatty acid uptake and lipid metabolism
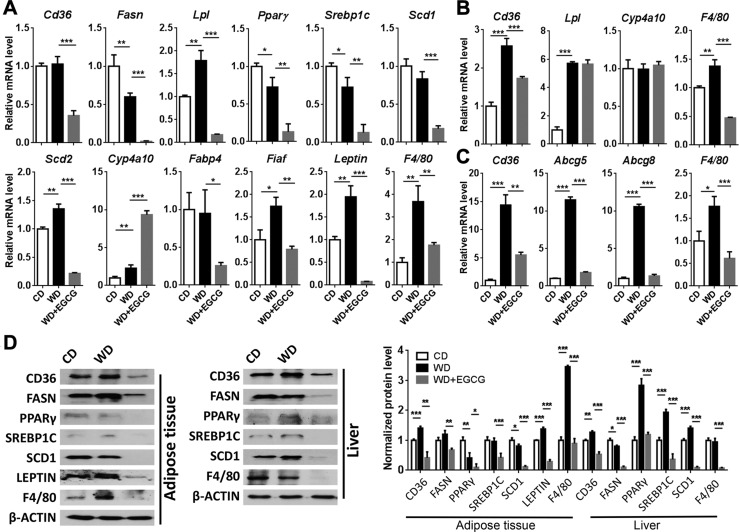
In the visceral fat, EGCG reduced the expression of fatty acid uptake gene Cd36 (Fig. 2A). In addition, EGCG decreased the expression level of adipogenic genes including Fasn, lipoprotein lipase (Lpl), peroxisome proliferator-activated receptor-γ (Pparg), and Srebp1c. Moreover, EGCG inhibited the expression of stearoyl-CoA desaturase (SCD) genes Scd1 and Scd2, which encode rate-limiting enzymes in the synthesis of monounsaturated fatty acids. In contrast, EGCG increased the expression of Cyp4a10 suggesting induced fatty acid oxidation. Furthermore, EGCG reduced the expression of the genes fatty acid binding protein-4 and fasting-induced adipose factor whose deficiency can reduce serum triglyceride level (51). Moreover, the adipocyte-derived hormonal factor Leptin, which suppresses food intake, was substantially reduced by EGCG (52).
Figure 2.
A–C) The expression of fatty acid synthesis and metabolism genes in adipose tissue (A), liver (B), and ileum (C) of CD-, WD- and WD+EGCG–fed mice. D) Western blot analysis of indicated protein levels in the adipose tissue and liver. The bar graph shows the quantitative results of indicated proteins, which were normalized with corresponding β-Actin level (n = 3–4/group). Data are expressed as means ± sd. *P < 0.05, **P < 0.01, ***P < 0.001 (1-way ANOVA with Tukey’s correction).
In the liver, in response to EGCG treatment, the changes in lipid gene expression were not as apparent as those in the adipose tissues. EGCG only modestly reduced WD-induced fatty acid translocase Cd36 mRNA level, and EGCG had no effect on regulating hepatic Lpl and Cyp4a10 mRNA level (Fig. 2B). However, EGCG increased ATP-binding cassette transporter bile salt export pump (Bsep) and solute carrier organic anion transporter-3 (Oat3), which is involved in the movement of gut microbiome–derived metabolites (53), but reduced the expression of the genes organic anion-transporting polypeptide-1b2 and solute carrier organic anion transporter family member 1B3 (Supplemental Fig. 1E). In the ileum, EGCG reduced WD-induced Cd36 as well as sterol transporters ATP-binding cassette subfamily G-5 (Abcg5) and Abcg8 (Fig. 2C). In addition, EGCG increased ileal Oat3, but reduced transporters organic cation/carnitine transporter-2 and breast cancer resistance protein (Supplemental Fig. 1F).
Because EGCG can induce regulatory T cells (54), we further studied the expression of surface markers of different types of inflammatory cells. EGCG inhibited the expression of the macrophage surface marker F4/80 and dendritic cell marker Cd11c in all studied sites, including the adipose tissues, liver, and ileum. However, EGCG increased the expression of T-cell Cd4 and Cd8a and B-cell Cd19 in the adipose tissues and liver (Fig. 2 and Supplemental Fig. 1D–F). In addition, EGCG increased the expression of anti-inflammatory cytokine Il10 and forkhead box P3, which is a master regulator for the development of regulatory T cells.
Consistently, EGCG reduced WD-increased CD36 in the adipose tissue and liver. EGCG also reduced the protein levels of FASN, SCD1, and F4/80 in these 2 tissues. In addition, WD increased SREBP-1C and PPAR-γ in the liver, but not in the adipose tissue. However, EGCG reduced them in both tissues. The Leptin level in the adipose tissue was induced by WD, but reduced by EGCG, which was consistent with the mRNA level (Fig. 2D).
Metabolic pathways regulated by EGCG
To understand the effect of EGCG in host metabolism, we performed untargeted GC-TOF-MS. A total of 253 known metabolites were detected in mouse cecal content. Partial least squares–discriminant analysis and heat maps were used to visualize sample clustering (Supplemental Fig. 2A, B). Three experimental groups were separated into distinct clusters. Metabolic pathway analysis revealed that the most significant difference between CD- and WD-fed mice was the metabolism of amino acids, including tyrosine, valine, leucine, and isoleucine (Table 1). In addition, the tryptophan and lysine metabolic pathways were significantly different in WD-fed mice supplemented with or without EGCG. Moreover, lipid metabolism including primary BA biosynthesis, steroid, and steroid hormone biosynthesis were distinctly different because of differential dietary feeding and EGCG supplementation.
TABLE 1.
Metabolic pathway and function analysis between groups
| Pathway name | Hits/total compounds | P | FDR | Function |
|---|---|---|---|---|
| CD vs. WD | ||||
| Tyrosine metabolism | 4/44 | 1.02E−04 | 0.0060025 | Amino acid metabolism |
| Valine, leucine, and isoleucine biosynthesis | 3/11 | 7.99E−04 | 0.015711 | Amino acid metabolism |
| Valine, leucine, and isoleucine degradation | 3/38 | 7.99E−04 | 0.015711 | Amino acid metabolism |
| Pyrimidine metabolism | 8/41 | 0.0030409 | 0.027129 | Nucleotide metabolism |
| Phenylalanine metabolism | 3/11 | 0.0031604 | 0.027129 | Amino acid metabolism |
| Phenylalanine, tyrosine, and tryptophan biosynthesis | 2/4 | 0.0031604 | 0.027129 | Amino acid metabolism |
| Ubiquinone and other terpenoid-quinone biosynthesis | 1/3 | 0.0032187 | 0.027129 | Metabolism of cofactors and vitamins |
| Primary bile acid biosynthesis | 4/46 | 0.0086415 | 0.059814 | Lipid metabolism |
| Aminoacyl-tRNA biosynthesis | 18/69 | 0.0091242 | 0.059814 | Translation |
| Pantothenate and CoA biosynthesis | 4/15 | 0.012326 | 0.072722 | Metabolism of cofactors and vitamins |
| Pentose phosphate pathway | 4/19 | 0.014665 | 0.07637 | Carbohydrate metabolism |
| Glycolysis or gluconeogenesis | 4/26 | 0.015533 | 0.07637 | Carbohydrate metabolism |
| Steroid biosynthesis | 1/35 | 0.021613 | 0.089269 | Lipid metabolism |
| Steroid hormone biosynthesis | 1/72 | 0.021613 | 0.089269 | Lipid metabolism |
| Pyruvate metabolism | 1/23 | 0.022695 | 0.089269 | Carbohydrate metabolism |
| WD vs. WD+EGCG | ||||
| Tryptophan metabolism | 1/40 | 0.0022913 | 0.043549 | Amino acid metabolism |
| Glyoxylate and dicarboxylate metabolism | 4/18 | 0.0023733 | 0.043549 | Carbohydrate metabolism |
| Lysine biosynthesis | 2/4 | 0.0036894 | 0.043549 | Amino acid metabolism |
| Lysine degradation | 2/23 | 0.0036894 | 0.043549 | Amino acid metabolism |
| Biotin metabolism | 1/5 | 0.0036906 | 0.043549 | Metabolism of cofactors and vitamins |
| Pyruvate metabolism | 1/23 | 0.036042 | 0.25644 | Carbohydrate metabolism |
| Glycolysis or gluconeogenesis | 4/26 | 0.041281 | 0.25644 | Carbohydrate metabolism |
| Primary bile acid biosynthesis | 4/46 | 0.044381 | 0.25644 | Lipid metabolism |
| Retinol metabolism | 1/16 | 0.046609 | 0.25644 | Metabolism of cofactors and vitamins |
| Steroid biosynthesis | 1/35 | 0.054502 | 0.25644 | Lipid metabolism |
| Steroid hormone biosynthesis | 1/72 | 0.054502 | 0.25644 | Lipid metabolism |
| Pyrimidine metabolism | 8/41 | 0.062619 | 0.25644 | Nucleotide metabolism |
| Nicotinate and nicotinamide metabolism | 3/13 | 0.066312 | 0.25644 | Metabolism of cofactors and vitamins |
| Glutathione metabolism | 4/26 | 0.069969 | 0.25644 | Metabolism of other amino acids |
| Tyrosine metabolism | 4/44 | 0.071325 | 0.25644 | Amino acid metabolism |
The top 15 pathways are listed. FDR, false-discovery rate.
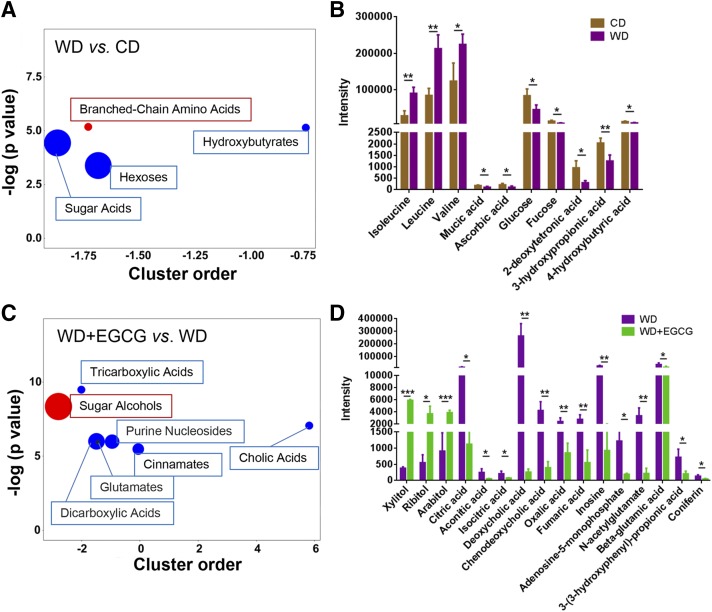
Chemical similarity enrichment analysis for metabolomics was also performed (47). There were 49 metabolites significantly changed because of differential dietary intake, and examples of those changes are shown in Fig. 3. WD-fed mice had a marked increase of branched-chain amino acids (isoleucine, leucine, and valine), reduced sugar acids (mucic acid and ascorbic acid), hexoses (glucose and fucose), and hydroxybutyrates (2-deoxytetronic acid, 3-hydroxypropionic acid, and 4-hydroxybutyric acid), compared with CD-fed mice (Fig. 3A, B). In addition, 50 metabolites were significantly changed when WD-fed mice had EGCG (e.g., Fig. 3C, D). EGCG supplementation of WD-fed mice markedly increased sugar alcohols (xylitol, ribitol, and arabitol), but reduced tricarboxylic acids (citric acid, aconitic acid, and isocitric acid), cholic acids [deoxycholic acid (DCA) and chenodeoxycholic acid (CDCA)], dicarboxylic acids (oxalic acid and fumaric acid), purine nucleosides (inosine and adenosine-5-monophosphate), glutamates (N-acetylglutamate and β-glutamic acid), and cinnamates [3-(3-hydroxyphenyl)-propionic acid and coniferin]. EGCG-supplementation of WD-fed mice reduced DCA and CDCA by 1000- and 10-fold in the cecum, respectively (Fig. 3D).
Figure 3.
Untargeted metabolomics study. ChemRICH metabolite set enrichment statistics plot (A), and the intensity of metabolites detected by GC-TOF-MS (B) in CD-, WD-, and WD+EGCG-fed mice (C, D). The node color shows increased (red) or decreased (blue) metabolite sets in WD-fed mice vs. CD-fed mice (A) or WD+EGCG-fed mice vs. WD-fed mice (C). The node sizes represent the total number of metabolites in each cluster set. *P < 0.05, **P < 0.01, ***P < 0.001.
EGCG regulates TGR-5 and FXR-mediated signaling pathways
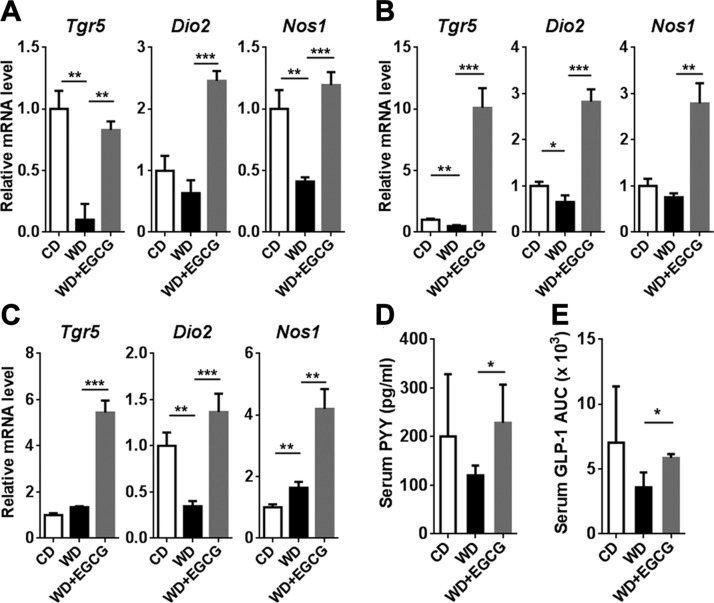
Because of the significant change in BAs in the cecal content in response to EGCG supplementation, we studied TGR-5 and FXR signaling in different tissues. TGR-5–induced Dio2 potentially can improve metabolism by generating thyroxine (39). In the liver, visceral fat, and ileum, WD intake reduced Tgr5 and Dio2 mRNA levels with the exception of ileal Tgr5. EGCG supplementation of WD-fed mice not only reversed the reductions, but also increased those mRNA to higher levels compared with CD-fed mice. In addition, the expression pattern of TGR-5 target gene Nos1 was consistently induced in response to EGCG supplementation in all the studied tissues (55) (Fig. 4A–C). Furthermore, EGCG increased the release of serum PYY and GLP-1 (Fig. 4D, E).
Figure 4.
The expression of the Tgr5 gene as well as TGR-5–regulated signaling genes. A–C) Gene expression in the liver (A), adipose tissue (B), and ileum(C). D) Serum PYY level after 12 h of food withdrawal. E) GLP-1 secretion after liquid diet stimulation. The AUC is shown (n = 3–4/group). Data are means ± sd. *P < 0.05, **P < 0.01, ***P < 0.001 (1-way ANOVA with Tukey’s correction).
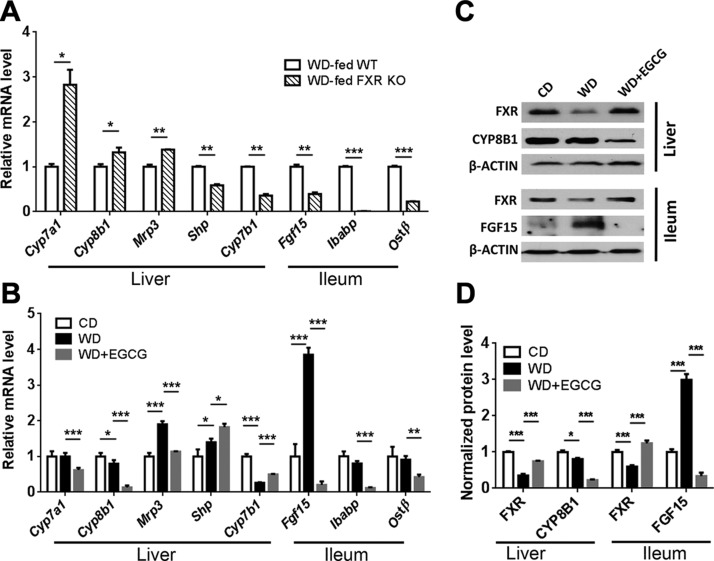
To understand the impact of EGCG on FXR-regulated signaling in WD-fed mice, we first established how the expression of FXR target genes was affected by the lack of FXR in WD-fed male mice when they were 10 mo old. Compared with age-, gender-, and diet-matched WT counterparts, FXR KO mice had increased hepatic Cyp7a1, Cyp8b1 (sterol 12α-hydroxylase), and BA efflux transporter multidrug-resistance protein-3, but reduced hepatic Shp and oxysterol 7α-hydroxylase (Cyp7b1) , as well as ileal Fgf15, ileal bile acid binding protein (Ibabp), and organic solute transporter β (Ostb) (Fig. 5A). In contrast to the KO effects, EGCG treatment reduced hepatic Cyp7a1, Cyp8b1, and multidrug-resistance protein-3, but increased Shp and Cyp7b1 (Fig. 5B). However, in the ileum, EGCG had the same effect as FXR KO; EGCG reduced ileal Fgf15, Ibabp, and Ostb. Together, these data suggest that EGCG activates hepatic FXR, but deactivates ileal FXR.
Figure 5.
Expression of genes implicated in BA homeostasis. A) Hepatic and ileal gene expression in WD-fed WT and WD-fed FXR KO mice. B) Expression of BA homeostasis genes in the liver and ileum of CD, WD, and WD+EGCG-fed WT mice. C) Western blot analysis of indicated protein levels in the liver and ileum. D) Quantitative results of the indicated proteins, which were normalized to the corresponding β-Actin level (n = 3–4/group). Data are means ± sd. *P < 0.05, **P < 0.01, ***P < 0.001 (1-way ANOVA with Tukey’s correction).
At protein level, WD reduced hepatic and ileal FXR, but EGCG reversed such reductions. In addition, EGCG reduced hepatic CYP8B1 indicating hepatic FXR activation. Moreover, WD substantially increased ileal FGF-15, consistent with the mRNA finding, and EGCG treatment abolished such induction, suggesting the effect of EGCG in deactivating intestinal FXR (Fig. 5C, D).
EGCG changes hepatic and serum BA profile
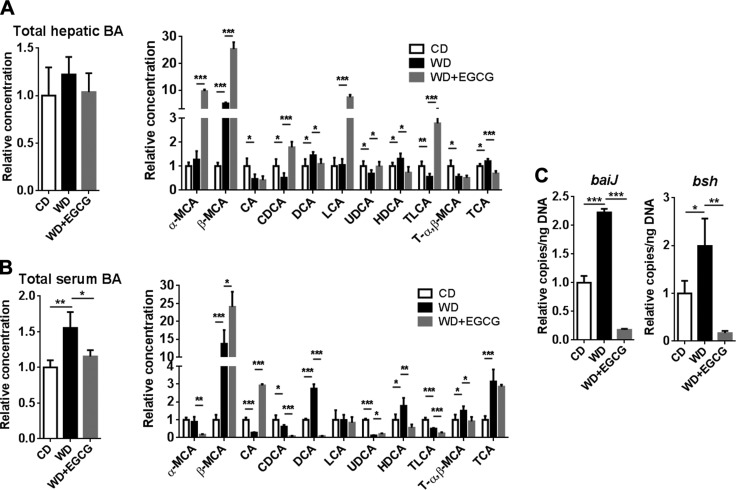
Based on the changes in the expression of genes involved in BA homeostasis, it is anticipated that EGCG could shift the BA profile. Total hepatic BA was not significantly changed by WD intake or EGCG treatment. However, WD intake increased total serum BAs, and EGCG reduced it (Fig. 6A, B). EGCG also changed the BA composition in the liver and serum (Fig. 6). WD intake increased β-muricholic acid (β-MCA), and EGCG further increased it in the liver and serum. Moreover, EGCG increased the hepatic concentration of FXR agonist CDCA and the TGR-5 agonist taurine-conjugated lithocholic acid (TLCA), both of which were reduced by WD in liver. In addition, EGCG increased hepatic lithocholic acid (LCA), which is also an endogenous TGR-5 ligand (Fig. 6A).
Figure 6.
BA profile in CD- and WD-fed mice as well as WD-fed mice supplemented with EGCG. Total hepatic and individual BA (A); total serum and individual BA (B); and bacterial gene abundance in cecal content (C) (n = 3–4 per group). Data are means ± sd. One-way ANOVA with Tukey’s correction. *P < 0.05, **P < 0.01, ***P < 0.001.
The abundance of cecal bacterial genes was quantified to understand the global microbiota effect on BA production. WD increased the abundance of bile acid inducible operon gene J (baiJ) (a gene involved in bile acid 7a dehydroxylation) and bile salt hydrolase gene (bsh), which is responsible for secondary BA synthesis and deconjugation, respectively. However, EGCG reduced the abundance of those genes (Fig. 6C). The low baiJ abundance in EGCG-treated mice was consistent with reduced DCA found in the liver and serum through BAs profiling and in cecal content through the metabolomic study.
The differential antimicrobial effects of EGCG and antibiotics
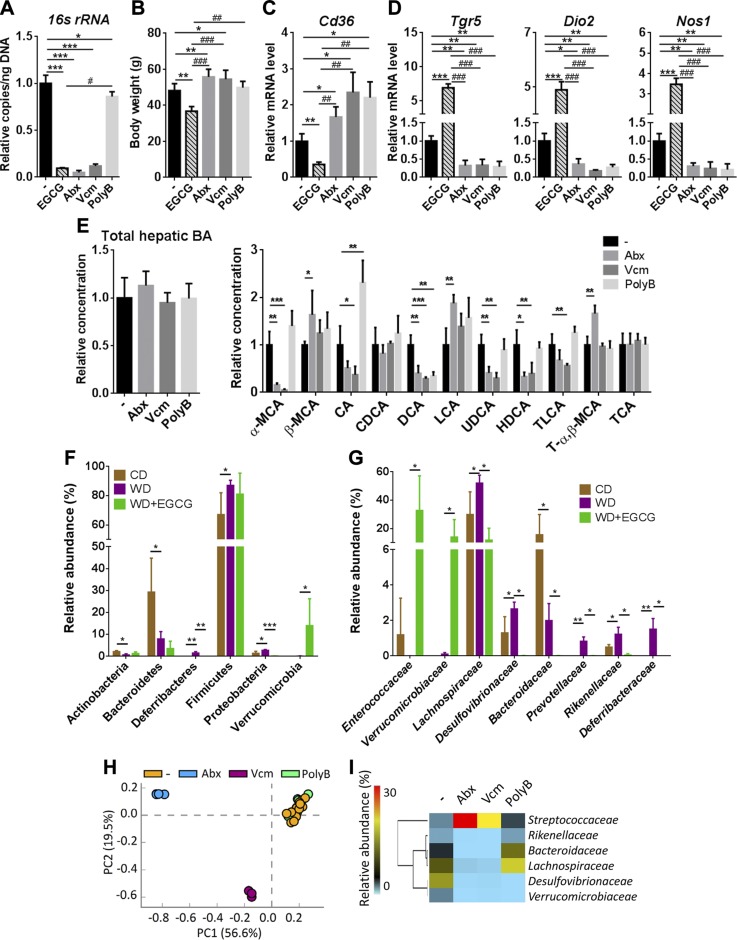
Both EGCG and antibiotics reduced the copy number of the cecal 16S ribosomal RNA gene (Fig. 7A). However, opposite to the effect of EGCG, Abx and Vcm, increased body weight; whereas PolyB had no significant effect (Fig. 7B). All 3 antibiotic treatments had no effect in changing fasting blood glucose level and insulin sensitivity (Supplemental Fig. 3A). Moreover, all 3 antibiotic treatments increased the adipose Cd36 mRNA level and decreased the hepatic mRNA levels of Tgr5, Dio2, and Nos1, which was opposite the effect of EGCG (Fig. 7C, D). In addition, none of the antibiotic treatments increased Tgr5 mRNA as did EGCG in the liver, adipose tissue, and ileum (Supplemental Fig. 3B, C). Furthermore, the apparent changes in lipid gene expression found in EGCG-treated mice were not observed in antibiotic-treated mice (Supplemental Fig. 3B). It is interesting to note that only Vcm and PolyB reduced ileal Fgf15, Ibabp, and Ostb (Supplemental Fig. 3C), but all 3 antibiotic treatments reduced hepatic Cyp7a1 and Cyp7b1 mRNA levels (Supplemental Fig. 3D). The hepatic BA profile was also different between antibiotic- and EGCG-treated mice. All 3 antibiotic treatments reduced DCA. Moreover, none of the antibiotic treatments increased hepatic CDCA or TLCA (Fig. 7E).
Figure 7.
The effect of EGCG and antibiotics on gut bacteria, gene expression, and hepatic BA profile in WD-fed mice. A) The antibacterial effect of EGCG and antibiotics. B) Body weight of EGCG and antibiotic-treated mice. C) Cd36 mRNA levels in the adipose tissue of EGCG and antibiotic-treated mice. D) The expression of the Tgr5 gene and TGR-5–regulated signaling genes in the liver of EGCG and antibiotic-treated mice. E) Total hepatic and individual BAs in antibiotic-treated mice. F, G) Cecal microbiota composition at the phylum level (F) and relative abundance at the family level (G) in CD- and WD-fed mice and mice without and without EGCG supplementation. Data are means ± sd. Mann-Whitney U test. H) A PCA plot of cecal microbiota at family level in antibiotic-treated mice. I) The effect of antibiotics in the abundance of bacterial families (mean relative abundance) (n = 3–4 in EGCG and antibiotic-treated groups; n = 16 for the nontreated group in the antibiotics experiment). Data are means ± sd. *P < 0.05, **P < 0.01, ***P < 0.001, vs. WD-fed untreated group; #P < 0.05, ##P < 0.01, ###P < 0.001 vs. EGCG-treated mice (2-tailed Student’s t test or 1-way ANOVA with Tukey’s correction).
Despite the effect of EGCG on reducing gut microbiota, the most apparent change in response to EGCG was increased abundance of the Verrucomicrobia phylum. In addition, EGCG reduced Deferribacteres and Proteobacteria (Fig. 7F). At the family level, EGCG substantially increased the abundance of Enterococcaceae and Verrucomicrobiaceae (>140-fold) (Fig. 7G). Moreover, EGCG reduced the abundance of Lachnospiraceae, Desulfovibrionaceae, Bacteroidaceae, Prevotellaceae, Rikenellaceae, and Deferribacteraceae, of which most were increased by WD (Fig. 7G).
Abx and Vcm, which increased body weight, had a greater impact on shifting gut microbiota than PolyB (Fig. 7H, I). A PCA plot showed untreated and PolyB-treated mice clustered together (Fig. 7H). In contrast to the effect of EGCG, Verrucomicrobiaceae was reduced by Abx and Vcm, and Enterococcaceae was undetectable after antibiotic treatment (Fig. 7I). However, EGCG as well as Abx and Vcm all reduced the abundance of Rikenellaceae, Bacteroidaceae, Lachnospiraceae, and Desulfovibrionaceae. Moreover, Abx and Vcm enriched Streptococcaceae, but EGCG had no effect on its abundance.
Integrated relationship between metabolites and gut microbiota
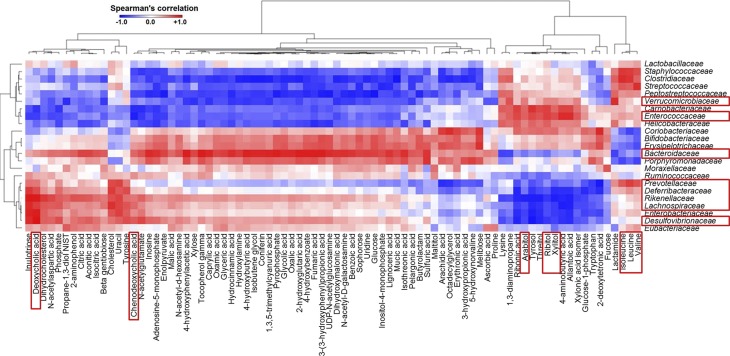
The relationships between gut microbiota and the 253 known metabolites in the cecum of CD-, WD-, and WD+EGCG–fed mice were uncovered (Supplemental Fig. 4). Specifically, 82 metabolites, which were significantly changed by diet or EGCG supplementation, were used to perform Spearman’s correlation analysis with 23 bacterial families found in the mice (Fig. 8). The results revealed that the abundance of Verrucomicrobiaceae and Enterococcaceae families, which clustered closely, correlated positively with sugar alcohols (xylitol, ribitol, and arabitol), but negatively with cholic acids (DCA and CDCA). On the contrary, Prevotellaceae, Deferribacteraceae, Rikenellaceae, Lachnospiraceae, and Desulfovibrionaceae, which clustered together, were negatively and positively associated with sugar alcohols and cholic acids, respectively. Moreover, Bacteroidaceae were negatively associated with sugar alcohols and branched-chain amino acids (isoleucine, leucine, and valine) (Fig. 8).
Figure 8.
A heat map generated by Spearman’s correlation analysis reveals the relationship between the abundance of bacterial families and 81 metabolites that are significantly changed by diet or EGCG supplementation.
Supplementation of A. muciniphila reduces body weight and regulates lipid metabolism
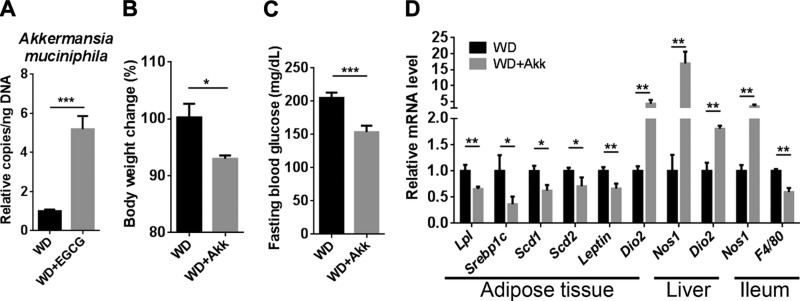
Because Verrucomicrobiaceae was markedly increased after EGCG supplementation, we quantified the abundance of A. muciniphila, a main species in the Verrucomicrobiaceae family. The data revealed that EGCG increased the abundance of A. muciniphila by 500%, even though EGCG reduced total bacteria by 90% (Figs. 7A and 9A). To understand the potential beneficial effect of A. muciniphila in diet-induced obesity, A. muciniphila was provided to WD-fed mice. The data showed that the bacterium significantly reduced body weight and fasting blood glucose level (Fig. 9B, C). Consistent with the changes found in EGCG-treated mice, the expression of genes involved in adipogenesis (Lpl and Srebp1c), monounsaturated fatty acids synthesis (Scd1 and Scd2), and adipocyte-derived hormonal factor (Leptin), were reduced in the white adipose tissue after A. muciniphila supplementation (Fig. 9D). Moreover, the expression of Dio2, Nos1, or both was induced in the adipose tissue, liver, and ileum.
Figure 9.
The effect of A. muciniphila in WD-fed mice. Copy number of A. muciniphila in EGCG-treated mice (A); body weight change after A. muciniphila supplementation (B); fasting blood glucose level (C); gene expression in the adipose tissue, liver, and ileum (D) (n = 3–4). *P < 0.05, **P < 0.01, ***P < 0.001 (2-tailed Student’s t test).
DISCUSSION
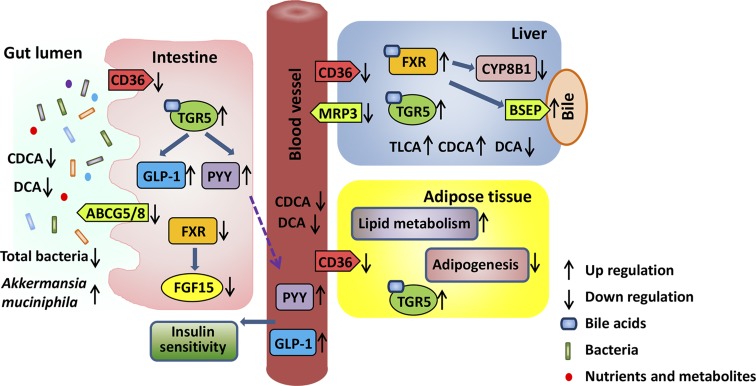
This study revealed that dietary supplementation of EGCG altered BA synthesis and shifted gut microbiota, which in turn is most likely mediated through FXR- and TGR-5–regulated signaling to reduce body fat (Fig. 10). Lipid gene profiling revealed that the effect of EGCG was greater in the adipose tissue than in the liver and intestines. Consistently, EGCG reduced WD-increased the fat:body weight ratio, but not the liver:body weight ratio. Nevertheless, the reduced CD36 was consistently found in visceral fat, liver, and ileum. CD36 is responsible for membrane transport of long-chain fatty acids, which is highly induced in the adipose tissues of obese patients or those with type 2 diabetes (56, 57). In addition, CD36 KO mice are protected from diet-induced weight gain (58). Moreover, it has been shown that EGCG increases fecal lipid content (59–61). Thus, it is likely that EGCG reduces body fat by decreasing fatty acid uptake and increasing excretion. PPAR-γ and SREBP-1C, the key transcriptional factors for adipocyte differentiation and lipid accumulation (62, 63), regulate the expression of adipogenic genes, such as Fasn and Lpl (64). The reduced protein level of PPAR-γ, SREBP-1C, and FASN influenced by EGCG suggests reduced adipogenesis in the adipose tissue. In addition, EGCG decreased Scd1 and Scd2, but increased Cyp4a10, suggesting reduced fatty acid synthesis and enhanced fatty acid oxidation in the visceral fat. It is likely that EGCG inhibits fatty acid uptake and adipogenesis, but increases fatty acid oxidation in the adipose tissue.
Figure 10.
The systemic effects of EGCG. EGCG reduces CD36 in the liver, adipose tissue, and intestine, indicating its systemic effect on reducing fatty acid uptake. In addition, EGCG reduces the sterol transporters Abcg5 and -8 mRNA in the intestine. In the adipose tissue, EGCG increases lipid metabolism and reduces adipogenesis, resulting in body weight loss. In bile acid–regulated pathways, EGCG increases hepatic FXR agonist CDCA and enhances FXR inhibitory effect on CYP8B1 mRNA and protein level. FXR activation regulates ATP-binding cassette transporters, such as the bile salt export pump (BSEP) and multidrug resistance protein (MRP)-3, leading to BAs and xenobiotics excretion. In the intestine, the transcriptional activity of FXR is reduced, revealed by reduced FGF-15 mRNA and protein level. Moreover, EGCG increases TGR-5 activity, as revealed by increased GLP-1 secretion, elevated serum PYY, and increased Tgr5 mRNA. Moreover, EGCG has an antibacterial effect, but enriches A. muciniphila, which has metabolic benefits. EGCG has systemic effects on improving metabolism and controlling body weight via altering gut microbiota community.
Supplementation of EGCG in WD-fed mice markedly induced the expression level of hepatic, adipose, and ileal Tgr5. Activation of TGR-5 induces metabolism, improves insulin sensitivity, and has anti-inflammatory effects (65). Consistently, EGCG reduced WD-induced F4/80 in the visceral fat, liver, and ileum. In contrast to activation, TGR-5 KO mice have increased body fat and weight as well as inflammatory signaling (34, 66). Administration of the TGR-5 agonists INT-777 or INT-767 reduces diet-induced steatosis and insulin resistance (34, 41). In the current study, because EGCG increased the expression of Tgr5 and the concentration of TGR-5 agonists (i.e., TLCA and LCA), it is likely that EGCG activates TGR-5 and its associated signaling. This notion is also supported by the findings that EGCG increased the expression of TGR-5 target genes, including Dio2 and Nos1 (39). Moreover, consistent with our data that showed that WD-fed mice had reduced Dio2 in their visceral fat and ileum, patients with obesity also have reduced DIO-2 in their white adipose tissues (67). In addition, the increased expression of ileal Nos1 may suppress intestinal motility, leading to reduced food digestibility and increased fecal energy content (68, 69). Moreover, EGCG-activated Tgr5 signaling that increases serum PYY level and GLP-1 release may in part explain improved insulin sensitivity in EGCG-supplemented WD-fed mice.
Our data also indicated that EGCG may activate hepatic FXR, while deactivating intestinal FXR. EGCG increased the hepatic BA alternative synthesis pathway by increasing the expression of hepatic Cyp7b1, leading to increased MCA and CDCA. CDCA is the endogenous ligand for FXR, and bacteria convert MCA to LCA and TLCA, which are TGR-5 agonists. Moreover, EGCG-activated hepatic FXR can lead to reduced BA synthesis, as evidenced by decreased expression of hepatic Cyp7a1 and Cyp8b1. Thus, WD-increased total serum BA was reduced by EGCG. The EGCG-reduced CYP8B1 may contribute to body weight loss, as well as improved insulin sensitivity, given that CYP8B1 KO mice are resistant to diet-induced obesity and have improved glucose homeostasis related to increased GLP-1 secretion (70, 71). Although ileum FXR protein level was increased, the markedly reduced intestinal CDCA level may have led to reduced intestinal FXR activity. Deactivation of intestinal FXR may have some benefits. It has been shown that intestinal FXR KO mice are resistant to diet-induced obesity and insulin resistance by increasing ileal lipid oxidation and decreasing serum sphingolipids (13). Moreover, intestinal FXR KO mice are protected from diet-induced steatohepatitis by inhibiting the ceramide/SREBP-1C/cell death-inducing DNA fragmentation factor–like effector-A pathway (23).
Our novel data show that EGCG substantially enriched Enterococcaceae (5000-fold) and Verrucomicrobiaceae (140-fold). It has been shown that the abundance of Enterococcaceae correlates negatively with obesity affected by diet or exercise (72, 73). Regarding Verrucomicrobiaceae, mucin-degrading A. muciniphila, which is present in the human digestive tract at 3–5%, is crucial for regulating the gut barrier function (74). In addition, A. muciniphila treatment can reverse fat-mass gain, metabolic endotoxemia, adipose tissue macrophage infiltration, and insulin resistance caused by a high-fat diet (75). Moreover, green tea–reduced body fat and plasma leptin are accompanied by increased A. muciniphila (76, 77). In contrast to the effect of EGCG, which enriched Enterococcaceae and Verrucomicrobiaceae, Abx and Vcm eliminated them, which was consistent with their effect on body weight gain. These findings clearly indicate the differential effects of EGCG and antibiotics in inhibiting gut microbes, as well as their potential impact on weight gain. Our data suggest that EGCG-enriched A. muciniphila and BA receptor activation contribute to the metabolic beneficial effects of EGCG.
There are a few potentially interesting topics that are not addressed in this article. It would be interesting and important to compare the effect of EGCG in healthy and obese mice to determine whether EGCG has added benefits when mice are lean. In addition, it may be of interest to determine whether the effect of EGCG in shifting gut microbiota community structure is diet dependent. Whether EGCG and A. muciniphila would be a synbiotic treatment for obesity-associated comorbidities also warrants investigation. Furthermore, we covered only adipose tissue, liver, and intestine in this study. Other organs such as kidney can be included for further study, because it also expresses modest levels of FXR and many ATP-binding cassette transporters and other transporters (78, 79). Moreover, it would be interesting to study further how probiotics, such as those of the Enterococcus genus and A. muciniphila, or their metabolites can regulate host TGR-5 and FXR signaling leading to reduced fatty acid uptake and adipogenesis and increased fatty acid metabolism. Our data have shown that dietary catechin intervention and probiotics have potential as treatments to prevent obesity.
Supplementary Material
This article includes supplemental data. Please visit http://www.fasebj.org to obtain this information.
ACKNOWLEDGMENTS
The authors thank Dr. Frank J. Gonzalez [U.S. National Institutes of Health (NIH) National Cancer Institute] for providing FXR KO mice, and Dr. Mel Campbell (University of California, Davis) for editing the manuscript. This study was supported by NIH National Cancer Institute Grants U01CA179582 and R01CA222490 (to Y.-J. Y. Wan). The authors declare no conflicts of interest.
Glossary
- Abcg
ATP-binding cassette subfamily G
- Abx
mix of antibiotics including ampicillin, neomycin, metronidazole, and vancomycin
- AUC
area under the curve
- BA
bile acid
- CD
control diet
- CDCA
chenodeoxycholic acid
- Cyp7a1
cholesterol 7α-hydroxylase
- Cyp7b1
oxysterol 7α-hydroxylase
- Cyp8b1
sterol 12α-hydroxylase
- DCA
deoxycholic acid
- DIO
iodothyronine deiodinase
- EGCG
epigallocatechin-3-gallate
- Fasn
fatty acid synthase
- FGF
fibroblast growth factor
- FXR
farnesoid x receptor
- GC-TOF-MS
gas chromatography–time-of-flight mass spectrometry
- GLP
glucagon-like peptide
- Ibabp
ileal bile acid binding protein
- KO
knockout
- Lpl
lipoprotein lipase
- Mrp
multidrug-resistance-protein
- Oat
organic anion transporter
- Ost
organic solute transporter
- PCA
principal component analysis
- PolyB
polymyxin B
- Ppar
peroxisome proliferator–activated receptor
- PYY
peptide tyrosine tyrosine
- qPCR
quantitative PCR
- SCD
stearoyl-CoA desaturase
- SHP
small heterodimer partner
- Srebp
sterol regulatory element-binding protein
- TGR
Takeda G protein receptor
- TLCA
taurine-conjugated lithocholic acid
- Vcm
vancomycin
- WD
Western diet
- WT
wild type
Footnotes
This article includes supplemental data. Please visit http://www.fasebj.org to obtain this information.
AUTHOR CONTRIBUTIONS
Y.-J. Y. Wan designed and supervised the implementation of the study; L. Sheng, P. K. Jena, H.-X. Liu, Y. Hu, N. Nagar, and D. N. Bronner performed experiments; L. Sheng, P. K. Jena, and Y.-J. Y. Wan wrote the manuscript; and all authors analyzed and interpreted the data, commented on, and approved the final manuscript.
REFERENCES
- 1.Sudano Roccaro A., Blanco A. R., Giuliano F., Rusciano D., Enea V. (2004) Epigallocatechin-gallate enhances the activity of tetracycline in staphylococci by inhibiting its efflux from bacterial cells. Antimicrob. Agents Chemother. 48, 1968–1973 [DOI] [PMC free article] [PubMed] [Google Scholar]
- 2.Weber J. M., Ruzindana-Umunyana A., Imbeault L., Sircar S. (2003) Inhibition of adenovirus infection and adenain by green tea catechins. Antiviral Res. 58, 167–173 [DOI] [PubMed] [Google Scholar]
- 3.Weinreb O., Mandel S., Amit T., Youdim M. B. (2004) Neurological mechanisms of green tea polyphenols in Alzheimer’s and Parkinson’s diseases. J. Nutr. Biochem. 15, 506–516 [DOI] [PubMed] [Google Scholar]
- 4.Raederstorff D. G., Schlachter M. F., Elste V., Weber P. (2003) Effect of EGCG on lipid absorption and plasma lipid levels in rats. J. Nutr. Biochem. 14, 326–332 [DOI] [PubMed] [Google Scholar]
- 5.Singh B. N., Shankar S., Srivastava R. K. (2011) Green tea catechin, epigallocatechin-3-gallate (EGCG): mechanisms, perspectives and clinical applications. Biochem. Pharmacol. 82, 1807–1821 [DOI] [PMC free article] [PubMed] [Google Scholar]
- 6.Kim H. M., Kim J. (2013) The effects of green tea on obesity and type 2 diabetes. Diabetes Metab. J. 37, 173–175 [DOI] [PMC free article] [PubMed] [Google Scholar]
- 7.Kao Y. H., Chang H. H., Lee M. J., Chen C. L. (2006) Tea, obesity, and diabetes. Mol. Nutr. Food Res. 50, 188–210 [DOI] [PubMed] [Google Scholar]
- 8.Chen Y. K., Cheung C., Reuhl K. R., Liu A. B., Lee M. J., Lu Y. P., Yang C. S. (2011) Effects of green tea polyphenol (−)-epigallocatechin-3-gallate on newly developed high-fat/Western-style diet-induced obesity and metabolic syndrome in mice. J. Agric. Food Chem. 59, 11862–11871 [DOI] [PMC free article] [PubMed] [Google Scholar]
- 9.Lee M. S., Kim C. T., Kim Y. (2009) Green tea (−)-epigallocatechin-3-gallate reduces body weight with regulation of multiple genes expression in adipose tissue of diet-induced obese mice. Ann. Nutr. Metab. 54, 151–157 [DOI] [PubMed] [Google Scholar]
- 10.Jang H. J., Ridgeway S. D., Kim J. A. (2013) Effects of the green tea polyphenol epigallocatechin-3-gallate on high-fat diet-induced insulin resistance and endothelial dysfunction. Am. J. Physiol. Endocrinol. Metab. 305, E1444–E1451 [DOI] [PMC free article] [PubMed] [Google Scholar]
- 11.Kim H. S., Quon M. J., Kim J. A. (2014) New insights into the mechanisms of polyphenols beyond antioxidant properties; lessons from the green tea polyphenol, epigallocatechin 3-gallate. Redox Biol. 2, 187–195 [DOI] [PMC free article] [PubMed] [Google Scholar]
- 12.Inagaki T., Moschetta A., Lee Y. K., Peng L., Zhao G., Downes M., Yu R. T., Shelton J. M., Richardson J. A., Repa J. J., Mangelsdorf D. J., Kliewer S. A. (2006) Regulation of antibacterial defense in the small intestine by the nuclear bile acid receptor. Proc. Natl. Acad. Sci. USA 103, 3920–3925 [DOI] [PMC free article] [PubMed] [Google Scholar]
- 13.Li F., Jiang C., Krausz K. W., Li Y., Albert I., Hao H., Fabre K. M., Mitchell J. B., Patterson A. D., Gonzalez F. J. (2013) Microbiome remodelling leads to inhibition of intestinal farnesoid X receptor signalling and decreased obesity. Nat. Commun. 4, 2384 [DOI] [PMC free article] [PubMed] [Google Scholar]
- 14.Parséus A., Sommer N., Sommer F., Caesar R., Molinaro A., Ståhlman M., Greiner T. U., Perkins R., Bäckhed F. (2017) Microbiota-induced obesity requires farnesoid X receptor. Gut 66, 429–437 [DOI] [PMC free article] [PubMed] [Google Scholar]
- 15.Lefebvre P., Cariou B., Lien F., Kuipers F., Staels B. (2009) Role of bile acids and bile acid receptors in metabolic regulation. Physiol. Rev. 89, 147–191 [DOI] [PubMed] [Google Scholar]
- 16.Jones B. V., Begley M., Hill C., Gahan C. G. M., Marchesi J. R. (2008) Functional and comparative metagenomic analysis of bile salt hydrolase activity in the human gut microbiome. Proc. Natl. Acad. Sci. USA 105, 13580–13585 [DOI] [PMC free article] [PubMed] [Google Scholar]
- 17.Li T., Chiang J. Y. (2015) Bile acids as metabolic regulators. Curr. Opin. Gastroenterol. 31, 159–165 [DOI] [PMC free article] [PubMed] [Google Scholar]
- 18.Li T., Chiang J. Y. (2014) Bile acid signaling in metabolic disease and drug therapy. Pharmacol. Rev. 66, 948–983 [DOI] [PMC free article] [PubMed] [Google Scholar]
- 19.Liu H. X., Keane R., Sheng L., Wan Y. J. (2015) Implications of microbiota and bile acid in liver injury and regeneration. J. Hepatol. 63, 1502–1510 [DOI] [PMC free article] [PubMed] [Google Scholar]
- 20.Sheng L., Jena P. K., Liu H. X., Kalanetra K. M., Gonzalez F. J., French S. W., Krishnan V. V., Mills D. A., Wan Y. Y. (2017) Gender differences in bile acids and microbiota in relationship with gender dissimilarity in steatosis induced by diet and FXR inactivation. Sci. Rep. 7, 1748 [DOI] [PMC free article] [PubMed] [Google Scholar]
- 21.Jena P. K., Sheng L., Liu H. X., Kalanetra K. M., Mirsoian A., Murphy W. J., French S. W., Krishnan V. V., Mills D. A., Wan Y. Y. (2017) Western diet-induced dysbiosis in farnesoid X receptor knockout mice causes persistent hepatic inflammation after antibiotic treatment. Am. J. Pathol. 187, 1800–1813 [DOI] [PMC free article] [PubMed] [Google Scholar]
- 22.Sheng L., Jena P. K., Hu Y., Liu H. X., Nagar N., Kalanetra K. M., French S. W., French S. W., Mills D. A., Wan Y. Y. (2017) Hepatic inflammation caused by dysregulated bile acid synthesis is reversible by butyrate supplementation. J. Pathol. 243, 431–441 [DOI] [PMC free article] [PubMed] [Google Scholar]
- 23.Jiang C., Xie C., Li F., Zhang L., Nichols R. G., Krausz K. W., Cai J., Qi Y., Fang Z. Z., Takahashi S., Tanaka N., Desai D., Amin S. G., Albert I., Patterson A. D., Gonzalez F. J. (2015) Intestinal farnesoid X receptor signaling promotes nonalcoholic fatty liver disease. J. Clin. Invest. 125, 386–402 [DOI] [PMC free article] [PubMed] [Google Scholar]
- 24.Lee F. Y., Lee H., Hubbert M. L., Edwards P. A., Zhang Y. (2006) FXR, a multipurpose nuclear receptor. Trends Biochem. Sci. 31, 572–580 [DOI] [PubMed] [Google Scholar]
- 25.Wang Y. D., Chen W. D., Moore D. D., Huang W. (2008) FXR: a metabolic regulator and cell protector. Cell Res. 18, 1087–1095 [DOI] [PubMed] [Google Scholar]
- 26.Modica S., Gadaleta R. M., Moschetta A. (2010) Deciphering the nuclear bile acid receptor FXR paradigm. Nucl. Recept. Signal. 8, e005. [DOI] [PMC free article] [PubMed] [Google Scholar]
- 27.Zhu Y., Li F., Guo G. L. (2011) Tissue-specific function of farnesoid X receptor in liver and intestine. Pharmacol. Res. 63, 259–265 [DOI] [PMC free article] [PubMed] [Google Scholar]
- 28.Li Y., Jadhav K., Zhang Y. (2013) Bile acid receptors in non-alcoholic fatty liver disease. Biochem. Pharmacol. 86, 1517–1524 [DOI] [PMC free article] [PubMed] [Google Scholar]
- 29.Perez M. J., Briz O. (2009) Bile-acid-induced cell injury and protection. World J. Gastroenterol. 15, 1677–1689 [DOI] [PMC free article] [PubMed] [Google Scholar]
- 30.Delzenne N. M., Calderon P. B., Taper H. S., Roberfroid M. B. (1992) Comparative hepatotoxicity of cholic acid, deoxycholic acid and lithocholic acid in the rat: in vivo and in vitro studies. Toxicol. Lett. 61, 291–304 [DOI] [PubMed] [Google Scholar]
- 31.Xu J., Gu W., Li C., Li X., Xing G., Li Y., Song Y., Zheng W. (2016) Epigallocatechin gallate inhibits hepatitis B virus via farnesoid X receptor alpha. J. Nat. Med. 70, 584–591 [DOI] [PubMed] [Google Scholar]
- 32.Li G., Lin W., Araya J. J., Chen T., Timmermann B. N., Guo G. L. (2012) A tea catechin, epigallocatechin-3-gallate, is a unique modulator of the farnesoid X receptor. Toxicol. Appl. Pharmacol. 258, 268–274 [DOI] [PMC free article] [PubMed] [Google Scholar]
- 33.Duboc H., Taché Y., Hofmann A. F. (2014) The bile acid TGR5 membrane receptor: from basic research to clinical application. Dig. Liver Dis. 46, 302–312 [DOI] [PMC free article] [PubMed] [Google Scholar]
- 34.Thomas C., Gioiello A., Noriega L., Strehle A., Oury J., Rizzo G., Macchiarulo A., Yamamoto H., Mataki C., Pruzanski M., Pellicciari R., Auwerx J., Schoonjans K. (2009) TGR5-mediated bile acid sensing controls glucose homeostasis. Cell Metab. 10, 167–177 [DOI] [PMC free article] [PubMed] [Google Scholar]
- 35.Harach T., Pols T. W., Nomura M., Maida A., Watanabe M., Auwerx J., Schoonjans K. (2012) TGR5 potentiates GLP-1 secretion in response to anionic exchange resins. Sci. Rep. 2, 430 [DOI] [PMC free article] [PubMed] [Google Scholar]
- 36.Hayes M. R., Mietlicki-Baase E. G., Kanoski S. E., De Jonghe B. C. (2014) Incretins and amylin: neuroendocrine communication between the gut, pancreas, and brain in control of food intake and blood glucose. Annu. Rev. Nutr. 34, 237–260 [DOI] [PMC free article] [PubMed] [Google Scholar]
- 37.Moran T. H., Smedh U., Kinzig K. P., Scott K. A., Knipp S., Ladenheim E. E. (2005) Peptide YY(3-36) inhibits gastric emptying and produces acute reductions in food intake in rhesus monkeys. Am. J. Physiol. Regul. Integr. Comp. Physiol. 288, R384–R388 [DOI] [PubMed] [Google Scholar]
- 38.De la Fuente M., Bernaez I., Del Rio M., Hernanz A. (1993) Stimulation of murine peritoneal macrophage functions by neuropeptide Y and peptide YY. Involvement of protein kinase C. Immunology 80, 259–265 [PMC free article] [PubMed] [Google Scholar]
- 39.Guo C., Chen W. D., Wang Y. D. (2016) TGR5, not only a metabolic regulator. Front. Physiol. 7, 646 [DOI] [PMC free article] [PubMed] [Google Scholar]
- 40.Sinal C. J., Tohkin M., Miyata M., Ward J. M., Lambert G., Gonzalez F. J. (2000) Targeted disruption of the nuclear receptor FXR/BAR impairs bile acid and lipid homeostasis. Cell 102, 731–744 [DOI] [PubMed] [Google Scholar]
- 41.Pathak P., Liu H., Boehme S., Xie C., Krausz K. W., Gonzalez F., Chiang J. Y. L. (2017) Farnesoid X receptor induces Takeda G-protein receptor 5 cross-talk to regulate bile acid synthesis and hepatic metabolism. J. Biol. Chem. 292, 11055–11069 [DOI] [PMC free article] [PubMed] [Google Scholar]
- 42.Fiehn O., Wohlgemuth G., Scholz M., Kind T., Lee D. Y., Lu Y., Moon S., Nikolau B. (2008) Quality control for plant metabolomics: reporting MSI-compliant studies. Plant J. 53, 691–704 [DOI] [PubMed] [Google Scholar]
- 43.Fiehn O., Wohlgemuth G., Scholz M. (2005) Setup and annotation of metabolomic experiments by integrating biological and mass spectrometric metadata. Data Integr. Life Sci. 3615, 224–239 [Google Scholar]
- 44.Scholz M., Fiehn O. (2007) SetupX: a public study design database for metabolomic projects. Pac. Symp. Biocomput. 2007, 169–180 (abstr.) [PubMed] [Google Scholar]
- 45.Kind T., Tolstikov V., Fiehn O., Weiss R. H. (2007) A comprehensive urinary metabolomic approach for identifying kidney cancer. Anal. Biochem. 363, 185–195 [DOI] [PubMed] [Google Scholar]
- 46.Xia J., Wishart D. S. (2016) Using MetaboAnalyst 3.0 for comprehensive metabolomics data analysis. Curr. Protoc. Bioinformatics 55, 14.10.1–14.10.91 [DOI] [PubMed] [Google Scholar]
- 47.Barupal D. K., Fiehn O. (2017) Chemical similarity enrichment analysis (ChemRICH) as alternative to biochemical pathway mapping for metabolomic datasets. Sci. Rep. 7, 14567 [DOI] [PMC free article] [PubMed] [Google Scholar]
- 48.Williams J. E., Carrothers J. M., Lackey K. A., Beatty N. F., York M. A., Brooker S. L., Shafii B., Price W. J., Settles M. L., McGuire M. A., McGuire M. K. (2017) Human milk microbial community structure is relatively stable and related to variations in macronutrient and micronutrient intakes in healthy lactating women. J. Nutr. 147, 1739–1748 [DOI] [PMC free article] [PubMed] [Google Scholar]
- 49.Frese S. A., Parker K., Calvert C. C., Mills D. A. (2015) Diet shapes the gut microbiome of pigs during nursing and weaning. Microbiome 3, 28 [DOI] [PMC free article] [PubMed] [Google Scholar]
- 50.Wang Q., Garrity G. M., Tiedje J. M., Cole J. R. (2007) Naive Bayesian classifier for rapid assignment of rRNA sequences into the new bacterial taxonomy. Appl. Environ. Microbiol. 73, 5261–5267 [DOI] [PMC free article] [PubMed] [Google Scholar]
- 51.Adachi H., Kondo T., Koh G. Y., Nagy A., Oike Y., Araki E. (2011) Angptl4 deficiency decreases serum triglyceride levels in low-density lipoprotein receptor knockout mice and streptozotocin-induced diabetic mice. Biochem. Biophys. Res. Commun. 409, 177–180 [DOI] [PubMed] [Google Scholar]
- 52.Klok M. D., Jakobsdottir S., Drent M. L. (2007) The role of leptin and ghrelin in the regulation of food intake and body weight in humans: a review. Obes. Rev. 8, 21–34 [DOI] [PubMed] [Google Scholar]
- 53.Bush K. T., Wu W., Lun C., Nigam S. K. (2017) The drug transporter OAT3 (SLC22A8) and endogenous metabolite communication via the gut-liver-kidney axis. J. Biol. Chem. 292, 15789–15803 [DOI] [PMC free article] [PubMed] [Google Scholar]
- 54.Wong C. P., Nguyen L. P., Noh S. K., Bray T. M., Bruno R. S., Ho E. (2011) Induction of regulatory T cells by green tea polyphenol EGCG. Immunol. Lett. 139, 7–13 [DOI] [PMC free article] [PubMed] [Google Scholar]
- 55.Zhou H., Zhou S., Gao J., Zhang G., Lu Y., Owyang C. (2015) Upregulation of bile acid receptor TGR5 and nNOS in gastric myenteric plexus is responsible for delayed gastric emptying after chronic high-fat feeding in rats. Am. J. Physiol. Gastrointest. Liver Physiol. 308, G863–G873 [DOI] [PMC free article] [PubMed] [Google Scholar]
- 56.Ibrahimi A., Abumrad N. A. (2002) Role of CD36 in membrane transport of long-chain fatty acids. Curr. Opin. Clin. Nutr. Metab. Care 5, 139–145 [DOI] [PubMed] [Google Scholar]
- 57.Bonen A., Tandon N. N., Glatz J. F., Luiken J. J., Heigenhauser G. J. (2006) The fatty acid transporter FAT/CD36 is upregulated in subcutaneous and visceral adipose tissues in human obesity and type 2 diabetes. Int. J. Obes. 30, 877–883 [DOI] [PubMed] [Google Scholar]
- 58.Hajri T., Hall A. M., Jensen D. R., Pietka T. A., Drover V. A., Tao H., Eckel R., Abumrad N. A. (2007) CD36-facilitated fatty acid uptake inhibits leptin production and signaling in adipose tissue. Diabetes 56, 1872–1880 [DOI] [PubMed] [Google Scholar]
- 59.Sae-Tan S., Grove K. A., Kennett M. J., Lambert J. D. (2011) (−)-Epigallocatechin-3-gallate increases the expression of genes related to fat oxidation in the skeletal muscle of high fat-fed mice. Food Funct. 2, 111–116 [DOI] [PMC free article] [PubMed] [Google Scholar]
- 60.Lee M. S., Shin Y., Jung S., Kim Y. (2017) Effects of epigallocatechin-3-gallate on thermogenesis and mitochondrial biogenesis in brown adipose tissues of diet-induced obese mice. Food Nutr. Res. 61, 1325307 [DOI] [PMC free article] [PubMed] [Google Scholar]
- 61.Huang J., Feng S., Liu A., Dai Z., Wang H., Reuhl K., Lu W., Yang C. S. (2018) Green tea polyphenol EGCG alleviates metabolic abnormality and fatty liver by decreasing bile acid and lipid absorption in mice. Mol. Nutr. Food Res. 62 [DOI] [PMC free article] [PubMed] [Google Scholar]
- 62.Morrison R. F., Farmer S. R. (1999) Role of PPARgamma in regulating a cascade expression of cyclin-dependent kinase inhibitors, p18(INK4c) and p21(Waf1/Cip1), during adipogenesis. J. Biol. Chem. 274, 17088–17097 [DOI] [PubMed] [Google Scholar]
- 63.Kim J. B., Spiegelman B. M. (1996) ADD1/SREBP1 promotes adipocyte differentiation and gene expression linked to fatty acid metabolism. Genes Dev. 10, 1096–1107 [DOI] [PubMed] [Google Scholar]
- 64.Schoonjans K., Martin G., Staels B., Auwerx J. (1997) Peroxisome proliferator-activated receptors, orphans with ligands and functions. Curr. Opin. Lipidol. 8, 159–166 [DOI] [PubMed] [Google Scholar]
- 65.Chen X., Lou G., Meng Z., Huang W. (2011) TGR5: a novel target for weight maintenance and glucose metabolism. Exp. Diabetes Res. 2011, 853501 [DOI] [PMC free article] [PubMed] [Google Scholar]
- 66.Maruyama T., Tanaka K., Suzuki J., Miyoshi H., Harada N., Nakamura T., Miyamoto Y., Kanatani A., Tamai Y. (2006) Targeted disruption of G protein-coupled bile acid receptor 1 (Gpbar1/M-Bar) in mice. J. Endocrinol. 191, 197–205 [DOI] [PubMed] [Google Scholar]
- 67.Kurylowicz A., Jonas M., Lisik W., Jonas M., Wicik Z. A., Wierzbicki Z., Chmura A., Puzianowska-Kuznicka M. (2015) Obesity is associated with a decrease in expression but not with the hypermethylation of thermogenesis-related genes in adipose tissues. J. Transl. Med. 13, 31 [DOI] [PMC free article] [PubMed] [Google Scholar]
- 68.Poole D. P., Godfrey C., Cattaruzza F., Cottrell G. S., Kirkland J. G., Pelayo J. C., Bunnett N. W., Corvera C. U. (2010) Expression and function of the bile acid receptor GpBAR1 (TGR5) in the murine enteric nervous system. Neurogastroenterol. Motil. 22, 814–825, e227–e228 [DOI] [PMC free article] [PubMed] [Google Scholar]
- 69.Klaus S., Pültz S., Thöne-Reineke C., Wolfram S. (2005) Epigallocatechin gallate attenuates diet-induced obesity in mice by decreasing energy absorption and increasing fat oxidation. Int. J. Obes. 29, 615–623 [DOI] [PubMed] [Google Scholar]
- 70.Bertaggia E., Jensen K. K., Castro-Perez J., Xu Y., Di Paolo G., Chan R. B., Wang L., Haeusler R. A. (2017) Cyp8b1 ablation prevents Western diet-induced weight gain and hepatic steatosis because of impaired fat absorption. Am. J. Physiol. Endocrinol. Metab. 313, E121–E133 [DOI] [PMC free article] [PubMed] [Google Scholar]
- 71.Kaur A., Patankar J. V., de Haan W., Ruddle P., Wijesekara N., Groen A. K., Verchere C. B., Singaraja R. R., Hayden M. R. (2015) Loss of Cyp8b1 improves glucose homeostasis by increasing GLP-1. Diabetes 64, 1168–1179 [DOI] [PubMed] [Google Scholar]
- 72.Pfalzer A. C., Nesbeth P. D., Parnell L. D., Iyer L. K., Liu Z., Kane A. V., Chen C. Y., Tai A. K., Bowman T. A., Obin M. S., Mason J. B., Greenberg A. S., Choi S. W., Selhub J., Paul L., Crott J. W. (2015) Diet- and genetically-induced obesity differentially affect the fecal microbiome and metabolome in Apc1638N mice. PLoS One 10, e0135758 [DOI] [PMC free article] [PubMed] [Google Scholar]
- 73.Choi J. J., Eum S. Y., Rampersaud E., Daunert S., Abreu M. T., Toborek M. (2013) Exercise attenuates PCB-induced changes in the mouse gut microbiome. Environ. Health Perspect. 121, 725–730 [DOI] [PMC free article] [PubMed] [Google Scholar]
- 74.Derrien M., Vaughan E. E., Plugge C. M., de Vos W. M. (2004) Akkermansia muciniphila gen. nov., sp. nov., a human intestinal mucin-degrading bacterium. Int. J. Syst. Evol. Microbiol. 54, 1469–1476 [DOI] [PubMed] [Google Scholar]
- 75.Everard A., Belzer C., Geurts L., Ouwerkerk J. P., Druart C., Bindels L. B., Guiot Y., Derrien M., Muccioli G. G., Delzenne N. M., de Vos W. M., Cani P. D. (2013) Cross-talk between Akkermansia muciniphila and intestinal epithelium controls diet-induced obesity. Proc. Natl. Acad. Sci. USA 110, 9066–9071 [DOI] [PMC free article] [PubMed] [Google Scholar]
- 76.Axling U., Olsson C., Xu J., Fernandez C., Larsson S., Ström K., Ahrné S., Holm C., Molin G., Berger K. (2012) Green tea powder and Lactobacillus plantarum affect gut microbiota, lipid metabolism and inflammation in high-fat fed C57BL/6J mice. Nutr. Metab. (Lond.) 9, 105 [DOI] [PMC free article] [PubMed] [Google Scholar]
- 77.Liu Z., Chen Z., Guo H., He D., Zhao H., Wang Z., Zhang W., Liao L., Zhang C., Ni L. (2016) The modulatory effect of infusions of green tea, oolong tea, and black tea on gut microbiota in high-fat-induced obese mice. Food Funct. 7, 4869–4879 [DOI] [PubMed] [Google Scholar]
- 78.Nigam S. K. (2015) What do drug transporters really do? Nat. Rev. Drug Discov. 14, 29–44 [DOI] [PMC free article] [PubMed] [Google Scholar]
- 79.Wu W., Dnyanmote A. V., Nigam S. K. (2011) Remote communication through solute carriers and ATP binding cassette drug transporter pathways: an update on the remote sensing and signaling hypothesis. Mol. Pharmacol. 79, 795–805 [DOI] [PMC free article] [PubMed] [Google Scholar]
Associated Data
This section collects any data citations, data availability statements, or supplementary materials included in this article.


