

Abstract
Background & Aims:
Pancreatic ductal adenocarcinomas (PDACs) produce higher levels of truncated O-glycan structures (such as Tn and sTn) than normal pancreata. Dysregulated activity of core 1 synthase, glycoprotein-N-acetylgalactosamine 3-beta-galactosyltransferase 1 (C1GALT1) leads to increased expression of these truncated O-glycans. We investigated whether and how truncated O-glycans contributes to development and progression of PDAC using mice with disruption of C1galt1.
Methods:
We crossed C1galt1 floxed mice (C1galt1loxP/loxP) with KrasG12D/+; Trp53R172H/+; Pdx1- Cre mice (KPC mice) to create KPCC mice. Growth and progression of pancreatic tumors were compared between KPC and KPCC mice; pancreatic tissues were collected and analyzed by immunohistochemistry; immunofluorescence; and Sirius red, alcian blue, and lectin staining. We used the CRISPR/Cas9 system to disrupt C1GALT1 in human PDAC cells (T3M4 and CD18/HPAF) and levels of O-glycans were analyzed by lectin blotting, mass spectrometry and lectin-pull down assay. Orthotopic studies and RNA sequencing analyses are performed with control and C1GALT1 knockout PDAC cells. C1GALT1 expression was analyzed in well differentiated (n=36) and poorly differentiated (n=23) PDAC samples by immunohistochemistry.
Results:
KPCC mice had significantly shorter survival times (median, 102 days) than KPC mice (median, 200 days), and developed early pancreatic intraepithelial neoplasias at 3 weeks, PDAC at 5 weeks, and metastases at 10 weeks compared to KPC. Pancreatic tumors that developed in KPCC mice were more aggressive than those of KPC mice (more invasive and metastases), had a decreased amount of stroma, and had increased production of Tn. Poorly differentiated PDAC specimens had significantly lower levels of C1GALT1 than welldifferentiated PDACs. Human PDAC cells with knockout of C1GALT1 had aberrant glycosylation of MUC16 compared with control cells, and increased expression of genes that regulate tumorigenesis and metastasis.
Conclusions:
In studies of KPC mice with disruption of C1galt1, we found that loss of C1galt1 promotes development of aggressive PDACs and increased metastasis. Knockout of C1GALT1 leads to increased tumorigenicity and truncation of O-glycosylation on MUC16, which could contribute to increased aggressiveness.
Keywords: PanINs, Post-Translational Modification, Pancreas, Mouse Model
Graphical Abstract

Introduction
Pancreatic ductal adenocarcinoma (PDAC) is a devastating malignancy, as evinced by the dire statistics postulating that by 2030, it will be the second-leading cause of cancer-related deaths. 1, 2 The rapid progression of PDAC has been linked to acquisition of several genetic mutations in oncogenes such as Kras, and in tumor suppressor genes, including p16, p53, SMAD4/DPC4, as revealed by genetically engineered mouse models that harbor these mutations. 3–8 In addition to genetic variations, aberrant changes in mucin-type O-glycosylation (O-glycosylation) patterns are also observed in PDAC. 9–12 O-glycosylation is a post-translational modification in which carbohydrate moieties are attached to the serine/threonine residues on protein substrates. 13–16 Aberrant O-glycosylation in cancer refers to the appearance of unusual carbohydrate structures, such as Tn and sTn (often referred to as tumor-associated carbohydrate antigens). 17–20 However, the functional contribution of aberrant O-glycosylation to PDAC progression and metastasis remains unclear.
Altered expression or activity of O-glycosyltransferases under malignant conditions often results in impaired O-glycosylation and generation of truncated carbohydrate structures. 21 For example, elevated expression of Tn has been attributed to the inactive glycoprotein-Nacetylgalactosamine 3-beta-galactosyltransferase (C1GALT1). 22 C1GALT1 catalyzes the second step of mucin-type O-glycosylation by the addition of galactose to the first sugar, Nacetylgalactosamine (Tn carbohydrate antigen) that forms a core 1 carbohydrate structure (T antigen), and this usually extends to several carbohydrate structures. 23, 24 To our knowledge, to date the functional role of the loss of C1GALT1 and aberrant O-glycosylation in PDAC progression and metastasis remains unexplored. For insight into the specific role of aberrant glycosylation in PDAC progression, this study involves the generation and functional characterization of an O-glycosylation-deficient PDAC mouse model. Prior work by Xia et al. suggested that targeted deletion of C1galt1 in mice results in loss of core-1 O-glycans. 13, 25, 26 Therefore, we crossed C1galt1 floxed mice (C1galt1loxP/loxP) with the KPC (KrasG12D/+; Trp53R172H/+: Pdx-1-Cre) model of PDAC that resulted in KPCC (KrasG12D/+; Trp53R172H/+; C1galt1loxP/loxP; Pdx-1-Cre) mice, resulting in a pancreas-specific knockout of C1galt1 in addition to Kras and p53 mutations (Supplementary Figure 1A). We found that aberrant glycosylation by knockout of C1galt1 in an already established pancreas tumor setting (Kras and p53 mutations) led to early onset of tumors and metastatic lesions. These findings provide insights into the role of truncated O-glycans in PDAC progression and metastasis.
Materials and Methods
Genetically Engineered Mouse Models
KPC (KrasG12D/+; Trp53R172H/+: Pdx-1-Cre) and KPCC (KrasG12D/+; Trp53R172H/+; C1galt1loxP/loxP; Pdx-1-Cre) were created by breeding KrasG12D/+; Pdx1-Cre and LSLTrp53R1727H/+ with C1galt1loxP/loxP. Intercrossing of their F1 progeny resulted in generation of C1galt1-lacking KPCC mice along with KPC control littermates. All animals were back-crossed 12 times to C57BL/6 before breeding. For progression studies, KPC, KPCC, and age-matched controls were euthanized at 3, 5, 10, 15, and 20 weeks of age (five animals/group/time point). Survival studies were also conducted on KPC and KPCC mice (ten to eleven animals/group). All animal studies were performed in accordance with U.S. Public Health Service “Guidelines for the Care and Use of Laboratory Animals,” under an approved protocol by the University of Nebraska Medical Center Institutional Animal Care and Use Committee (IACUC).
CRISPR/Cas9 Knockout of C1GALT1 in PDAC Cells
Genomic depletion of C1GALT1 was carried out using CRISPR Vector (pX330-U6- Chimeric_BB-CBh-hSpCas9 vector, Addgene, 42230) with C1GALT1-specific guide RNA sequence and Lipofectamine 2000 (Invitrogen). At 2–3 weeks after transfection, VVAfluorescein-based FACS sorting was used to obtain C1GALT1 knockout clones. Complete knockout was confirmed by Western blotting using an anti-C1GALT1 antibody. The region around guide RNA was PCR-amplified and subjected to Sanger sequencing using primers described in Supplementary Table 2.
Other methods
Please see details in the Supplementary Materials and Methods for DNA isolation and genotyping, Cell lines and Whipple samples, Histology, Immunohistochemistry, Immunofluorescence and Lectin staining, Sirius Red and Alcian Blue staining, C1GALT1 Enzyme Activity Assay, O-glycan Analysis of PDAC cells, Development of Migratory Model of PDAC, Western Blotting and Lectin Blotting, Wound-healing Assay, Transwell Migration Assay, WST-1 Cell Proliferation Assay, Orthotopic Tumor Mouse Models, Lectin pulldown assay, RNAseq analysis, and Statistical Analysis.
Results
Deletion of C1galt1 (C1galt1−/−) Leads to Faster PDAC Progression and Decreased Survival
Previous studies describe how genomic instability conferred by endogenous expression of KrasG12D/+ and Trp53R172H/+ in the mouse pancreas leads to spontaneous development of PDAC. 27 We noted that knockout of C1galt1 (core-1 synthase) in KrasG12D/+; Trp53R172H/+; Pdx-1- Cre (KPC) background accelerated PDAC development (Figure 1A, B and Supplementary Figure 1B). Low-grade PanIN1 and 2 lesions were observed as early as 3 weeks (Figure 1C). At 5 weeks, 33% of KrasG12D/+; Trp53R172H/+; C1galt1loxP/loxP; Pdx1-Cre (KPCC) mice display high grade PanIN3 lesions, which increased to 60% by 10 weeks. The development of these highgrade lesions was extremely fast compared to KPC mice, which usually develop them by 10 weeks. Given that these high-grade lesions (also known as Carcinoma in situ) eventually lead to the development of PDAC, KPCC mice were evaluated at different time points to monitor PDAC progression, starting from 3 weeks to 20 weeks (Supplementary Figure 1A and Figure 1C). Fullblown pancreatic tumors were apparent as early as 5 weeks (40%) and the majority of 15-weeks (60%) and 20-weeks KPCC (80%) animals exhibited PDAC (Supplementary Figure 1B). We also noted early formation of PDAC (30 weeks) in C1galt1 knockout mice that have only the Kras mutations (KrasG12D/+; C1galt1loxP/loxP; Pdx1-Cre-KCC mice) in comparison to KC (KrasG12D/+; Pdx1-Cre) mice that develop tumors by 40–50 weeks (Supplementary Figure 1C).
Figure 1.
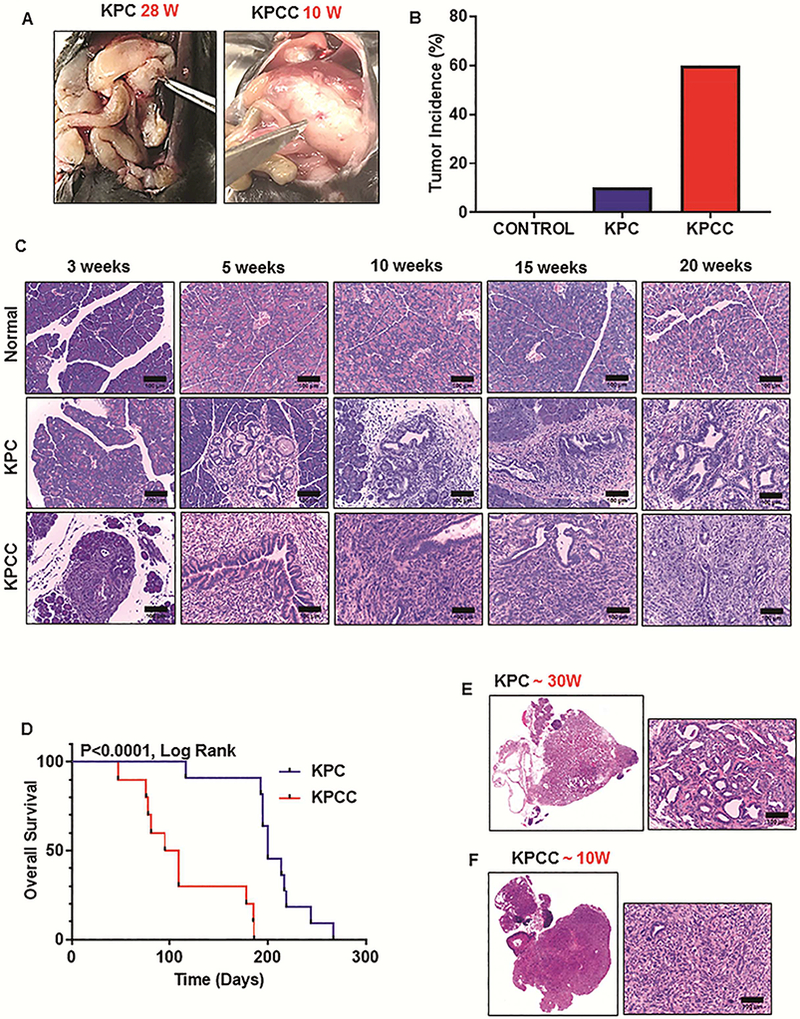
Genomic depletion of C1galt1 results in faster PDAC progression. (A) Gross appearance of pancreatic tumors in KPC (28 weeks) and KPCC (10 weeks) mice. (B) Percentage of tumor-bearing animals in control, KPC and KPCC cohort (n=20 for control, KPC, and KPCC mice; Age ≤ 20 weeks). (C) Representative histological pictures of the pancreas from age-matched control, KPC and KPCC mice at 3, 5, 10, 15, and 20 weeks. (n=5 for control, KPC, and KPCC mice; scale bars represent 100 μm). (D) Kaplan-Meier survival analysis for KPC and KPCC mice (n=11 for KPC and n=10 for KPCC, **p<0.0001 by Mantel-Cox (log rank) test). (E) Representative H and E stained picture of pancreatic tumor from 30-week old KPC mice. (F) Representative H and E stained picture of pancreatic tumor from 10-week old KPCC mice. (Whole slides containing pancreatic sections were scanned at TSF and Scale bars of enlarged pictures represent 100μm).
Because knockout of C1galt1 in the KPC background induced faster disease progression, we also evaluated the effect of C1galt1 knockout on overall survival. Previous studies reported that the median survival rate of KPC animals is around 22 weeks. 27 Survival studies were conducted to explore the effect of C1galt1 deficiency in the presence of KPC, and it was found that the median survival of KPC control littermates was indeed around 200 days (28.6 weeks). KPCC mice, however, were seen to have a dramatically shortened median survival of 102 days (14.6 weeks) (Figure 1D and Supplementary Table 1).
Histopathologic analysis of KPCC tumors revealed poorly differentiated or undifferentiated morphology (sarcomatoid histology, many gigantic cells, and atypical mitotic figures); however, a vast majority of KPC animals showed moderately-to-well-differentiated tumors (Figure 1E and F). Of note, the pancreas appeared normal when C1galt1 was conditionally inactivated (C1galt1loxP/loxP; Pdx-1-Cre) without the background of oncogenic mutations (Supplementary Figure 1D). This suggests that functional loss of C1galt1 is not sufficient to induce PanINs and PDAC. Nevertheless, loss of C1galt1 in conjunction with Kras and p53 mutations significantly accelerated disease progression and shortened overall survival.
C1galt1−/− Pancreatic Tumors Displayed Extensive Proliferation and Decreased Stroma
To evaluate the effect of C1galt1 knockout on tumor cell proliferation, we performed ki-67 staining in KPC and KPCC pancreatic tumors, and observed significant increase in ki-67 positive cells in KPCC tumors (10–20 weeks) as compared to KPC tumors (25–30 weeks) (Figure 2A, B). Increased ki-67 positivity was also observed in early stage (5 weeks) KPCC pancreas as compared to KPC pancreas (Supplementary Figure 2A and B). We further compared mitotic figures between KPC and KPCC tumors. KPCC tumors showed a significantly increased number of mitotic figures, as shown by Hematoxylin and Eosin (H and E) staining (Supplementary Figure 2C and D). We also observed increased presence of atypical mitotic figures in KPCC tumors. Of note, the increased presence of these mitotic figures and atypical nuclear structures marks aggressive malignancy and has been used for clinical grading of several tumor types 28.
Figure 2.

Increased aggressiveness of KPCC tumors compared to KPC tumors. (A) Representative histological pictures of ki-67 staining in KPC and KPCC pancreatic tumors (scale bars represent 50μm). (B) Quantification of ki-67 positive index in KPCC pancreatic tumors compared to KPC tumors (n=4 for KPC and KPCC mice; error bars represent mean ± s.e.m. *P<0.05; by Mann Whitney test). (C) Representative histologic pictures for alpha-SMA staining in KPC and KPCC pancreatic tumors (scale bars represent 50 μm). (D) Scatter dot plot showing alpha-SMA composite score in KPC versus KPCC pancreatic tumors (n=6 for KPC and KPCC mice; error bars represent mean ± s.e.m. *P<0.05; by unpaired two-sided Student’s t-test). (E) Representative immunofluorescence staining for alpha-SMA in KPC and KPCC pancreatic tumors (scale bars represent 100μm). (F) Mean fluorescent intensity of alpha-SMA staining in KPCC pancreatic tumors compared to KPC tumors (n=5 for KPC and KPCC mice; error bars represent mean ± s.e.m. **P<0.005; by Mann Whitney test). (G) Representative Sirius red-staining in KPC and KPCC pancreatic tumors (whole slides containing pancreatic sections scanned at TSF and scale bars represent 50μm). (H) Percentage of Sirius red-positive area in KPC tumors versus KPCC tumors (n=5 for KPC and KPCC mice, *P<0.05; by unpaired two-sided Student’s t-test).
We next sought to determine whether loss of C1galt1 has any effect on the desmoplastic reaction that is highly observed in PDAC tissue histology. 29 We first stained KPC and KPCC tumors for alpha-smooth muscle actin (α-SMA), widely used to identify cancer-associated fibroblasts in the stroma. KPCC tumors showed significantly decreased alpha-SMA expression compared to KPC tumors (these showed appreciable levels of alpha-SMA (Figure 2C-F). Next, to verify changes in the stroma, we analyzed collagen content using Picrosirius red (PSR) staining. Consistent with alpha-SMA staining, the percentage of area stained red was also significantly reduced in KPCC tumors compared to KPC tumors (Figure 2G and H). Though remarkable decrease in stroma was observed in full-blown KPCC tumors as compared to KPC tumors, such changes were not evident in the early PanIN stages of KPC and KPCC mice, suggesting that a decreased stromal compartment might be due to an excessive proliferation of tumor cells (Supplementary Figure 2E). Together, these results indicate that loss of C1galt1 leads to the formation of aggressive PDAC tumors, with a marked decrease in the stroma.
Truncated Glycophenotype of KPCC Pancreas
In light of the O-glycosyltransferase activity of C1GALT1, we investigated whether increased PDAC aggressiveness in KPCC tumors could be due to differential glycosylation following loss of C1galt1. The effect of C1galt1 knockout on glycosylation was assessed using Alcian blue and lectin staining. Alcian blue staining revealed a marked decrease of sulfated and/or sialylated (acidic) glycans in KPCC tissues compared to KPC tissues (Figure 3A and B). C1galt1 catalyzes the formation of the core-1/T carbohydrate antigen, and therefore we evaluated T carbohydrate antigen expression in KPC and KPCC tumors (pretreated with neuraminidase- Supplementary Figure 3) using lectin-histochemistry and immunofluorescence with T-binding lectin Peanut Agglutinin (PNA). As expected, the loss of C1galt1 in KPCC tumors led to loss of T carbohydrate antigen, compared to KPC tumors. This further confirmed the effective knockout of C1galt1 in KPCC mice (Figure 3C-F).
Figure 3.

Altered glycosylation in KPCC pancreatic tumors. (A) Representative histological pictures showing Alcian blue staining in KPC and KPCC pancreas (scale bars represent 100μm). (B) Alcian blue composite score in KPC vs KPCC pancreatic tissues at different time points (n=4–5 for KPC and KPCC mice *P<0.05; by Mann Whitney test). (C) Representative histological pictures showing T carbohydrate antigen expression in KPC and KPCC pancreatic tumors (scale bars represent 50μm). (D) PNA (T) composite score in KPC tumors vs KPCC tumors (n=6 for KPC and KPCC mice, error bars represent mean ± s.e.m. *P<0.05; by Mann Whitney test). (E) Representative fluorescent pictures showing T carbohydrate antigen staining in KPC and KPCC pancreatic tumors (scale bars represent 100μm). (F) Mean fluorescent intensity of T carbohydrate antigen in KPCC tumors compared to KPC pancreatic tumors (error bars represent mean ± s.e.m. *P<0.05; by Mann Whitney test). (G) Representative histologic pictures showing Tn carbohydrate antigen expression in KPC and KPCC pancreatic tumors. (scale bars represent 50μm). (H) VVA (Tn) composite score in KPC tumors vs KPCC tumors (n=6 for KPC and KPCC mice; error bars represent mean ± s.e.m. **P<0.005; by Mann Whitney test). (I) Representative fluorescent pictures showing Tn carbohydrate antigen staining in KPC and KPCC pancreatic tumors (scale bars represent 50μm). (J) Mean fluorescent intensity of Tn carbohydrate antigen in KPCC tumors compared to KPC tumors (n=6 for KPC and KPCC; error bars represent mean ± s.e.m. **P<0.005; by Mann Whitney test).
We next stained KPC and KPCC tumors with Vicia Villosa lectin (VVL/VVA), used to visualize the Tn carbohydrate antigen (Figure 3G-J). Increased expression of truncated Tn carbohydrate antigen is frequently observed in several malignancies and correlates with their increased aggressiveness. 22 Tumors of KPCC mice showed a significant increase in Tn carbohydrate antigen compared to KPC mice (Figure 3G-J). Together, these findings indicate that knockout of C1galt1 in PDAC results in increased expression of the truncated Tn carbohydrate antigen, and with loss of core-1 O-glycan and its associated structures.
Loss of C1galt1 in KPC Mice Leads to Increased Metastasis
We observed early metastatic lesions in KPCC mice (10 weeks) compared to KPC mice, which typically show late metastasis (Figure 4A). We did not observe any metastasis to distant organs in KPC mice until 20 weeks, but at 10 weeks, KPCC mice showed gross metastatic lesions on several organs, including peritoneum and stomach (Figure 4B). Given that epithelial to mesenchymal transition (EMT) is an initial step of metastasis, we also evaluated EMT markers in KPC and KPCC tumors to understand the mechanism underlying metastasis. We noticed increased expression of the mesenchymal markers Slug, Snail, and Vimentin, but epithelial markers such as E-cadherin and Claudin-1 were decreased (Figure 4C and D and Supplementary Figure 4). Immunofluorescence and Immunohistochemical staining in KPC and KPCC pancreatic tumors also showed a significantly higher expression of vimentin in KPCC tumors (Figure 4E-H). These results suggest increased metastasis in KPCC mice compared to KPC mice, which may in turn be explained by increased expression of mesenchymal markers in KPCC tumors compared to KPC tumors.
Figure 4.

Loss of C1galt1 resulted in enhanced metastasis. (A) Percentage of animals with metastasis in KPCC mice compared to KPC mice (n=15 for KPC and KPCC mice; age ≤ 15 weeks) (B) Representative H & E pictures showing metastatic lesions in peritoneum and stomach in KPCC mice (scale bars represent 200 μm). (C) qPCR analysis of epithelial markers-E cadherin and Claudin-1 in KPCC pancreatic tumor relative to KPC tumor (error bars represent mean ± s.e.m., **P<0.005; by unpaired two-sided Student’s t-test). (D) qPCR analysis of mesenchymal markers-Slug, Snail and Vimentin in KPCC pancreatic tumor relative to KPC tumor (error bars represent mean ± s.e.m. * P<0.05, **P<0.005; by unpaired two-sided Student’s t-test). (E) Representative immunofluorescent pictures showing vimentin staining in KPC and KPCC pancreatic tumors (scale bars represent 50 μm). (F) Mean fluorescent intensity of vimentin in KPCC pancreatic tumors compared to KPC tumors (n=6, error bars represent mean ± s.e.m. **P<0.005; by Mann Whitney test). (G) Representative immunohistochemical pictures showing vimentin staining in KPC and KPCC pancreatic tumors (scale bars represent 50 μm). (H) Vimentin composite score in KPCC pancreatic tumors compared to KPC (n=7 for KPC and KPCC mice; error bars represent mean ± s.e.m. **P<0.005; by Mann Whitney test).
Expressional Variation of C1GALT1 and Truncated O-Glycans in Human PDAC Tissues
To study the clinical relevance of C1GALT1 expression, we performed histochemical analysis of C1GALT1 in several PDAC samples collected via Whipple procedure. Well- and poorly differentiated regions of PDAC were scored independently for C1GALT1 expression. Trace-to-weak staining was observed in the majority of neoplastic ducts in well-differentiated PDAC tissues. Of interest, most poorly differentiated PDAC areas stained negative for C1GALT1 (Figure 5A and Supplementary Figure 5A). Our findings accord with earlier studies that also reported a loss of inactive T-synthase (via Cosmc hypermethylation) in some PDAC samples. 30
Figure 5.

Truncated glycophenotype with CRISPR/Cas9 knockout of C1GALT1 in human PDAC cells. (A) C1GALT1 composite score in well differentiated and poorly differentiated PDAC tissues. Representative immunohistochemical pictures showing C1GALT1 staining in welldifferentiated and poorly-differentiated PDAC (**P<0.005; by Mann Whitney test; scale bars represent 50 μm). (B) Composite score of Tn versus T carbohydrate antigens in PDAC tissues. Representative immunohistochemical pictures of Tn and T carbohydrate antigens in PDAC (**P<0.005; by Mann Whitney test; scale bars represent 50 μm). (C) Confirmation of C1GALT1 knockout in T3M4 PDAC cells (D) C1GALT1 enzyme activity was assayed by mixing cell lysates from wild-type and C1GALT1 knockout T3M4 cells with substrate GalNAcα-O-Benzyl in presence of UDP-Gal. Relative abundance of original substrate (top panel) and product (bottom panel) quantified based on area under curve of MS1 peak for corresponding molecule. All structures validated using MS/MS analysis. (E) Core 1 synthase enzyme activity in wild-type T3M4 cells (control) and three different knockouts (Clone 1–3). Absence of Galβ1,3GalNAcα-OBenzyl product in T3M4-KO clones indicated by asterisk. (F) Expression of Tn and sTn carbohydrate antigen in control versus C1GALT1 KO T3M4 clones. (G) Per-acetylated GalNAcα-O-Benzyl was fed to wild-type and C1GALT1 KO cells. Products collected from supernatant were assayed using LC-MS, with structure validation performed using MS/MS analysis and knowledge of biochemistry. All glycans depicted using Symbol Nomenclature for Glycans. Structures that could not be unequivocally identified are indicated using curly bracket symbols.
The C1GALT1 histochemical score was also significantly reduced in poorly differentiated PDAC samples compared to well-differentiated PDAC tissues (Figure 5A). These results suggest a differential expression of C1GALT1 in PDAC, where loss of C1GALT1 expression was observed in poorly differentiated PDAC. Interestingly, knockout of C1galt1 in pancreatic cancer mouse model also resulted in poorly differentiated PDAC tumors, suggesting a possible association of C1galt1 expression with PDAC differentiation.
We further examined the expression of Tn and T carbohydrate antigens in PDAC samples, using VVA and PNA lectins, respectively. We observed a significant increase in Tn carbohydrate antigen compared to T carbohydrate antigen in serial sections of human PDAC samples (Figure 5B and Supplementary Figure 5B). We also noted increased expression of Tn compared to T in mouse PDAC tissues (Supplementary Figure 5C). This suggests the relative abundance of Tn carbohydrate antigen in human and mouse PDAC tissues as compared to T carbohydrate antigen.
CRISPR/Cas9 KO of C1GALT1 in PDAC Cells Showed Increased Expression of Tn and sTn
To further explore the functional role of C1GALT1, knockout of C1GALT1 was carried out in authenticated PDAC cells (T3M4 and CD18/HPAF) using CRISPR/Cas9 genome editing. Complete knockout of C1GALT1 in CRISPR/Cas9 KO clones was observed compared to untransfected control cells (Figure 5C, Supplementary Figure 5D and 5F). Deletion of C1GALT1 in knockout cells was further confirmed by C1GALT1 enzymatic assay, using the GalNAcα-OBenzyl substrate (Figure 5D and E). The addition of galactose to this substrate (brought by C1GALT1 activity) was completely abolished in C1GALT1 KO clones compared to control T3M4 cells.
We next evaluated the O-linked glycosylation profile of C1GALT1 KO PDAC cells. Here, we observed increased expression of Tn and sTn in all C1GALT1 KO clones compared to wild-type control (Figure 5F and Supplementary Figure 5D). VVA fluorescein staining further confirmed increased expression of the Tn carbohydrate antigen (Supplementary Figure 5E). Comprehensive analysis of the effect of C1GALT1 knockout on O-glycan biosynthetic pathways was further performed using both Orbitrap and Fourier transform ion cyclotron resonance mass spectrometry (Figure 5G, Supplementary Figure 6). In this case, we looked for secretory Oglycans in the culture supernatants collected from control and KO clones. We observed that several O-glycan peaks were found in wild-type control cells, but KO cells completely lacked these peaks (Supplementary Figure 6).
Knockout of C1GALT1 Resulted in Increased Growth and Migration of PDAC Cells
Knockout of C1GALT1 resulted in significantly increased proliferation, as demonstrated by WST-1 proliferation assay (Figure 6A). Furthermore, knockout of C1GALT1 induced altered morphology with increased formation of cellular protrusions, including lamellipodia, filopodia, and microspikes, demonstrated by F-actin staining (Supplementary Figure 7A). The formation of these dynamic cytoskeletal structures directs cancer cell migration, and therefore, using migration assay, we examined the effect of C1GALT1 knockout on cancer cell migration, which showed a significant increase in cell motility of C1GALT1 KO PDAC cells (Figure 6B, Supplementary Figure 7B). Once this knockout of C1GALT1 was seen to result in increased migration, we next examined whether the expression of C1GALT1 is modulated in highly migratory PDAC cells. We developed an in vitro model of migration comprising less-to-more migratory PDAC sublines, and serial migration assay was conducted to develop highly migratory sublines (M1 to M5) of T3M4, BxPC-3 (M1 to M5), and Colo-357 (M1, M2) (Figure 6C, upper panel). Migration assay demonstrated increased migration of the M5 subline as compared to parental (P) cells (Figure 6C). Further, altered morphology (increased presence of cellular protrusions) was seen in highly migratory M5 subline as compared to parental cells (Figure 6C).
Figure 6.

C1GALT1 KO Induces Increased Metastasis, Tumorigenicity, and Aberrant MUC16 Glycosylation. (A) Quantification of growth using WST-1 assay in control and C1GALT1 knockout T3M4 PDAC clones (B) Quantification of wound closure in C1GALT1 KO T3M4 PDAC clones compared to control cells (Data represents mean ± SD of three replicates; *P<0.05, **P<0.005 by unpaired two-sided Student’s t-test). (C) Upper panel: Schematic representation of development of migratory sublines using Boyden Chamber Assay. Series of migration assays with progressive decrease in incubation time lead to development of highly migratory M4 and M5 sublines. Representative picture from migration assay demonstrating high migration of M5 migratory subline compared to parental cells. Actin staining further demonstrates altered morphology of M5 migratory subline compared to parental cells. Expression of C1GALT1 in highly migratory M5 subline as compared to parental T3M4 cells. (D) Comparison of tumor weights between orthotopically implanted T3M4 control and C1GALT1 KO clone 2 tumor models (Error bars represent mean ± s.e.m *P<0.05 by Mann Whitney test). (E) Bar diagram showing percentage of animals with metastasis to several organs in orthotopically implanted T3M4 control and C1GALT1 KO clone 2 tumor models. (F) Expression of MUC16 in control and C1GALT1 KO T3M4 PDAC cells. (G) Expression of MUC16 in KPC and KPCC PDAC lysates. (H) Expression of MUC16 in pancreatic tumor from control and C1GALT1 KO xenograft models. (Shift in MUC16 molecular weight is depicted by arrows) (I) Upper panel: Lectin blotting demonstrates effective pull-down of Tn carbohydrate antigen in control and C1GALT1 KO T3M4 cells by VVA pulldown assay. Lower panel: Immunoblotting of VVA pulled down control and C1GALT1 KO lysates with MUC16 demonstrates significant increase of Tn associated with MUC16 in C1GALT1 KO PDAC cells
Expression of C1GALT1 was then examined in the parental and the migratory sublines derived from T3M4, BxPC-3, and Colo-357, using Western blotting. Expression of C1GALT1 was found to be decreased in the highly migratory M5 subline as compared to parental cells in the T3M4 migratory model (Figure 6 C and Supplementary Figure 7C). C1GALT1 expression was also decreased in the highly migratory Colo-357 (Colo-M1 and M2) and BxPC-3 cells (BxPC3-M4 and M5) compared to parental cells (Supplementary Figure 7D). These findings further suggest that loss of C1GALT1 expression is associated with increased migration.
C1GALT1 KO Cells Showed Increased Tumorigenicity and Metastasis
We next sought to assess the impact of C1GALT1 knockout on tumor growth and metastasis using a xenograft model, wherein wild-type control and C1GALT1 KO PDAC cells were implanted in the pancreas of athymic nude mice. Three independent orthotopic implantation studies were performed to explore the involvement of C1GALT1 KO clones on tumorigenicity and metastasis. Our first study used GFP- and luciferase-labeled wild-type and C1GALT1 KO clone-2 T3M4 PDAC cells. Orthotopic results revealed a significant increase in tumor weight and increased metastasis to distant organs, including liver, lung, and diaphragm (Figure 6D and E). To further validate our findings, we used wild-type and C1GALT1 KO clone-3 T3M4 PDAC cells. Orthotopic studies using this clone also demonstrated significant increases in tumor weight and increased metastasis (Supplementary Figure 8A and B). Apart from T3M4 C1GALT1 knockout clones, orthotopic studies with CD18/HPAF C1GALT1 knockout clone-1 also resulted in increased tumor weight and metastasis as compared to control cells. (Supplementary Figure 8C and D). Taken together, in vivo orthotopic studies using wild-type and C1GALT1 KO clones indicate that KO of C1GALT1 contributes to the increased tumorigenicity and metastasis of PDAC cells.
To delineate the molecular mediators that confer increased PDAC aggressiveness in C1GALT1 KO PDAC cells, we examined the expression of MUC16. Our reasoning was primarily based on the intriguing fact that MUC16 is a membrane-bound and highly glycosylated mucin that originates de novo in PDAC, one that is also implicated in PDAC tumorigenicity and metastasis. 31–34 We observed a remarkable shift in the molecular weight of MUC16 (Figure 6F and Supplementary Figure 10B), and the MUC16 band was seen at a lower molecular weight position in C1GALT1 KO T3M4 cells compared to wild-type cells. Interestingly, we also observe a molecular shift in the MUC16 band in lysates collected from C1galt1 knockout mouse model (KPCC) and C1galt1 knockout orthotopic model (Figure 6G and H). Since glycosylation also contributes to the molecular weight of protein, we investigated whether the observed decrease in molecular weight of MUC16 was due to loss of extended O-glycan structures on MUC16. Given that C1GALT1 deficiency leads to the loss of extended O-glycan structures, with a subsequent increase of truncated glycan structures such as Tn and sTn, the presence of Tn glycan on MUC16 was determined using VVA (binds Tn) pull-down assay. Lectin pull-down assay using T3M4 wild-type and C1GALT1 KO lysates showed increased expression of Tn on MUC16 in C1GALT1 KO lysates, compared to wild-type cells (Figure 6/). These results suggest that loss of C1GALT1 leads to altered glycosylation on MUC16, with an increased expression of Tn carbohydrate antigen. We also examined glycosylation variation on MUC4, which is an another heavily glycosylated mucin implicated in PDAC progression and metastasis. However, we did not observe any molecular shifts in the MUC4 band. We could not see expression of truncated Tn glycan on MUC4 in both control and C1galt1 knockout T3M4 cells. This suggests the possibility of the existence of other core carbohydrate structures on MUC4 rather than core- 1 O-glycan structures (Supplementary Figure 9A)
We further tested glycosylation alterations on MUC16 in C1GALT1 KO PDAC cells, employing an enzymatic approach wherein we used glycosidases including PNGase-F and α−2,3,6,8 neuraminidase (Supplementary Figure 9B). PNGase-F specifically excises N-glycans, whereas α−2,3,6,8 neuraminidase catalyzes removal of all terminal and branched sialic acid residues. Lysates from wild-type and KO cells were treated with these enzymes and probed with MUC16. PNGase-F treatment in wild-type and C1GALT1 KO lysates were seen to cause molecular shifts in bands that corresponded to N-glycosylated MUC16. Similar shifts were seen in wild-type and C1GALT1 KO lysates, suggesting that KO of C1GALT1 did not alter Nglycosylation of MUC16. On the other hand, treatment with neuraminidase resulted in increased intensity of the MUC16 band in both wild-type and C1GALT1 KO lysates (Supplementary Figure 9B). This may have been due to increased exposure of epitopes after the release of the sialic acid residues that caused increased binding of the MUC16 antibody (raised against the tandem repeat region of MUC16 that represents most of the O-glycosylated region). If this is the case, increased intensity regions would represent a sialylated region of MUC16. Increase in intensity was observed at a lower position in C1GALT1 KO lysates compared to wild-type lysates. This further suggests that the shift in molecular weight of MUC16 is caused by a truncation of MUC16 O-glycosylation.
Differential Upregulation of Tumorigenic and Metastatic Pathways in C1GALT1 KO PDAC Cells
To identify how altered O-glycosylation affects tumor growth and metastasis, RNA-Seq analysis was conducted on control and C1GALT1 KO T3M4 cells. RNA-Seq results revealed differential upregulation of several genes, including RAB3Il1, GALNT1, GALNT9, ABCG2, TWIST2, B4GALNT1A, WNT7A, MGLL, B4GALNT4, GATA4, CD44, RHOU, WNT10B, and CDH11 in C1GALT1 KO T3M4 cells, compared with wild-type (Figure 7A). Ingenuity Pathway analysis associated some of these genes with tumor growth and migration (Figure 7B and Supplementary Figure 10A).
Figure 7.

Upregulation of migratory and tumorigenic genes in C1GALT1 KO PDAC cells. (A) Volcano plot demonstrating significant upregulation of aggressive genes in C1GALT1 KO PDAC cells. (B) Ingenuity Pathway analysis using these upregulated genes indicated their involvement in cancer cell migration and tumorigenicity. (C) Western blotting demonstrating expression of growth receptors, signaling proteins and EMT markers in control versus C1GALT1 knockout T3M4 cells. (D) Western blot showing expression of EMT markers (Vimentin, Slug, Snail, Claudin1) in KPC and KPCC PDAC lysates (E) Western blot demonstrating transient knockdown of Vimentin in C1GALT1 KO (clone 2) T3M4 cells. (F) Effect of vimentin knockdown on migration in control and C1GALT1 KO (clone-2) T3M4 cells (Error bars represent mean ± s.e.m *P<0.05 by unpaired two-sided Student’s t-test). (G) Pictorial representation summarizing the impact of C1galt1 knockout in PDAC progression and metastasis. Disruption of C1galt1 gene along with Kras and p53 mutations (KPCC mice) lead to early onset of PDAC and highly aggressive PDAC as compared to KPC mice. Mechanistic insights were gained by C1GALT1 knockout human PDAC cells, which showed truncation of MUC16 O-glycosylation that might facilitate its interaction with growth receptors such as EGFR or signaling proteins such as integrins resulting in activation of downstream signaling molecules (Pfak and pAkt) and increased cancer growth and metastasis.
Using Western blotting, we further observed increased activation of the oncogenic and migratory signaling pathways (as predicted by RNA-seq). We observed increased phosphorylation forms of ErbB signaling proteins, including EGFR and Her2, in knockout clones compared to wild-type cells. However, the total levels of these signaling proteins remained unchanged (Figure 7C and Supplementary Figure 10B). We also observed increased expression of α−4 integrin in C1GALT1 KO clones. All of these signaling proteins have been shown to play an important role in PDAC growth and metastasis. 35 Beyond this, we also observed increased activation of the signaling proteins Akt (the downstream effector of ErbB signaling) and FAK-Y925 (downstream effectors of integrin signaling) (Figure 7C), which has been associated with altered expression of EMT markers. 36, 37 Distinctly increased expression of the mesenchymal marker vimentin was seen in C1GALT1 KO PDAC cells, whereas expression of the epithelial marker E-cadherin and ZO-1 was decreased in C1GALT1 KO PDAC cells (Figure 7C and Supplementary Figure 10B). In addition to the altered expression of EMT markers in C1GALT1 knockout human PDAC cells, we also observed differential expression of EMT markers in KPCC PDAC lysates as compared to KPC lysates (Figure 7D).
Further, transient knockdown of vimentin in C1GALT1 KO PDAC cells resulted in a significant decrease of migration, suggesting that upregulated vimentin expression is the prevalent mechanism of migration in C1GALT1 KO cells (Figure 7E and F).
Discussion
Altered glycosylation is often linked to cancer hallmarks within several malignancies. 38, 39 Studies elucidating the presence of truncated O-glycan structures in pancreatic cancer were described twenty-eight years ago. However, there is very little understanding of the role of these truncated O-glycans in PDAC progression. Our study provides compelling evidence that aberrant expression of truncated O-glycans induces early metastasis and potentiates PDAC aggressiveness.
These truncated O-glycans are also widely recognized as tumor-associated carbohydrate antigens (TACAs), owing to their elevated expression under tumor conditions. 40, 41 Prior studies focusing on pancreatic cancer glycobiology have shown differential expression of several TACAs, including Tn and sTn, in intraductal papillary-mucinous neoplasm, chronic pancreatitis, and pancreatic cancer tissues. 9,10 Deregulated expression of Oglycosyltransferase, C1GALT1, is one of the mechanisms that leads to increased expression of truncated O-glycans. C1GALT1 requires a molecular chaperone, Cosmc, for its enzymatic activity. 42, 43 Loss of Cosmc in mice resulted in loss of T-synthase activity, and it increased Tn expression and caused embryonic lethality.16 Further, targeted deletion of Cosmc in endothelial cells resulted in hemorrhage, suggesting the critical role of core-1 O-glycans in platelet function. 14 A recent study by Radhakrishnan et al. reported that Cosmc is hypermethylated in PDAC and is associated with inactive T-synthase. 30 Furthermore, the knockdown of Cosmc in PDAC cells resulted in increased expression of truncated O-glycans and increased aggressiveness. 30, 44 Although these studies reveal an important role of Cosmc in PDAC, the possibility that Cosmc knockdown has other biological effects cannot be excluded. Another critical aspect of the problem that remained unexplored in these studies is the impact of aberrant O-glycosylation on PDAC progression and metastasis.
Our study is a first attempt to demonstrate the role of aberrant O-glycosylation in PDAC progression, using a C1galt1 knockout mouse model with truncated O-glycans. Prior studies by Xia et al. have demonstrated that mice with targeted deletion of C1galt1 in intestinal epithelial cells spontaneously develop colitis. This was explained by a defective mucus barrier caused by truncation of O-glycosylation. Because the loss of C1GALT1 is associated with augmented expression of truncated O-glycans, we developed the KPCC model with pancreas-specific C1galt1 depletion, along with Kras and p53 mutations. We found that loss of C1galt1 cooperates with Kras and p53 mutations and results in faster PDAC progression. Low grade PanIN lesions were noticed in 3 weeks of KPCC mice. This finding is quite intriguing, as this early PanIN lesion development has not been observed with KPC mice, wherein low-grade PanIN lesions were noticed around 5 weeks. Our findings are in line with a previous study, wherein knockout of TGF-β along with Kras mutation resulted in early PanIN lesions (around 3.5 weeks). 45 It was striking that overall survival was significantly reduced in KPCC mice compared to KPC mice, highlighting the critical role of aberrant O-glycosylation in PDAC progression.
We observed that full-blown KPCC tumors diminish fibrosis compared to KPC tumors. This finding is in agreement with a previous study by Rhim et al. that demonstrated increased aggressiveness of PDAC with less stroma. 46 Decreased stroma in full-blown tumors might reflect an increased proliferation rate of tumor cells compared to stromal cells; this was shown by increased ki-67 positivity and increased mitotic figures in KPCC tumors. There was also a marked increase in truncated Tn glycan in KPCC tumors compared to KPC tumors, highlighting the critical involvement of truncated O-glycans in aggressive PDAC. Furthermore, increased expression of truncated O-glycans has been shown to facilitate disease progression and metastasis by interacting with lectins. 47
KPCC tumors showed an interesting early metastasis at 10 weeks, compared to KPC tumors that develop late metastasis around 28 weeks. KPCC is the first PDAC mouse model to show very early metastasis, compared to other PDAC animal models developed so far. 4, 5 Based on the mesenchymal morphology observed in KPCC tumor histology, we compared the expression of EMT markers in KPC and KPCC tumors. Mesenchymal markers showed significant elevation in KPCC tumors, whereas epithelial markers showed decreased expression. In particular, a remarkable increase in vimentin expression was observed, which might explain early metastasis observed in KPCC animals.
The mechanistic role of MUC16 in PDAC growth and metastasis has been well described. 31–34 CRISPR/Cas9 knockout of C1GALT1 further delineated the molecular mechanism by which loss of C1GALT1 induces PDAC aggressiveness. Similar to the KPCC animal model, we observed that knockout of C1GALT1 induced aberrant O-glycosylation and increased tumorigenesis and metastasis in human PDAC cells. Tn was remarkably increased on the MUC16 mucin in C1GALT1 knockout PDAC cells. Truncation of MUC16 glycosylation might also facilitate its increased interaction with lectins or other signaling proteins. MUC16 is a high molecular weight glycoprotein that originates de novo in PDAC, and its expression increases progressively in PDAC. 32 Global transcriptome analysis further identified upregulation of MUC16-associated signaling proteins and pathways.
We further found increased activation of growth-factor receptors such as EGFR and Her2 and their downstream effectors like FAK and Akt proteins, which have been shown to play an important role in increased PDAC tumorigenicity and metastasis. Previous studies from our group indicate that MUC16 interacts with FAK and activates metastatic signaling. 34 Activated FAK and Akt signaling induces the migration of PDAC cells, which might explain increased migration of C1GALT1 knockout cells and increased expression of vimentin. These results suggest that loss of C1GALT1 in PDAC drives increased PDAC tumorigenesis and metastasis, possibly via aberrant glycosylation on MUC16 and activation of MUC16-associated signaling pathways (Figure 7G).
Taken together, the results of our study have elucidated that pancreas-specific conditional knockout of C1galt1 induces expression of truncated O-glycans, which in turn accelerates PDAC progression and metastasis. In future, clinical identification of the truncated O-glycan signature alone or in combination with other biomarkers could predict PDAC aggressiveness and metastasis.
Supplementary Material
Acknowledgments
We would like to thank Gino Stolfa for designing C1GALT1 CRISPR/Cas9 construct. We thank UNMC tissue sciences facility for processing mouse tissues used in our study. We thank Janice A. Taylor and James R. Talaska of the Advanced Microscopy Core Facility at the University of Nebraska Medical Center for providing assistance with confocal microscopy. We thank UNMC flow cytometry facility for sorting of CRISPR/Cas9 C1GALT1 knockout cells. We also thank Mrs. Kavita Mallya, for her invaluable technical support.
Funding
This work was supported, in parts, by the National Institutes of Health (P01 CA217798, R01 CA183459, RO1 CA195586, UO1 CA200466, UO1 CA210240 and P50 CA1272970) to S.K. Batra, (R01 CA210637) to Μ P. Ponnusamy and S.K. Batra, (R01 HL103411) to S. Neelamegham, (RO1 DK085691 and P30 GM114731) to L. Xia, and UNMC Graduate Studies Fellowship to S. Chugh.
Writing Assilesions were observed as early stance: We thank Dr. Adrian E. Koesters, Research Editor at UNMC, for her editorial contribution to the manuscript. (Supported by UNMC).
Footnotes
Conflict of Interest Statement: The authors declare no conflict of interest.
Data Resources: RNA sequencing data-GSE104607.
Publisher's Disclaimer: This is a PDF file of an unedited manuscript that has been accepted for publication. As a service to our customers we are providing this early version of the manuscript. The manuscript will undergo copyediting, typesetting, and review of the resulting proof before it is published in its final citable form. Please note that during the production process errors may be discovered which could affect the content, and all legal disclaimers that apply to the journal pertain.
REFERENCES
- 1.Rahib L, Smith BD, Aizenberg R, et al. Projecting cancer incidence and deaths to 2030: the unexpected burden of thyroid, liver, and pancreas cancers in the United States. Cancer Res 2014;74:2913–21. [DOI] [PubMed] [Google Scholar]
- 2.Siegel RL, Miller KD, Jemal A. Cancer Statistics, 2017. CA Cancer J Clin 2017;67:7–30. [DOI] [PubMed] [Google Scholar]
- 3.Borazanci E, Dang CV, Robey RW, et al. Pancreatic Cancer: “A Riddle Wrapped in a Mystery inside an Enigma”. Clin Cancer Res 2017;23:1629–1637. [DOI] [PubMed] [Google Scholar]
- 4.Leach SD. Mouse models of pancreatic cancer: the fur is finally flying. Cancer Cell 2004;5:7–11. [DOI] [PubMed] [Google Scholar]
- 5.Mazur PK, Siveke JT. Genetically engineered mouse models of pancreatic cancer: unravelling tumour biology and progressing translational oncology. Gut 2012;61:1488–500. [DOI] [PubMed] [Google Scholar]
- 6.Ying H, Dey P, Yao W, et al. Genetics and biology of pancreatic ductal adenocarcinoma. Genes Dev 2016;30:355–85. [DOI] [PMC free article] [PubMed] [Google Scholar]
- 7.Dey P, Rachagani S, Vaz AP, et al. PD2/Paf1 depletion in pancreatic acinar cells promotes acinar-to-ductal metaplasia. Oncotarget 2014;5:4480–91. [DOI] [PMC free article] [PubMed] [Google Scholar]
- 8.Hezel AF, Kimmelman AC, Stanger BZ, et al. Genetics and biology of pancreatic ductal adenocarcinoma. Genes Dev 2006;20:1218–49. [DOI] [PubMed] [Google Scholar]
- 9.Itzkowitz S, Kjeldsen T, Friera A, et al. Expression of Tn, sialosyl Tn, and T antigens in human pancreas. Gastroenterology 1991;100:1691–700. [DOI] [PubMed] [Google Scholar]
- 10.Terada T, Nakanuma Y. Expression of mucin carbohydrate antigens (T, Tn and sialyl Tn) and MUC-1 gene product in intraductal papillary-mucinous neoplasm of the pancreas. Am J Clin Pathol 1996;105:613–20. [DOI] [PubMed] [Google Scholar]
- 11.Remmers N, Anderson JM, Linde EM, et al. Aberrant expression of mucin core proteins and o-linked glycans associated with progression of pancreatic cancer. Clin Cancer Res 2013;19:1981–93. [DOI] [PMC free article] [PubMed] [Google Scholar]
- 12.Chugh S, Meza J, Sheinin YM, et al. Loss of N-acetylgalactosaminyltransferase 3 in poorly differentiated pancreatic cancer: augmented aggressiveness and aberrant ErbB family glycosylation. Br J Cancer 2016;114:1376–86. [DOI] [PMC free article] [PubMed] [Google Scholar]
- 13.Fu J, Wei B, Wen T, et al. Loss of intestinal core 1-derived O-glycans causes spontaneous colitis in mice. J Clin Invest 2011;121:1657–66. [DOI] [PMC free article] [PubMed] [Google Scholar]
- 14.Fu J, Gerhardt H, McDaniel JM, et al. Endothelial cell O-glycan deficiency causes blood/lymphatic misconnections and consequent fatty liver disease in mice. J Clin Invest 2008;118:3725–37. [DOI] [PMC free article] [PubMed] [Google Scholar]
- 15.Lobo NA, Shimono Y, Qian D, et al. The biology of cancer stem cells. Annu Rev Cell Dev Biol 2007;23:675–99. [DOI] [PubMed] [Google Scholar]
- 16.Xia L, Ju T, Westmuckett A, et al. Defective angiogenesis and fatal embryonic hemorrhage in mice lacking core 1-derived O-glycans. J Cell Biol 2004;164:451–9. [DOI] [PMC free article] [PubMed] [Google Scholar]
- 17.Brockhausen I Pathways of O-glycan biosynthesis in cancer cells. Biochim Biophys Acta 1999;1473:67–95. [DOI] [PubMed] [Google Scholar]
- 18.Julien S, Videira PA, Delannoy P. Sialyl-tn in cancer: (how) did we miss the target? Biomolecules 2012;2:435–66. [DOI] [PMC free article] [PubMed] [Google Scholar]
- 19.Hakomori S Glycosylation defining cancer malignancy: new wine in an old bottle. Proc Natl Acad Sci U S A 2002;99:10231–3. [DOI] [PMC free article] [PubMed] [Google Scholar]
- 20.Dube DH, Bertozzi CR. Glycans in cancer and inflammation--potential for therapeutics and diagnostics. Nat Rev Drug Discov 2005;4:477–88. [DOI] [PubMed] [Google Scholar]
- 21.Rini J, Esko J, Varki A. Glycosyltransferases and Glycan-processing Enzymes In: Varki A, Cummings RD, Esko JD, Freeze HH, Stanley P, Bertozzi CR, Hart GW, Etzler ME, eds. Essentials of Glycobiology. 2nd ed. Cold Spring Harbor (NY), 2009. [PubMed] [Google Scholar]
- 22.Ju T, Otto VI, Cummings Rd. The Tn antigen-structural simplicity and biological complexity. Angew Chem Int Ed Engl 2011;50:1770–91. [DOI] [PMC free article] [PubMed] [Google Scholar]
- 23.Ju T, Brewer K, D’Souza A, et al. Cloning and expression of human core 1 beta1,3- galactosyltransferase. J Biol Chem 2002;277:178–86. [DOI] [PubMed] [Google Scholar]
- 24.Ju T, Cummings RD. Protein glycosylation: chaperone mutation in Tn syndrome. Nature 2005;437:1252. [DOI] [PubMed] [Google Scholar]
- 25.Bergstrom K, Liu X, Zhao Y, et al. Defective Intestinal Mucin-Type O-Glycosylation Causes Spontaneous Colitis-Associated Cancer in Mice. Gastroenterology 2016;151:152–164.e11. [DOI] [PMC free article] [PubMed] [Google Scholar]
- 26.Xia L, McEver RP. Targeted disruption of the gene encoding core 1 beta1–3- galactosyltransferase (T-synthase) causes embryonic lethality and defective angiogenesis in mice. Methods Enzymol 2006;416:314–31. [DOI] [PubMed] [Google Scholar]
- 27.Hingorani SR, Wang L, Multani aS, et al. Trp53R172H and KrasG12D cooperate to promote chromosomal instability and widely metastatic pancreatic ductal adenocarcinoma in mice. Cancer Cell 2005;7:469–83. [DOI] [PubMed] [Google Scholar]
- 28.Hruban RH, Fukushima N. Pancreatic adenocarcinoma: update on the surgical pathology of carcinomas of ductal origin and PanINs. Mod Pathol 2007;20 Suppl 1:S61–70. [DOI] [PubMed] [Google Scholar]
- 29.Laklai H, Miroshnikova YA, Pickup MW, et al. Genotype tunes pancreatic ductal adenocarcinoma tissue tension to induce matricellular fibrosis and tumor progression. Nat Med 2016;22:497–505. [DOI] [PMC free article] [PubMed] [Google Scholar]
- 30.Radhakrishnan P, Dabelsteen S, Madsen FB, et al. Immature truncated Oglycophenotype of cancer directly induces oncogenic features. Proc Natl Acad Sci U S A 2014;111:E4066–75. [DOI] [PMC free article] [PubMed] [Google Scholar]
- 31.Das S, Rachagani S, Torres-Gonzalez MP, et al. Carboxyl-terminal domain of MUC16 imparts tumorigenic and metastatic functions through nuclear translocation of JAK2 to pancreatic cancer cells. Oncotarget 2015;6:5772–87. [DOI] [PMC free article] [PubMed] [Google Scholar]
- 32.Haridas D, Chakraborty S, Ponnusamy MP, et al. Pathobiological implications of MUC16 expression in pancreatic cancer. PLoS One 2011;6:e26839. [DOI] [PMC free article] [PubMed] [Google Scholar]
- 33.Haridas D, Ponnusamy MP, Chugh S, et al. MUC16: molecular analysis and its functional implications in benign and malignant conditions. FASEB J 2014;28:4183–99. [DOI] [PubMed] [Google Scholar]
- 34.Muniyan S, Haridas D, Chugh S, et al. MUC16 contributes to the metastasis of pancreatic ductal adenocarcinoma through focal adhesion mediated signaling mechanism. Genes Cancer 2016;7:110–24. [DOI] [PMC free article] [PubMed] [Google Scholar]
- 35.Rhim AD, Stanger BZ. Molecular biology of pancreatic ductal adenocarcinoma progression: aberrant activation of developmental pathways. Prog Mol Biol Transl Sci 2010;97:41–78. [DOI] [PMC free article] [PubMed] [Google Scholar]
- 36.Xue G, Hemmings BA. PKB/Akt-dependent regulation of cell motility. J Natl Cancer Inst 2013;105:393–404. [DOI] [PubMed] [Google Scholar]
- 37.McLean GW, Carragher NO, Avizienyte E, et al. The role of focal-adhesion kinase in cancer - a new therapeutic opportunity. Nat Rev Cancer 2005;5:505–15. [DOI] [PubMed] [Google Scholar]
- 38.Munkley J, Elliott DJ. Hallmarks of glycosylation in cancer. Oncotarget 2016;7:35478–89. [DOI] [PMC free article] [PubMed] [Google Scholar]
- 39.Chugh S, Gnanapragassam VS, Jain M, et al. Pathobiological implications of mucin glycans in cancer: Sweet poison and novel targets. Biochim Biophys Acta 2015;1856:211–25. [DOI] [PMC free article] [PubMed] [Google Scholar]
- 40.Hakomori S Aberrant glycosylation in tumors and tumor-associated carbohydrate antigens. Adv Cancer Res 1989;52:257–331. [DOI] [PubMed] [Google Scholar]
- 41.Xu Y, Sette A, Sidney J, et al. Tumor-associated carbohydrate antigens: a possible avenue for cancer prevention. Immunol Cell Biol 2005;83:440–8. [DOI] [PubMed] [Google Scholar]
- 42.Aryal RP, Ju T, Cummings RD. The endoplasmic reticulum chaperone Cosmc directly promotes in vitro folding of T-synthase. J Biol Chem 2010;285:2456–62. [DOI] [PMC free article] [PubMed] [Google Scholar]
- 43.Ju T, Lanneau GS, Gautam T, et al. Human tumor antigens Tn and sialyl Tn arise from mutations in Cosmc. Cancer Res 2008;68:1636–46. [DOI] [PubMed] [Google Scholar]
- 44.Hofmann BT, Schluter L, Lange P, et al. COSMC knockdown mediated aberrant O-glycosylation promotes oncogenic properties in pancreatic cancer. Mol Cancer 2015;14:109. [DOI] [PMC free article] [PubMed] [Google Scholar]
- 45.Ijichi H, Chytil A, Gorska AE, et al. Aggressive pancreatic ductal adenocarcinoma in mice caused by pancreas-specific blockade of transforming growth factor-beta signaling in cooperation with active Kras expression. Genes Dev 2006;20:3147–60. [DOI] [PMC free article] [PubMed] [Google Scholar]
- 46.Rhim AD, Oberstein PE, Thomas DH, et al. Stromal elements act to restrain, rather than support, pancreatic ductal adenocarcinoma. Cancer Cell 2014;25:735–47. [DOI] [PMC free article] [PubMed] [Google Scholar]
- 47.Pinho SS, Reis CA. Glycosylation in cancer: mechanisms and clinical implications. Nat Rev Cancer 2015;15:540–55. [DOI] [PubMed] [Google Scholar]
Associated Data
This section collects any data citations, data availability statements, or supplementary materials included in this article.