Abstract
Quantitative detection of RNA is important in molecular biology and clinical diagnostics. Nucleic acid sequence-based amplification (NASBA), a single-step method to amplify single-stranded RNA, is attractive for use in point-of-care (POC) diagnostics because it is an isothermal technique that is as sensitive as RT-PCR with a shorter reaction time. However, NASBA is limited in its ability to provide accurate quantitative information, such as viral load or RNA copy number. Here we test a digital format of NASBA (dNASBA) using a self-digitization (SD) chip platform, and apply it to quantifying HIV-1 RNA. We demonstrate that dNASBA is more sensitive and accurate than the real-time quantitative NASBA, and can be used to quantify HIV-1 RNA in plasma samples. Digital NASBA is thus a promising POC diagnostics tool for use in resource-limited settings.
Graphical Abstract
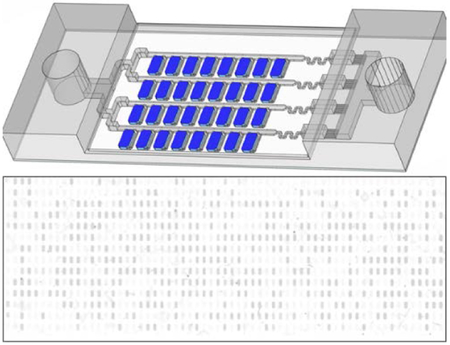
Sensitive and accurate quantification of HIV RNA could be achieved using digital NASBA in an SD-chip
Introduction
RNA detection is important in molecular biology, disease therapy, and clinical diagnostics.1, 2 RNA quantitation provides information about transcriptional levels or viral loads that is useful in disease diagnosis.3–5 Simple and sensitive methods for quantifying RNA are urgently needed for use in point-of-care (POC) settings. The gold standard for RNA quantitation is reverse transcription polymerase chain reaction (RT-PCR), due to its sensitivity, specificity, and dynamic range.6–8 However RT-PCR is unsuitable for POC diagnostics because it requires accurate temperature control and extensive equipment and infrastructure.9
Nucleic acid sequence-based amplification (NASBA) is a single-step alternative to PCR for amplifying single-stranded RNA.10 NASBA is an isothermal technique (reaction at 41°C) which allows 109-fold RNA amplification in 1–2 hours.11–13 NASBA is not prone to interference by DNA, as duplex DNA is not separated at 41°C, and is as sensitive as RT-PCR with a shorter reaction time.9, 12, 14–15 These properties make NASBA suitable for use in POC diagnostics.16–22
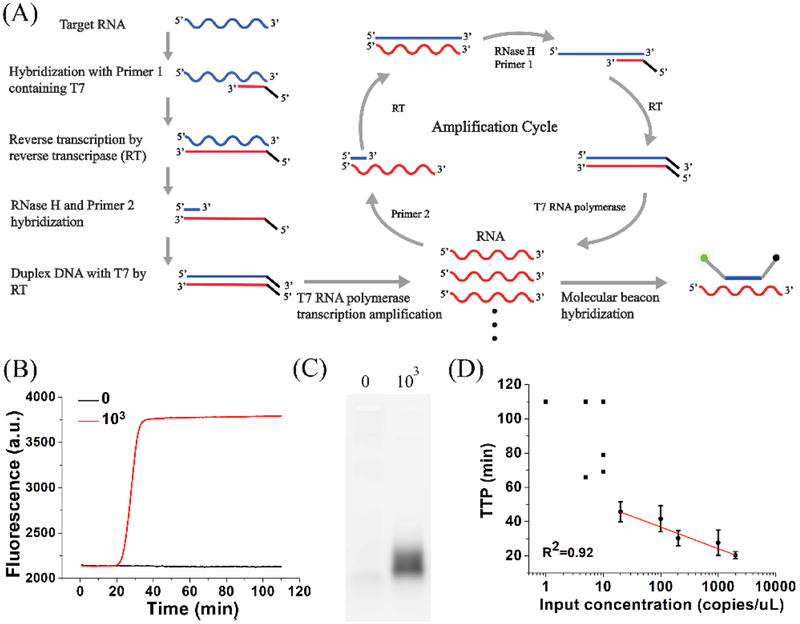
The NASBA reaction (Figure 1A) mimics the in vivo retroviral replication of RNA amplicons, and involves three enzymes (reverse transcriptase, RNase H, and T7 RNA polymerase) and two primers (one of which contains a T7 promoter region).10 Real-time quantitative NASBA (qNASBA) is achieved by using a fluorescent beacon whose fluorescence emission increases when the probe hybridizes with target RNA.23–24 Like qPCR, quantitation involves comparing the time to positivity (TTP, the time required for fluorescence intensity to reach a certain threshold) to that of a standard, to estimate the amount of nucleic acid template in a sample. qNASBA is a relative quantification method, and requires an independent measurement of the concentration of the standard (e.g. by using UV-Vis absorbance). Furthermore, qNASBA assumes equal amplification efficiency in all standards and samples, though sample impurities can affect amplification kinetics. These factors can cause variability in qNASBA results.25–26
Figure 1. NASBA.
(A) Schematic of RNA amplification in NASBA and generation of fluorescence. (B) qNASBA curves for reactions at HIV-1 RNA concentrations of 0 (black) and 1000 (red) copies/μL. (C) Electrophoresis of samples described in (B). (D) Plot of the time to positivity (TTP, the time required for fluorescence intensity to pass a threshold) versus input HIV-1 RNA concentration. The black square represents the TTP in each qNASBA. The black circle represents the average TTP in indicated concentration of HIV-1 RNA. At low HIV-1 RNA concentrations (≤10 copies/μL), TTP values varied widely and qNASBA could not accurately quantify RNA concentration. At higher concentrations (≥20 copies/μL), TTP showed a strong correlation with input concentration (R2 = 0.92). Error bars indicate standard deviation (n=3).
To address these shortcomings, we tested a digital format of NASBA (digital NASBA, or dNASBA) using a self-digitization (SD) chip developed previously by our group27–30 and modified in this study. The SD chip is a microfluidic device that partitions the sample into thousands of separate reaction chambers so that not all chambers contain RNA. Only chambers that initially contain one or more RNA molecules give a positive signal following the reaction. By counting the number of positive chambers, the number of RNA molecules in the original sample is calculated based on Poisson statistics. Digital NASBA does not require an independent measurement of a standard, and is not adversely affected by variations in reaction kinetics since it is an endpoint readout method.
In this study, we apply dNASBA to the quantification of HIV-1 RNA. HIV-1 RNA in plasma is an important marker for HIV-1 infection, for evaluation of disease progression31–33 and monitoring of treatment effectiveness during antiretroviral therapy.34–36 We improved the design of our SD chip, and used it to systematically compare dNASBA with qNASBA. We demonstrate that dNASBA is more sensitive and accurate than qNASBA for HIV-1 RNA quantitation, and that it can be used to quantify HIV-1 RNA in human plasma samples.
Experimental Section
Materials and Instrumentation.
All reagents were purchased from Sigma-Aldrich (St. Louis, MO) except as indicated. The DNA was synthesized by Integrated DNA Technologies (Coralville, IA). HIV-1 RNA (Group M, Subtype B) was ordered from SeraCare Life Sciences Inc. (Catalog # 0400–0078, Milford, MA), and the concentration was measured using an Abbott RealTime HIV-1 assay (Abbott Laboratories, Chicago, IL). A NASBA Kit was purchased from Life Sciences Advance Technologies Inc. (St. Petersburg, FL). Abil WE 09 and Tegosoft DEC were samples from Evonik Industries (Essen, Germany). Bovine serum albumin (BSA) was purchased from Thermo Fisher Scientific (Waltham, MA). Nanopure water (18.2 MΩ; MillporeCo., Bedford, MA, USA) was used in all experiments and in buffer preparation. qNASBA reactions were run and analyzed using a Bio-Rad CFX96 Real-Time PCR instrument (Bio-Rad Laboratories, Hercules, CA). dNASBA was performed using an Eppendorf thermal cycler with an in situ adapter. Images were acquired using a Typhoon FLA9000 imaging system (GE Healthcare, Pittsburgh, PA).
Quantitative NASBA.
The primers used have been described previously.37–38 The primers target the long terminal repeat (LTR) region of the HIV-1 genome, a highly conserved region. The sense primer was 5’-CTCAATAAAGCTTGCCTTGA-3’, and the T7 antisense primer was 5’-AATTCTAATACGACTCACTATAGGGAGAGGGGCGCCACTGCTAGAGA-3’. We designed a new molecular beacon to provide better contrast between positive and negative chambers: 5’-FAM-CGCTTCCAGTAGTGTGTGCCCGTCTGTGGAAGCG-3IABkFQ-3’, with the self-hybridizing region underlined. We mixed T7 antisense primer and HIV-1 RNA in 3X NASBA reaction buffer (NECB-1–24, Life Sciences Advance Technologies), heated the sample at 70°C for 1 min then cooled to 41°C. We then added NASBA Enzyme Cocktail (NEC-1–24), 6X Nucleotide Mix (NECN-1–24), sense primer, molecular beacon, 0.5% BSA, and 0.05% Tween-20, and incubated at 41°C for 110 min in a Bio-Rad CFX96 Real-Time PCR instrument. The final concentration of the sense and reverse primers was 250 nM, and the concentration of the molecular beacon was 80 nM. Total volume was 20 μL. Fluorescence intensity was recorded once per minute.
Electrophoresis.
After the NASBA reaction, 5 μL of sample was loaded onto a 1% agarose gel, and gel electrophoresis was performed using a Mupid-exU submarine electrophoresis system (Eurogentec, Belgium) for 30 min at 50 V in tris-borate-EDTA (TBE) buffer. Gels were imaged using a Typhoon FLA9000 imaging system with excitation at 473 nm.
Device Loading.
The SD chip was fabricated as described previously.27 An oil mixture composed of 0.04% Abil WE 09, 91% Tegosoft DEC, and 9% light mineral oil was prepared and pipetted into the inlet and outlet of the chip. A vacuum was used to load the oil onto the chip, displacing air from the channel and chamber array. The NASBA reaction mixture was added to the inlet, and flowed into the channel and chambers under vacuum. An additional oil mixture was then added to isolate the aqueous sample in compartmentalized volumes, digitizing the sample. For digitization tests, 2 μM calcein was added to the NASBA buffer to generate a fluorescent signal. Fluorescent photographs were acquired with an Olympus MVX10 stereoscope (Olympus Corporation, Shinjuku, Tokyo, Japan).
Digital NASBA.
The dNASBA reaction mixture was the same as for qNASBA, with indicated concentrations of HIV-1 RNA. After loading the sample onto the chip, the chip was placed on an Eppendorf Mastercycler (Eppendorf, Hamburg, Germany) fitted with an in situ adapter and heated to 41°C for 110 min.
HIV Plasma Samples.
Viral strains tested here include HIV-1 LAI (group M, subtype B) and HIV-2 ROD9 (group A). Viral cultures were diluted with HIV negative human plasma (Purchased from SeraCare, Milford, MA) and inactivated by heating at 65°C for 15 min, then stored in a −80°C freezer. Before reactions, inactivated samples were thawed and 1 μL of sample was incubated with 1 μL of 5% Triton X-100 for 2 min to lyse the virus and release the RNA. The sample was diluted by reaction mixture to 20 μL then start the dNASBA reaction. The HIV viral load of viral samples was quantified using an Abbott RealTime assay.
Data Processing.
Images were acquired using a Typhoon FLA9000 imaging system with excitation at 473 nm. Analysis was performed using ImageJ software (http://rsbweb.nih.gov). The fluorescence intensity of a negative control image was used as the background. A threshold was defined as the mean negative value plus three times the negative standard deviation. Positive chambers were defined as those having fluorescence intensity above the threshold, and the number of positive chambers was counted. Chambers with low volume were discarded from analysis.
We assumed that the number of RNA molecules per chamber followed a standard Poisson distribution. Every positive chamber was assumed to have contained at least one copy of RNA before the reaction, and every negative chamber was assumed to contain zero copies of RNA. The number of RNA molecules was calculated using the equation, λ = -ln(1-k/n), where λ represents the mean number of target RNA molecules per chamber, n is the total number of chambers measured, and k is the number of positive chambers.
Statistical analysis of data sets with different concentrations.
The Kruskal Wallis test was used to evaluate whether the data sets with two different concentrations were statistically different. P < 0.05 indicates over 95% confidence level that the concentrations of two samples are different.
Results and Discussion
The mechanism of RNA amplification in NASBA and the generation of fluorescence using a molecular beacon are shown in Figure 1A. We tested qNASBA using HIV-1 RNA concentrations of 0 and 103 copies/μL (Figure 1B). Fluorescence was observed only in the sample containing RNA. Electrophoresis confirmed RNA amplification (Figure 1C). The band was due to the fluorescence of the molecular beacon when it hybridized with antisense RNA. We then performed qNASBA at a range of HIV-1 RNA concentrations and plotted TTP (the time for fluorescence intensity to pass a certain threshold)
versus input HIV-1 RNA concentration to obtain a quantification curve (Figure 1D). TTP showed a strong correlation with input concentration (R2=0.92) for input concentrations ≥20 copies/μL. However, at ≤10 copies/μL TTP values varied widely. These results indicated that qNASBA could not accurately quantify RNA at low concentrations, in agreement with a previous study.25
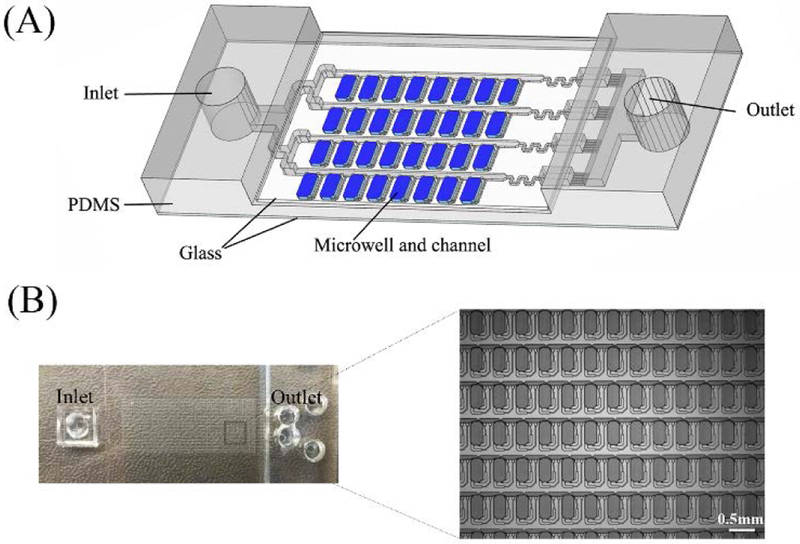
We next performed digital NASBA using a self-digitization (SD) chip (Figure 2) designed to automatically separate an aqueous sample into 1024 (16 × 64) discrete 6.5 nL chambers. This chip was applied previously in digital isothermal loop-mediated DNA amplification (dLAMP)29 and digital RT-PCR (dRT-PCR),27 and was modified in this study. Chambers containing digitized aqueous droplets were evenly distributed along one side of each channel. There were 16 parallel channels split from the main inlet and connected with the outlet reservoir, each with 64 chambers along its length. The microfluidic array was made in poly(dimethylsiloxane) (PDMS) and sealed using a glass microscope slide coated with PDMS to provide hydrophobic channel and chamber surfaces. A glass coverslip was used to seal the opposite side of the PDMS to prevent evaporation through the PDMS.
Figure 2. Self-digitization chip.
(A) Schematic of SD chip. A 16 × 64 array of 6.5 nL microwells connected by channels is embedded in PDMS and covered with a PDMS-coated glass slide. (B) Photograph of SD chip. Enlarged area shows a section of the microwell array.
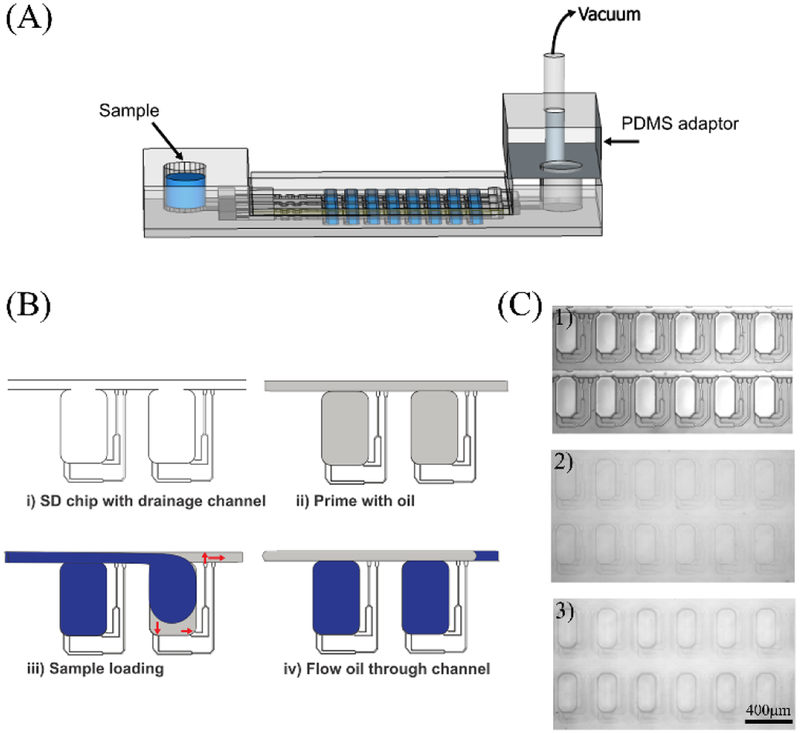
To load an aqueous sample, the SD chip was primed with an oil mixture, then the aqueous sample was added to the inlet. Negative pressure was applied using a vacuum pump connected to a PDMS adaptor, and the aqueous sample filled the microarray, displacing the oil (Figure 3A). In a modification of our previous SD chip design, branched drainage channels connecting individual chambers and channels were introduced to help oil drain from the chambers (Figure 3B). Once the aqueous sample was loaded, additional oil mixture was loaded to isolate the aqueous sample in each chamber, digitizing the sample. Figure 3C shows photographs of the SD chip (1) empty, (2) filled with oil mixture, and (3) after digitization. The modified SD chip enabled good efficiency and completeness of sample loading (Figure S1).
Figure 3. Sample Loading.
(A) Schematic of sample loading onto the SD chip. Aqueous sample was added to the inlet, and a vacuum pump was connected to a PDMS adapter. (B) Schematic of SD chip filling. i) Branched drainage channels connecting individual chambers and channels were introduced to improve oil drainage from chambers; ii) The array is primed with oil mixture to eliminate air; iii) Aqueous sample travels from the inlet through the channels and expands into the chambers to lower the surface energy. Drainage channels allow oil to drain from chambers but are too small to allow passage of aqueous sample; iv) Additional oil displaces aqueous solution from channels but not from chambers, digitizing the sample. (C) Photographs of SD chip (1) empty, (2) filled with oil mixture, and (3) after digitization.
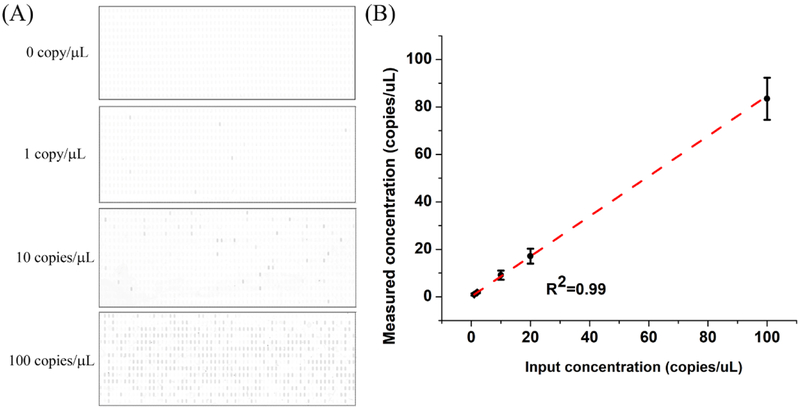
The sensitivity of the dNASBA assay was evaluated using a range of HIV-1 RNA concentrations, from 1–100 copies/μL (Figure 4). Representative results of the dNASBA assay at 0, 1, 10, and 100 copies/μL are shown in Figure 4A. The reaction lacking HIV-1 RNA (negative control) showed no positive chambers, and with increasing HIV-1 RNA concentration, more positive chambers were observed. To distinguish positive and negative chambers, we analysed the fluorescence intensity of the chambers of the negative control sample (Figure S2), and defined the threshold as the mean value for the negative control chambers plus three times the standard deviation. Chambers with fluorescence intensity above the threshold were defined as positive. The HIV-1 RNA concentration of the original sample was calculated from the number of positive chambers based on Poisson statistics. This measured concentration correlated well with input concentration (R2=0.99, Figure 4B), indicating that the dNASBA assay was capable of accurately quantifying HIV-1 RNA, even at low RNA concentrations.
Figure 4. Digital NASBA.
Digital NASBA results for different concentrations of HIV-1 RNA. (A) SD chip images. Positive chambers appear dark. (B) Measured versus input HIV-1 RNA concentration. Error bars indicate standard deviation (n=3).
To further compare the sensitivities of dNASBA and qNASBA, we used samples with low copy numbers of HIV-1 RNA (5, 50, and 100 molecules). We repeated each assay three times at each copy number. qNASBA showed no signal when the input copy number was 5 or 50 (Figure S3), no signal in one of three assays at a copy number of 100, and widely varying signal in the other two assays at a copy number of 100. In contrast, dNASBA detected HIV-1 RNA at all three copy numbers reliably and reproducibly, with a good correlation between measured and input copy numbers (Figure S3). These results demonstrated that dNASBA was significantly more sensitive than qNASBA.
We also compared the ability of dNASBA and qNASBA to distinguish between two concentrations of HIV-1 RNA (10 and 20 copies/μL) (Figure S4). The two assays were repeated five times at each concentration. dNASBA was able to distinguish the two concentrations with statistical significance (p=0.01), while qNASBA was not (p=0.25).
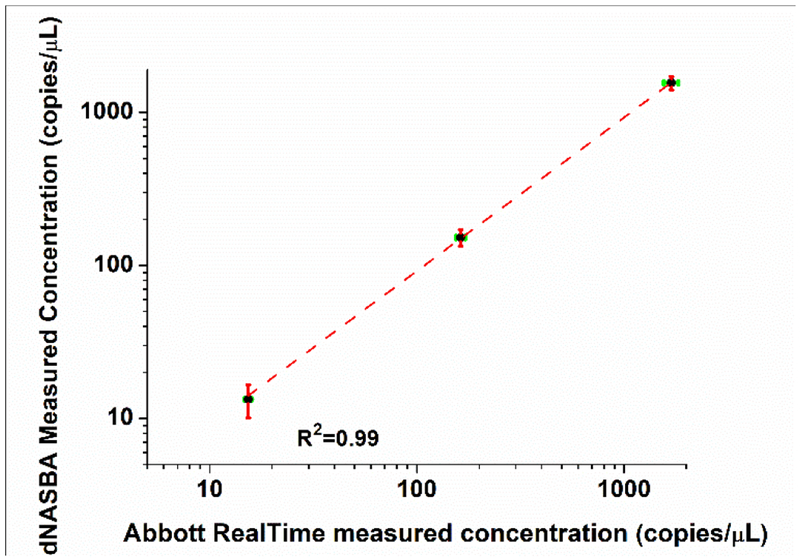
We next tested the performance of dNASBA when applied to quantifying HIV-1 RNA in human plasma samples, by comparing dNASBA results with results from commercial method, the Abbot RealTime PCR assay. Plasma samples were diluted and inactivated, TritonX-100 was used to lyse the virus, and the samples were serially diluted into dNASBA reaction mixtures. The HIV-1 RNA concentrations measured using dNASBA at the three dilutions were 1559 ± 158, 152 ± 19, and 13 ± 4 copies/μL (Figure 5), while the concentrations of the same samples measured using an Abbot RealTime PCR assay were 1692 ± 138, 163 ± 8.5 and 15 ± 0.6 copies/μL. A sample from a patient with HIV-2 virus was used as a control to verify the specificity of the dNASBA reaction. Only one of the 1024×3 chambers showed a positive signal, a false-positive rate of <0.03%. (The Abbott RealTime PCR assay gave a concentration of >1000 copies/μL for this HIV-2 sample.) The concentration values from the dNASBA assay correlated well with the values from the Abbott RealTime PCR assay (R2=0.99), with excellent specificity for HIV-1 RNA. These results demonstrate the feasibility of using dNASBA to quantify HIV-1 viral RNA in plasma samples.
Figure 5.
Quantification of HIV-1 RNA in human plasma using dNASBA (y-axis) and Abbot RealTime PCR assay (x-axis). The HIV-1 with different dilution factor (black dot, diluted 1, 10 and 100 times) was tested and HIV-2 was used as a control. Green error bars indicate standard deviation by Abbott RealTime assay, and red error bars indicate standard deviation by dNASBA (n=3).
Conclusions
In this study we demonstrate a digital form of NASBA using a self-digitization chip and apply it to quantifying HIV-1 RNA viral load in a human plasma sample. dNASBA could detect as little as 1 copy/μL of HIV-1 RNA, a sensitivity an order of magnitude better than that of qNASBA. dNASBA was also more accurate in quantifying HIV-1 RNA than qNASBA, and required no independent measure of concentration. Furthermore, dNASBA is an isothermal technique (reaction at 41°C) requiring no complex instrumentation for temperature control. A simple mixing step of human plasma sample with TritonX-100 allows HIV RNA detection. Further optimization and development of the dNASBA assay is warranted to create an accurate, low-cost, and portable POC diagnostic tool for quantifying viral RNA in resource-limited settings.
Supplementary Material
Acknowledgements
We gratefully acknowledge support from the National Institutes of Health (R01EB021150) and the Bill & Melinda Gates Foundation.
Footnotes
Electronic Supplementary Information (ESI) available: [details of any supplementary information available should be included here]. See DOI: 10.1039/x0xx00000x
Notes and References
‡ Footnotes relating to the main text should appear here. These might include comments relevant to but not central to the matter under discussion, limited experimental and spectral data, and crystallographic data.
§
§§
etc.
References
- 1.Shi C; Shen X; Niu S; Ma C J Am Chem Soc 2015, 137, 13804–13806. [DOI] [PubMed] [Google Scholar]
- 2.Sullenger BA; Gilboa E Nature 2002, 418, 252–258. [DOI] [PubMed] [Google Scholar]
- 3.Lee JH; Daugharthy ER; Scheiman J; Kalhor R; Ferrante TC; Terry R; Turczyk BM; Yang JL; Lee HS; Aach J; Zhang K; Church GM Nat. Protocols 2015, 10, 442–458. [DOI] [PMC free article] [PubMed] [Google Scholar]
- 4.Buxbaum AR; Wu B; Singer RH Science 2014, 343, 419–422. [DOI] [PMC free article] [PubMed] [Google Scholar]
- 5.Hansen CH; van Oudenaarden A Nat Meth 2013, 10, 869–871. [DOI] [PMC free article] [PubMed] [Google Scholar]
- 6.Cobb BR; Vaks JE; Do T; Vilchez RA J clin Virol 2011, 52. [DOI] [PubMed] [Google Scholar]
- 7.Saiki R; Scharf S; Faloona F; Mullis K; Horn G; Erlich H; Arnheim N Science 1985, 230, 1350–1354. [DOI] [PubMed] [Google Scholar]
- 8.Chen C; Ridzon DA; Broomer AJ; Zhou Z; Lee DH; Nguyen JT; Barbisin M; Xu NL; Mahuvakar VR; Andersen MR; Lao KQ; Livak KJ; Guegler KJ Nucleic Acids Res 2005, 33, e179–e179. [DOI] [PMC free article] [PubMed] [Google Scholar]
- 9.Fiscus SA; Cheng B; Crowe SM; Demeter L; Jennings C; Miller V; Respess R; Stevens W; and the Forum for Collaborative, H. I. V. R. A. V. L. A. W. G. PLOS Med 2006, 3, e417. [DOI] [PMC free article] [PubMed] [Google Scholar]
- 10.Compton J Nature 1991, 350, 91–92. [DOI] [PubMed] [Google Scholar]
- 11.Kievits T; van Gemen B; van Strijp D; Schukkink R; Dircks M; Adriaanse H; Malek L; Sooknanan R; Lens P J Virol Methods 1991, 35, 273–286. [DOI] [PubMed] [Google Scholar]
- 12.Mo Q-H; Wang H-B; Tan H; Wu B-M; Feng Z-L; Wang Q; Lin J-C; Yang Z J Virol Methods 2015, 213, 1–4. [DOI] [PubMed] [Google Scholar]
- 13.Ginocchio CC; Tetali S; Washburn D; Zhang F; Kaplan MH J Clin Microbiol 1999, 37, 1210–1212. [DOI] [PMC free article] [PubMed] [Google Scholar]
- 14.Delaney JA; Ulrich RM; Paul JH Harmful Algae 2011, 11, 54–64. [Google Scholar]
- 15.Mercier-Delarue S; Vray M; Plantier JC; Maillard T; Adjout Z; de Olivera F; Schnepf N; Maylin S; Simon F; Delaugerre C J Clin Microbiol 2014, 52, 52–56. [DOI] [PMC free article] [PubMed] [Google Scholar]
- 16.Pardee K; Green Alexander A.; Takahashi Melissa K.; Braff D; Lambert G; Lee Jeong W.; Ferrante T; Ma D; Donghia N; Fan M; Daringer Nichole M.; Bosch I; Dudley Dawn M.; O’Connor David H.; Gehrke L; Collins James J. Cell 2016, 165, 1255–1266. [DOI] [PubMed] [Google Scholar]
- 17.Gootenberg JS; Abudayyeh OO; Lee JW; Essletzbichler P; Dy AJ; Joung J; Verdine V; Donghia N; Daringer NM; Freije CA; Myhrvold C; Bhattacharyya RP; Livny J; Regev A; Koonin EV; Hung DT; Sabeti PC; Collins JJ; Zhang F Science 2017, 356, 438–442 [DOI] [PMC free article] [PubMed] [Google Scholar]
- 18.Zhao X; Dong T Anal Chem 2012, 84, 8541–8548. [DOI] [PubMed] [Google Scholar]
- 19.Zhao X; Dong T; Yang Z; Pires N; Hoivik N Lab on a Chip 2012, 12, 602–612. [DOI] [PubMed] [Google Scholar]
- 20.Reinholt SJ; Behrent A; Greene C; Kalfe A; Baeumner AJ Anal Chem 2014, 86, 849–856. [DOI] [PMC free article] [PubMed] [Google Scholar]
- 21.Dimov IK; Garcia-Cordero JL; O’Grady J; Poulsen CR; Viguier C; Kent L; Daly P; Lincoln B; Maher M; O’Kennedy R; Smith TJ; Ricco AJ; Lee LP Lab on a Chip 2008, 8, 2071–2078. [DOI] [PubMed] [Google Scholar]
- 22.Kreutz JE, Development of multiphase microfluidic systems for energy and medicine. The University of Chicago: 2011. [Google Scholar]
- 23.Leone G; van Schijndel H; van Gemen B; Kramer FR; Schoen CD Nucleic Acids Res 1998, 26, 2150–2155. [DOI] [PMC free article] [PubMed] [Google Scholar]
- 24.Weusten JJAM; Carpay WM; Oosterlaken TAM; van Zuijlen MCA; van de Wiel PA Nucleic Acids Res 2002, 30, e26–e26. [DOI] [PMC free article] [PubMed] [Google Scholar]
- 25.Patterson SS; Casper ET; Garcia-Rubio L; Smith MC; Paul JH J Microbiol Meth 2005, 60, 343–352. [DOI] [PubMed] [Google Scholar]
- 26.Hønsvall BK; Robertson LJ Water Res 2017, 109, 389–397. [DOI] [PubMed] [Google Scholar]
- 27.Thompson AM; Gansen A; Paguirigan AL; Kreutz JE; Radich JP; Chiu DT Anal Chem 2014, 86, 12308–12314. [DOI] [PMC free article] [PubMed] [Google Scholar]
- 28.Schneider T; Yen GS; Thompson AM; Burnham DR; Chiu DT Anal Chem 2013, 85, 10417–10423. [DOI] [PMC free article] [PubMed] [Google Scholar]
- 29.Gansen A; Herrick AM; Dimov IK; Lee LP; Chiu DT Lab on a Chip 2012, 12, 2247–2254. [DOI] [PMC free article] [PubMed] [Google Scholar]
- 30.Cohen DE; Schneider T; Wang M; Chiu DT Anal Chem 2010, 82, 5707–5717. [DOI] [PMC free article] [PubMed] [Google Scholar]
- 31.Mellors JW; Rinaldo CR; Gupta P; White RM; Todd JA; Kingsley LA Science 1996, 272, 1167–1170. [DOI] [PubMed] [Google Scholar]
- 32.Schuurman R; Descamps D; Weverling GJ; Kaye S; Tijnagel J; Williams I; van Leeuwen R; Tedder R; Boucher CA; Brun-Vezinet F; Loveday C J Clin Microbiol 1996, 34, 3016–3022. [DOI] [PMC free article] [PubMed] [Google Scholar]
- 33.Mellors JW; Munoz A; Giorgi JV; et al. Ann Intern Med 1997, 126, 946–954. [DOI] [PubMed] [Google Scholar]
- 34.Thompson MA; Aberg JA; Hoy JF; et al. JAMA 2012, 308, 387–402. [DOI] [PubMed] [Google Scholar]
- 35.Günthard HF; Saag MS; Benson CA; et al. JAMA 2016, 316, 191–210. [DOI] [PMC free article] [PubMed] [Google Scholar]
- 36.O’Brien WA; Hartigan PM; Martin D; Esinhart J; Hill A; Benoit S; Rubin M; Simberkoff MS; Hamilton JD; AIDS, t. V. A. C. S. G. o. New Engl J Med 1996, 334, 426–431. [DOI] [PubMed] [Google Scholar]
- 37.de Baar MP; van Dooren MW; de Rooij E; Bakker M; van Gemen B; Goudsmit J; de Ronde A J Clin Microbiol 2001, 39, 1378–1384. [DOI] [PMC free article] [PubMed] [Google Scholar]
- 38.de Baar MP; van der Schoot AM; Goudsmit J; Jacobs F; Ehren R; van der Horn KHM; Oudshoorn P; de Wolf F; de Ronde A J Clin Microbiol 1999, 37, 1813–1818. [DOI] [PMC free article] [PubMed] [Google Scholar]
- 39.Qin Y, Wu L, Schneider T; Yen GS; Wang J, Xu S, Li M, Paguirigan AL, Smith JL, Radich JP, Anand RK, Chiu DT, Angew. Chem. Int. Ed. Engl 2018, doi: 10.1002/anie. [DOI] [PMC free article] [PubMed] [Google Scholar]
Associated Data
This section collects any data citations, data availability statements, or supplementary materials included in this article.


