

Abstract
Recently we reported that IL-4 and IL-13 signaling in murine early thymic progenitors (ETPs) expressing the heteroreceptor (HR) comprising IL-4 receptor alpha (IL-4Rα) and IL-13 receptor alpha 1 (IL-13Rα1) activate STAT6 and inhibit ETP maturation potential towards T cells. In this study we asked whether IL-4 and IL-13 signaling through the HR mobilizes other STAT molecules to shape ETP fate decision. The findings indicate that HR+ETPs undergoing cytokine signaling display increased STAT1, but not STAT3, phosphorylation in addition to STAT6 activation. In parallel, the ETPs had a STAT1-dependent heightened expression of IRF-8, a transcription factor essential for development of CD8α+ dendritic cells (DCs). Interestingly, STAT1 phosphorylation and IRF-8 upregulation which were independent of STAT6 activation guided ETP maturation towards myeloid cells with a CD8α+ DC phenotype. Furthermore, these CD8α+ DCs display a thymic resident phenotype as they did not express SIRPα, a molecule presumed to be involved in cell migration. These findings suggest that IL-4 and IL-13 cytokine-induced HR signaling provides a double-edged sword that simultaneously blocks T cell lineage potential but advances myeloid maturation which could impact T cell selection and central tolerance.
Introduction
Early T cell lineage progenitors are bone marrow (BM)-derived stem cells which settle in the thymus (1). Initially these cells were believed to give rise solely to T cells (2) but a process of infidelity was reported demonstrating that the progenitors can also give rise to myeloid cells (3). Further investigations indicated that the progenitors, in fact, remain multipotent and can give rise to both myeloid and lymphoid cells (4, 5), hence the designation early thymic progenitors (ETPs) rather than early T-cell lineage progenitors (4). Lately however, it was shown that certain ETPs are unipotent and give rise to either myeloid or lymphoid cells (6, 7). For example we have shown that ETPs expressing the IL-4Rα/IL-13Rα1 heteroreceptor (HR) are restricted to the myeloid lineage (7). This suggests that the HR on ETPs serves as a responsive element to IL-4 and IL-13 in the thymic microenvironment and its signaling shapes lineage choice. In fact, signaling analysis demonstrated that fresh unmanipulated HR+ETPs isolated from the thymus display increased expression of activated STAT6 transcription during commitment to the myeloid lineage (8). Specifically, STAT6 activation in HR+ETPs which is tied to cytokine signaling through the HR, led to downregulation of Notch1, a critical factor in T cell development (9), and inhibited ETP maturation towards the T cell lineage while enacting myeloid fate decision (8). Thus, HR+ETPs, while belong to the double negative (DN1c) population, they do not represent thymic seeding precursors for DCs (TSPDC) which are devoid of T-cell potential (10, 11). Rather, HR+ c-kit+CD44+ cells represent ETPs whose T-cell potential is inhibited by cytokine signaling through the HR (8). The HR, which is usually involved in allergic reactions (12, 13), has also been shown to drive death of neonatal Th1 cells (14) and to influence the function of DCs and basophils (15) as well as the differentiation of macrophages (Mφ) (16). However, much less is known about its signaling (17) and the pathways that sustain these functions have yet to be defined. In human monocytes, IL-4/IL-13 signaling through the HR has been shown to involve STAT1, STAT3 and STAT6 transcription factors (18). While HR-driven STAT6 activation inhibits ETP maturation towards T cells the question remains open as to whether STAT1 and STAT3 are involved in the process of maturation and myeloid fate decision. Initial experiments indicated that fresh unmanipulated HR+ETPs display increased phosphorylation of STAT1 but not STAT3 in parallel to STAT6 activation. Furthermore, this cytokine- induced STAT1 activation led to up-regulation of IRF-8, a transcription factor essential for the development of CD8α+ DCs (19). Interestingly, IL-4/IL-13 induced STAT1 activation directed ETP maturation towards myeloid cells of DC phenotype most of which belong to the CD11c+CD8α+ DC subset. Thus, IL-4/IL-13 signaling through the HR induces activation of both STAT1 and STAT6 transcription factors to inhibit the T-cell lineage pathway and divert fate decision towards CD11c+CD8α+ DCs. These previously unrecognized observations opens avenues as to the role cytokines and their receptors may play in ETP fate decision and how it may impact T cell selection and central tolerance.
Materials and methods
Mice
Mice deficient for Il13ra1 gene on both alleles which are referred to as IL-13Rα1−/− have been previously described (7, 8, 16, 20). CD45.2 IL-13Rα1+/+-GFP, CD45.2 IL-13Rα1−/−, CD45.2 IL-13Rα1+/+, and CD45.1 IL-13Rα1+/+ C57BL/6 mice were previously described (7). Only 6–8 week age matched female mice were used in this study. All animals were maintained under specific pathogen–free conditions in individually ventilated cages and kept on a 12 h light-dark cycle with access to food and water ad libitum. All animal experiments were done according to protocols approved by the University of Missouri Animal Care and Use Committee.
Flow Cytometry
Antibodies.
Anti-CD3 (145–2C11), anti-CD4 (RM4–5), anti-CD8 (53–6.7), anti-CD25 (7D4), anti-CD44 (IM7), anti-CD45 (30-F11), anti-Pax5 (1H9), anti-CD45.1 (A20), anti-CD11b (M1/70), anti-CD11c (HL3), anti-CD117 (2B8), anti-IFNγR1 (XMG1.2), anti-pSTAT6Y641 (J71–773.58.11), anti-pSTAT3S727 (49/p-Stat3), anti-pSTAT3Y705 (4/P-STAT3), anti-Zbtb46 (U4–1374), anti-SIRPα (P84), and anti-CD90.1 (OX-7), were purchased from BD biosciences (San Jose, CA). Anti-pSTAT1S727 (D3B7), and anti-pSTAT1Y701 (D4A7) antibodies were purchased from Cell Signaling Technologies (Danvers, MA). Anti-CD45.2 (104), anti-IRF-8 (V3GYWCH), and anti-IRF-4 (3E4) were purchased from eBiosciences (San Diego, CA). Anti-PU.1 (7C2) was purchased from Biolegend (San Diego, CA). Anti-IL-12Rβ2 (305719) was purchased from R&D Systems (Minneapolis, MN), Anti-IL-13Rα1 antibody (1G3-A7) was produced in our laboratory (16).
Lineage (Lin) depletion antibodies.
These were purchased from Miltenyi Biotech (San Diego, CA) as a kit which include antibodies against CD8α (Ly-2), CD11b (Mac-1), CD11c, CD19, B220(CD45R), CD49b(DX5), CD105, MHCII+, Ter-119+, TCRɣ/δ. Anti-CD4 microbead antibody (L3T4) was also used in the lineage depletion experiments.
Fluorochromes.
Antibodies were directly conjugated to fluorescein isothiocyanate (FITC), phycoerythrin (PE), PE-Cy5, PE-Cy5.5, peridinin-chlorophyll-protein complex (PerCP)-Cy5.5, PE-Cy7, allophycocyanin-Cy7 (or allophycocyanin eFluor780), or biotin. Biotinylated antibodies were revealed with Streptavidin PE or APC.
Sample reading.
This used a Beckman Coulter CyAn (Brea, CA) and data were analysed using FlowJo version 10 (Tree Star). Dead cells were excluded using 7-aminoactinomycin D (7AAD; EMD Biosciences) or Fixable Viability Dye (FVD) eFluor® 780 (eBioscience).
Cell sorting
ETPs were isolated as previously described (7). In brief, thymi were harvested from either IL-13Rα1+/+-GFP or IL-13Rα1−/− C57BL/6 mice after perfusion with PBS and the CD4+ cells were eliminated by MACS using anti-CD4 microbeads. The ETPs were then isolated after depletion of Lin+ (CD8α+, CD11b+, CD11c+, CD19+, B220+, CD49b+, CD105+, MHCII+, Ter-119+, TCRɣ/δ+) thymic cells. HR+ETPs (cKit+CD44+CD25-) were sorted from Lin- thymic cells of IL-13Rα1+/+-GFP reporter mice on the basis of GFP (IL-13Rα1) expression. HR-/PETPs represent the GFP- cells of the lin-cKit+CD44+CD25- thymic cells. These cells have the genetic potential for receptor expression because they are isolated from IL-13Rα1+/+-GFP reporter mice and as such referred to as HR-/PETPs. HR−/−ETPs were sorted from Lin- thymic cells of IL-13Rα1−/− mice on the basis of CD44, cKit and CD25 (cKit+CD44+CD25-).
Sorting was performed on a Beckman Coulter MoFlo XDP (Brea, CA) cell sorter. Cell purity was routinely checked, and only sorts with a purity of ˃95% were used in this study.
OP9 Cell Culture
OP9 stromal cell culture was used as previously described (21) with slight modifications. Briefly, OP9 stromal cells were plated 2 days before initiation of cultures at a concentration of 20,000 cells/ml in 24-well plates. Progenitors were then added at 3 × 10³ cells per well. GM-CSF was used at a final concentration 10ng/ml, IL-4 at 10ng/ml and IL-13 at 20ng/ml. Myeloid progeny was evident at day 7 of OP9 cell culture under these conditions.
Cloning of IL-13Rα1 into Retroviral Vectors
Total RNA was isolated from gut epithelial cells for Il13ra1 gene and cDNA was made using RevertAid First Strand cDNA Synthesis Kit (Thermo Scientific) according to manufacturer’s protocol. cDNA was used as a template to amplify Il13ra1 using gene specific primers. The amplified products were then cloned into Not I and Cla I restriction sites of the MSCV-IRES-Thy1.1(22) vector to generate MSCV-Il13ra1-IRES-Thy1.1 (HR-RV). The primers used to clone IL-13Rα1 are:
IL-13Rα1
sense 5’-TAGTAGGCGGCCGCACCATGGCGCGGCCAGCGCTGCTGGGCGAG-3’ antisense 5’-TAGTAGATCGAT CCATCAAGGAGCTGCTTTCTTCAG-3’
The construct containing IL-13Rα1 gene was verified by automated sequencing.
Retroviral Transduction
Retroviral packaging was performed as described (22) with slight modifications. Briefly, 293FT cells (Invitrogen) were transfected with either HR-RV or control vector MSCV-IRES-Thy1.1 (Empty-RV) along with the retroviral packaging vector (p-cECO) by Lipofectamine 2000. After 48 hr, viral supernatants were then mixed with polybrene (1μg/ml) and used to transduce ETPs. Retrovirus infected ETPs were then suspended for 48 hours in stimulation DMEM cocktail containing 1% penicillin/streptomycin, 20% fetal calf serum (FCS), L- glutamine (2 mM), IL-3 (10ng/ml), IL-6 (10ng/ml), SCF (20ng/ml) and Flt3-ligand (20ng/ml) before sorting.
RT-PCR
RNA was isolated from HR+, HR-/P or HR−/− ETPs by Trizol extraction and isopropanol precipitation. RT-PCR was performed on a StepOnePlus Instrument cycler (Applied Biosystems) using Power SYBR Green RNA-to-CT 1-Step Kit (Applied Biosystems) according to the manufacturer’s instructions. The primers used in these experiments were as follows:
IRF4:
sense 5’ - GGACTACAATCGTGAGGAGGAC −3’
antisense 5’- ACGTCACAGGACATTGATATGG −3’
PU.1
sense 5’ - CCCGGATGTGCTTCCCTTAT-3’
antisense 5’- TCCAAGCCATCAGCTTCTCC-3’,
IRF8
sense 5’- GAGCGAAGTTCCTGAGATGG-3’
antisense 5’-TGGGCTCCTCTTGGTCATAC-3’
Zbtb46
sense 5’- AGAGAGCACATGAAGCGACA-3’
antisense 5’ -CTGGCTGCAGACATGAACAC-3’
Pax5
sense 5’-ACAGGACATGGAGGAGTGAATCA-3’
antisense 5’- CCTTGATGGGCAAGTTCCACTA-3’
Nfil3
sense 5’ -GAACTCTGCCTTAGCTGAGGT-3’
antisense 5’- ATTCCCGTTTTCTCCGACACG-3’
RelB
sense 5’- GCCGAATCAACAAGGAGAGCG-3’
antisense 5’- CATCAGCTTGAGAGAAGTCGGCA-3,
IfnɣR1
sense 5’ - CAGCATACGACAGGGTTCAA-3’
antisense 5’- GATGCTGTCTGCGAAGGTC-3’
IfnɣR2
sense 5’-TGACGGCTCCCAAGTTAGAA-3’
antisense 5’-CTGCTGCTCTGTGGGCTC-3’
IL-12Rβ1
sense 5’-CCCCAGCGCTTTAGCTTT-3’
antisense 5’- GCCAATGTATCCGAGACTGC-3’
IL-12Rβ2
sense 5’-TGTGGGGTGGAGATCTCAGT-3’
antisense 5’-TCTCCTTCCTGGACACATGA-3’
IL-27p28
Sense 5’ -TTCCCAATGTTTCCCTGACTTT-3’
antisense 5’-AAGTGTGGTAGCGAGGAAGCA-3’
GAPDH
sense 5’-AACTTTGGCATTGTGGAAGG-3’
antisense 5’-GGATGCAGGGATGATGTTCT-3’
Relative transcript abundance was determined by comparative threshold cycle method using the StepOne software (Applied Biosystems) normalization with GAPDH. All samples were run in triplicate.
In vivo and in vitro inhibition of STAT1 and STAT6
STAT1 (Fludarabine) and STAT6 (AS1517499) inhibitors were dissolved in 50μl DMSO/PBS (1vol/1vol) and administered to mice intraperitoneally. STAT1 inhibitor was given to mice (40 mg/kg) daily for 10 days while STAT6 inhibitor (10 mg/kg) was injected once a day for 5 days. DMSO/PBS with no inhibitor was used as control. For in vitro inhibition STAT1 and STAT6 inhibitors were used at 5¼M and 200nM, respectively.
Measurement of STAT1/ STAT6 activation and IRF8 expression
In vitro.
ETPs were isolated from HR−/− mice, transduced with HR-RV, and sorted as IL-13Rα1+ (HR+) Thy1.1+ ETPs. These HR-RV transduced ETPs were then treated with 10 ng/ml IL-4, 20 ng/ml IL-13, 10 ng/ml IFNɣ or 10 ng/ml IL-12 in the presence or absence of STAT1 or STAT6 inhibitor. STAT1and STAT6 phosphorylation was analysed 1 hour later by flow cytometry. IRF-8 expression was analysed by flow cytometry after 24 hour incubation.
Ex vivo.
HR+/+ IL-13Rα1-GFP reporter mice were given STAT1 or STAT6 inhibitor and the Lin-CD4-CD8- thymocytes were isolated by MACS. The cells were then stained with antibodies to CD25, CD44, c-Kit, pSTAT1, pSTAT6 and IRF8. The phosphorylation of STAT1/ STAT6 and IRF8 expression were measured on CD25-CD44+c-Kit+GFP+(HR+) or CD25-CD44+c-Kit+GFP-(HR-/P) ETPs by flow cytometry.
Detection of IL-4 and IL-13 secretion by thymic cells
The levels of IL-4 and IL-13 in culture supernatant from PMA and ionomycin stimulated thymic cells were determined by ELISA. Antibody pairs used were 11B11 (capture) and biotinylated BVD6–24G2 (detection) for IL-4 and clone 13A (capture ) and biotinylated 1316H (detection) for IL-13. The OD405 was measured using a SpectraMax 340 microplate reader (Molecular Devices, Menlo Park, CA) and the data was analysed using SoftMAX Pro software v3.1.1.
Graded amounts of rIL-4 and rIL-13 (Peprotech, Rocky Hill, NJ) were used to generate standard curves. The linear portion of the standard curve was used to calculate the concentration of cytokines in culture supernatants.
ETP maturation in vivo
HR−/−ETPs were isolated from CD45.2 13R−/− donor C57BL/6 mice, transduced with HR-RV or empty RV, cultured for 48 hours in stimulation DMEM cocktail medium and ETPs were stained with antibodies to Thy1.1 and IL-13Rα1. HR transduced ETPs sorted on the basis of IL-13Rα1 expression, were injected i.t. (5 × 10⁴ cells/mouse) into congenic CD45.1 HR+/+ C57BL/6 hosts. HR+ETPs sorted from CD45.2 HR+/+ mice were injected i.t. (5 × 10⁴ cells/mouse) into congenic CD45.1 HR+/+ C57BL/6 hosts and used as control. For inhibition of STAT1 activation the HR transduced ETPs were pre-treated with STAT1 inhibitor ( 5 μM) for 1 hour and injected into hosts which were given STAT1 inhibitor daily ( 40 mg/kg) for 5 days before transfer. The mice continued STAT1 inhibitor treatment daily for 10 days after transfer. Thymi were harvested at day 12 after intra-thymic transfer and CD45.2 cells were assessed for expression of CD11b, CD11c and CD8α.
Statistical Analysis
Data were analyzed using either an unpaired, two-tailed Student t-test, or one-way ANOVA as indicated. All statistical analyses were performed using Prism software version 4.0c (GraphPad).
Results
HR+ETPs give rise to CD11b and CD11c myeloid cells
In a prior study we reported that HR+ETPs cultured on OP9 stromal cells for a 3-day period of time give rise to CD11b but not CD11c myeloid cells (7). Since the kinetics of ETP maturation are flexible (4, 23, 24), we sought to extend the culture time and test the ETPs for maturation to CD11c in addition to CD11b myeloid cells. To this end, ETPs were sorted from HR+/+ mice and cultured on OP9 stromal cells for 7 instead of 3 days in the presence of GM-CSF or IL-7+Flt3L. The data show that while both culture conditions yielded maturation to CD11b+ and CD11b+CD11c+ cells, only the culture with IL-7+Flt3L gave rise to CD11b-CD11c+ cells which represent conventional DCs (cDCs) (Figure 1A). Because the HR on ETPs serves as a receptor through which both IL-4 and IL-13 can signal (8), we sought to determine whether the cytokines, like growth factors, can influence ETP maturation toward cDCs in addition to CD11b cells. Figure 1A shows that both IL-4 and IL-13, like IL-7+Flt3L, drive maturation toward CD11c cells in a significant manner relative to cultures with GM-CSF. The numbers of CD11c cells obtained from several experiments and shown on top of each quadrant agree with the cell percentages obtained from the same experiments (shown as bar graphs) that IL-4 and IL-13 like IL-7+Flt3L drive ETP commitment towards CD11c+ cells that are potentially cDCs (Fig. 1A). ETPs from HR+/+ mice comprise a small subset of bone derived HR-positive ETPs (HR+ETPs) which belong to the DN1c population and a major fraction of HR-negative ETPs which belong to DN1a,b,d,e populations (8). Because HR-ETPs from HR+/+ mice have the genetic potential for HR expression, they are referred to as HR-/PETPs while HR-ETPs from HR−/− mice are designated HR−/−ETPs. To ascertain that the HR influences ETP maturation to DCs we sorted both HR+ETPs and HR-/P populations and assayed for maturation in the presence of IL-4 and IL-13 cytokines. The data obtained from these experiments show that during a 7-day culture the HR+ETPs, while giving rise to CD11c+CD11b+ myeloid cells with GM-CSF or IL-7+Flt3L, shift their maturation towards discrete CD11b-CD11c+ cDCs with IL-4 and IL-13 cytokines (Fig. 1B). Such a shift did not occur with HR-/PETPs and maturation to CD11c cDCs was similar in all culture conditions (Fig. 1B). Note that the discrepancy seen with GM-CSF among total (Fig. 1A) and separated (Fig. 1B) ETPs could be explained by competition for the shared 10 ng GM-CSF in total ETP cultures. These findings are supported by the observations that the numbers of CD11c cDCs obtained from several experiments and shown on top of each quadrant agree with the cell percentages obtained from the same experiments (shown as bar graphs) (Fig. 1B). These results indicate that the HR plays a role in ETPs maturation to CD11c+ cDCs.
Figure 1. ETPs can give rise to both CD11b and CD11c myeloid cells.
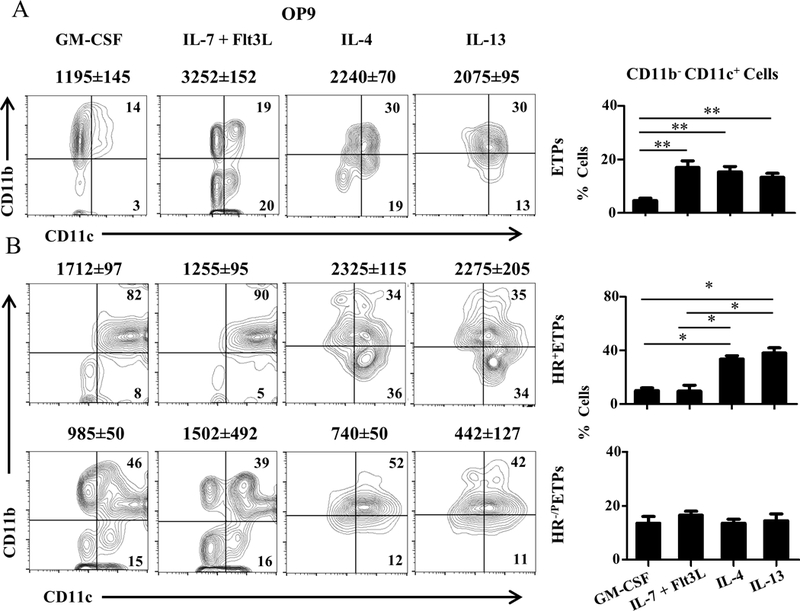
(A) Thymic cells from HR+/+ C57BL/6 mice were depleted of Lin+ cells and the Lin-CD4-CD8- cells were stained with antibodies to CD25, CD44 and c-Kit and ETPs were sorted as CD25-CD44+c-Kit+ cells and cultured on OP9 stromal cells for 7 days in the presence of the indicated growth factors, 10 ng/ml IL-4 or 20 ng/ml IL-13. Maturation into myeloid lineages was assessed by CD11b and CD11c expression on CD45+ and 7-AAD- cells to exclude stromal and dead cells. The contour plots show data from a representative experiment and the numbers within the quadrants indicate cell percentages. The bar graph shows results compiled from 4 independent experiments. The percent cells represent the mean ± SD for each population. **p<0.01 as analysed by one way ANOVA. The number on top of each contour plot represents the total number ± SD of CD11b-CD11c+ live cells at the end of the culture compiled from 4 independent experiments. (B) Thymic cells from HR+/+ IL-13Rα1-GFP reporter mice were depleted of Lin+ cells, stained with antibodies to CD25, CD44 and c-Kit and sorted as CD25-CD44+c-Kit+GFP+ (HR+ETPs) or CD25-CD44+c-Kit+GFP- (HR-/P) ETPs. The cells were then cultured on OP9 stromal cells as in (A). Maturation into myeloid lineages was assessed by CD11b and CD11c expression on CD45+ and 7-AAD- cells. The Contour plots show data from a representative experiment and the bar graphs show results compiled from 4 independent experiments. The percent cells represent the mean ± SD for each population. *p<0.05 as analysed by one way ANOVA. The number on top of each contour plot represents the total number ± SD of CD11b-CD11c+ live cells at the end of the culture compiled from 4 independent experiments.
HR+ETPs display increased STAT1 activation relative to HR-/P counterparts
The observation that the HR plays a role in ETP maturation to CD11c+ cDCs suggests that a signaling process is undertaken by its ligands IL-4 and IL-13 in vivo. Given that cytokine-driven STAT6 activation is rather involved with inhibition of maturation to the T-cell linage (8), it is possible that other STAT molecules play a role in the maturation towards CD11c+ cDCs. As previous reports suggested that the HR may signal through STAT1 and STAT3 to influence allergic reactions (17, 18) we sought to determine whether these transcription factors are involved in HR+ETP maturation towards CD11c+ cDCS. To this end, we began by analysing the ex vivo phosphorylation status of these transcription factors in HR+ETPs in comparison to HR-/PETPs. The results show that phosphorylation of STAT1Y701 is higher in HR+ETPs relative to HR-/PETPs like STAT6Y641 (Fig. 2A). This observation is supported by data compiled from several experiments as the difference in STAT1Y701 activation was statistically significant. There was no significant difference in STAT1S727 or STAT3S727, Y705 activation (Fig. 2A). These results suggest that STAT1Y701 activation may play a role in ETP commitment to CD11c+cDCs.
Figure 2. HR-driven STAT1 activation is independent of STAT6 phosphorylation.
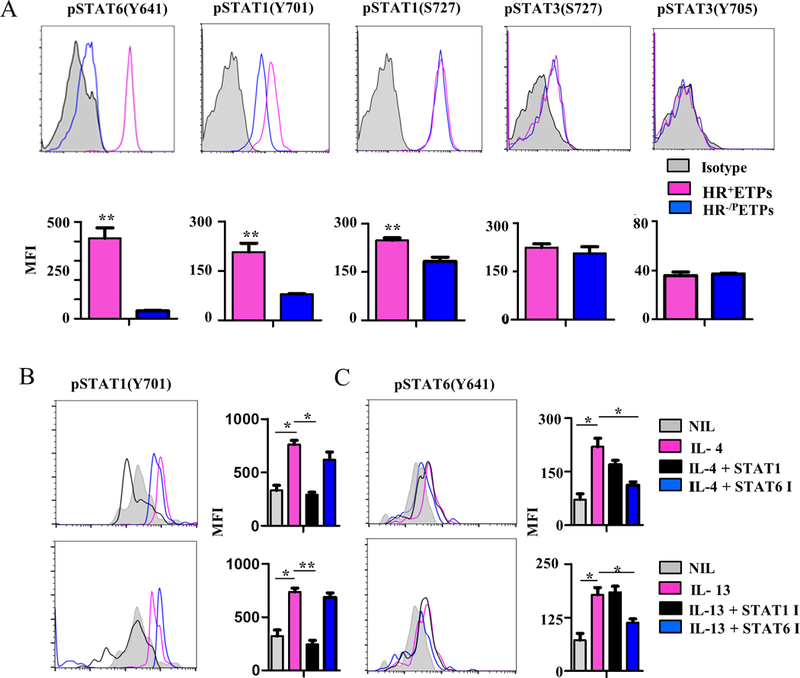
(A) Thymic cells from HR+/+ IL-13Rα1-GFP reporter mice were depleted of Lin+ cells and the Lin-CD4-CD8- cells were stained with antibodies to CD25, CD44, c-Kit, and intracellular pSTAT6(Y641), pSTAT1(Y701), pSTAT1(S727), pSTAT3 (S727) and pSTAT3 (Y705). The CD25-CD44+c-Kit+GFP+ (HR+ETPs) and CD25-CD44+c-Kit+GFP- (HR-/PETPs) were then analysed ex vivo for phosphorylation of STAT6, STAT1, and STAT3 at the indicated aa residues in comparison to isotype control for the corresponding anti-STAT antibody. The histograms show a representative experiment and the bar graphs show the mean ± SD MFI results compiled from 3 independent experiments. **p<0.01 as determined by two-tailed, unpaired Student’s t-test. (B, C) Thymic cells from HR−/− mice were depleted of Lin+ cells and the Lin-CD4-CD8- cells were stained with antibodies to CD25, CD44 and c-Kit, sorted as CD25-CD44+c-Kit+HR−/− ETPs, and transduced with HR-RV to drive HR expression. The cells were stained with anti-Thy1.1 and anti-IL-13Rα1 (marker for HR expression) and sorted as IL-13Rα1+Thy1.1+ cells. HR-RV transduced ETPs were cultured in the presence of 10ng/ml IL-4 alone (IL-4) or with STAT1 (IL-4 +STAT1 I) or STAT6 (IL-4 + STAT6 I) inhibitor. Similar culture conditions were used with 20 ng/ml IL-13 alone (IL-13) or with STAT1 (IL-13 + STAT1 I) or STAT6 (IL-13 + STAT6 I) inhibitor. Culture without cytokine or inhibitor (NIL) was included for control purposes. (B) STAT1 and ( C) STAT6 phosphorylation was analyzed after 1 hour incubation by flow cytometry. The histograms show representative experiments for STAT1 and STAT6 phosphorylation while the bar graphs show the mean ± SD MFI results compiled from three independent experiments. *p<0.05, **p<0.01 as determined by one-way ANOVA.
To determine whether cytokine signaling through the HR does indeed drive STAT1Y701 phosphorylation, the receptor was restored in HR−/−ETPs by IL-13Rα1 retroviral transduction as previously described (8), and the cells referred to as HR-RV ETPs were stimulated with IL-4 or IL-13 and assessed for STAT1 activation in comparison to STAT6Y641. The findings indicate that both IL-4 and IL-13 induce STAT1Y701 phosphorylation in HR−/−ETPs transduced with IL-13Rα1 in a significant manner (compare shaded to redline histograms or shaded to red bars) (Fig. 2B) as is the case for STAT6Y641 (Fig. 2C). In support of these observations is the data showing that addition of STAT1 inhibitor with either cytokine reduces STAT1Y701 phosphorylation significantly (Fig. 2B) as did STAT6 inhibitor for STAT6Y641 phosphorylation (Fig. 2C). Interestingly, STAT6 inhibitor did not interfere with STAT1Y701 phosphorylation (Fig. 2B) and STAT1 inhibitor had no effect on STAT6Y641 phosphorylation (Fig. 2C) indicating that the HR drives STAT1 activation independently of STAT6 signaling. Overall, IL-4 and IL-13 signaling through the HR induces activation of STAT1 signaling.
Dendritic cell -specific transcriptional factors are up-regulated in HR+ETPs
HR signaling in ETPs leads to STAT1 activation and enables maturation to CD11c+ cDCs in addition to CD11b+ myeloid cells. It is thus logical to postulate a tied relationship between STAT1 activation and ETP commitment towards the development of cDCs. This hypothesis stems from observations demonstrating that STAT1 activation leads to up-regulation of IRF-8 (25, 26), a transcription factor believed to be critical for differentiation of DCs and macrophages among other cells (27, 28). We then set up experiments to determine whether transcription factors usually critical for cDC differentiation from bone marrow precursors are upregulated in HR+ETPs and play a role in their maturation and the generation of thymic cDCs. To this end HR+ETPs were isolated and tested for the expression of markers associated with cDCs in comparison to HR-/P ETP counterparts. The results show that mRNA expression for RelB and Nfil3, transcription factors associated with CD11c+ cDCs (29, 30), is significantly upregulated in HR+ETPs relative to HR-/PETP (Fig. 3A). Moreover, Zbtb46 and IRF-8, transcription factors usually associated with CD11c+CD8α+ cDCs(27, 28, 31), and IRF-4, a marker for CD11c+CD4+ cDCs(27), are also significantly upregulated in HR+ETPs relative to HR-/PETPs (Fig. 3A). Note that PU.1, a marker for CD11b cells whether monocytes or DCs (32), is also up regulated in HR+ETPs while the B cell marker, Pax5 (33), is not. Similar results were observed at the protein level for these representative transcription factors (Fig. 3B). Interestingly, the upregulation of Zbtb46 and IRF-8 is remarkably higher both at the mRNA and protein levels, perhaps suggesting that HR-driven and STAT1-mediated ETP maturation favors the CD8α subset of CD11c+ cDC development. In all, the data suggest that HR-induced STAT1 activation is tied to upregulation of transcription factors associated with CD11c+ cDCs
Figure 3. HR+ETPs express dendritic cell-specific transcription factors.
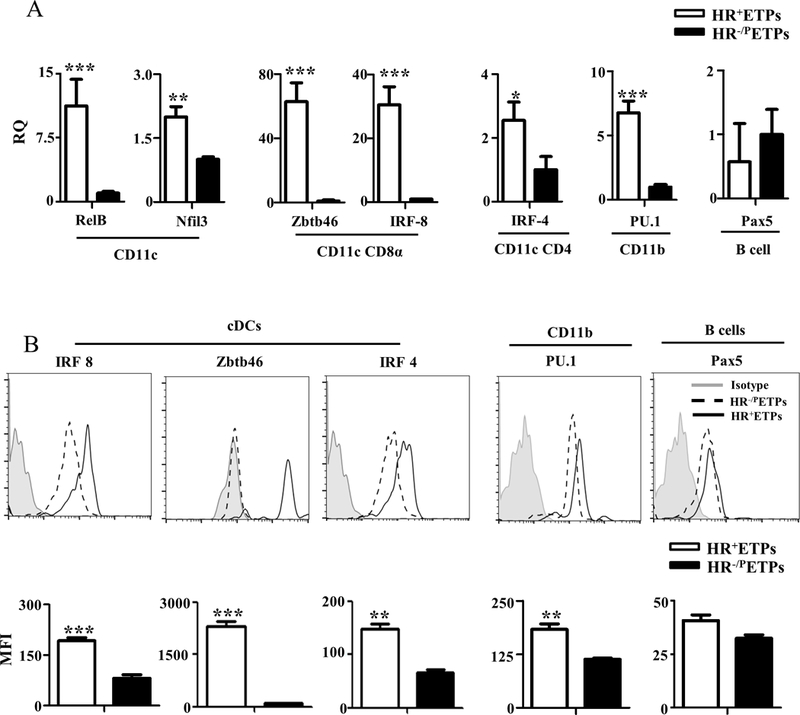
(A) Thymic cells from HR+/+ IL-13Rα1-GFP reporter mice were depleted of Lin+ cells, stained with antibodies to CD25, CD44 and c-Kit and sorted as CD25-CD44+c-Kit+GFP+ (HR+ETPs) or CD25-CD44+c-Kit+GFP- (HR-/PETPs) cells. RNA was isolated from both types of ETPS and mRNA for the indicated transcription factors was analysed by real-time PCR. The bar graphs show relative mRNA quantification (RQ) for transcription factors characteristic of the indicated subsets of cDCs, CD11b macrophages and B cells. (B) Thymic cells from HR+/+ IL-13Rα1-GFP reporter mice were depleted of Lin+ cells and the Lin-CD4-CD8- cells were stained with antibodies to CD25, CD44, c-Kit, and intracellular IRF8, Zbtb46, IFR4, PU.1 and Pax5. The CD25-CD44+c-Kit+GFP+ (HR+ETPs) and CD25-CD44+c-Kit+GFP- (HR-/PETPs) were then analysed for expression of the indicated factors at the protein level by flow cytometry. The histograms show representative experiments and the bar graphs show the mean ± SD MFI results compiled from 3 independent experiments. *p<0.05, **p<0.01, and ***p<0.001 as determined by two-tailed, unpaired Student’s t-test.
HR-driven STAT1 signaling controls IRF-8 expression in ETPs
To ensure that signaling through the HR is responsible for STAT1 activation and up-regulation of IRF-8 expression, HR−/−ETPs were transduced with HR-RV, treated with cytokines (IL-4 or IL-13) alone or in combination with STAT1 inhibitor and assessed for STAT1Y701 phosphorylation and IRF-8 expression. Initial experiments show that transduction with HR-RV, but not empty-RV, sustains IL-4 and IL-13 signaling leading to STAT1 activation and IRF-8 transcription (Fig. S1). Subsequently, HR-RV-transduced ETPs were used to determine whether inhibition of STAT1 activation diminishes IRF-8 transcription. The finding indicate that IL-4 induces STAT1 phosphorylation and IRF-8 expression while the control no cytokine (Nil) did not despite that the ETPs express the HR (Fig. 4A). Addition of STAT1 inhibitor to the culture nullified STAT1 phosphorylation and reduced IRF-8 expression (Fig. 4A). These results are significant as demonstrated by statistical analyses of data compiled from several experiments. The impact of STAT1 inhibitor on phosphorylation and IRF-8 expression is not due to off-target effect because cell survival was similar in all culture conditions (Fig. 4C). Similarly, IL-13 induces significant STAT1 phosphorylation and IRF-8 expression and these functions are also altered by STAT1 inhibitor (Fig. 4B) without any alteration in cell survival (Fig. 4C).
Figure 4. HR-driven STAT1 activation induces the expression of the cDC-specific transcription factor, IRF-8.
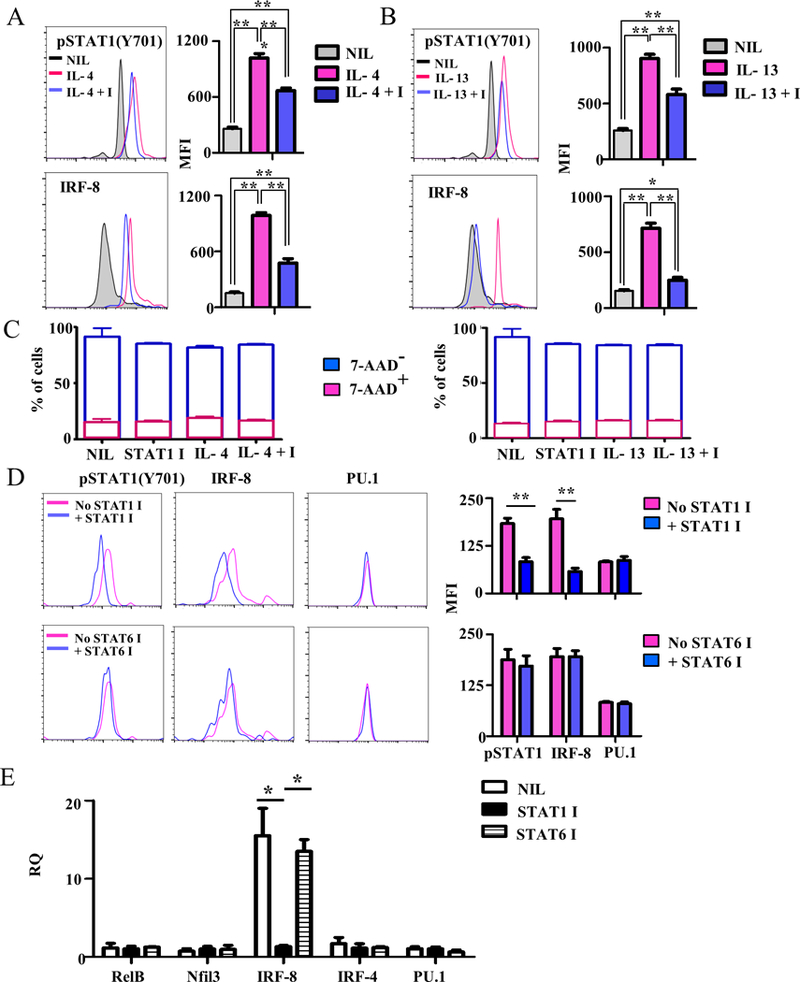
(A-C) thymic cells from HR−/− mice were depleted of Lin+ cells and the Lin-CD4-CD8- cells were stained with antibodies to CD25, CD44 and c-Kit, sorted as CD25-CD44+c-Kit+HR−/− ETPs, and transduced with HR-RV to drive HR expression. The cells were stained with anti-Thy1.1 and anti-IL-13Rα1 (marker for HR expression) and sorted as IL-13Rα1+Thy1.1+ cells. The HR-RV transduced ETPs were cultured in the presence of (A) 10ng/ml IL-4 alone (IL-4) or with STAT1 inhibitor (IL-4 + I) or (B) 20 ng/ml IL-13 alone (IL-13) or with STAT1 inhibitor (IL-13 + I). Subsequently, phosphorylation of STAT1 was analyzed after 1 hour while IRF-8 expression was measured after 24 hours. The histograms show a representative experiment while the bar graphs show the mean ± SD MFI results compiled from three independent experiments. *p<0.05 **p<0.01, and ***p<0.001 as determined by one-way ANOVA. (C) A sample of cells from A and B were stained with 7-AAD to assess for off target effects of the STAT inhibitors. STAT1 I alone was used as an additional control. The bars show the mean percent ± SD of cells staining negative ( blue) or positive (Red) for 7-AAD from 3 independent experiments. (D) HR+/+ IL-13Rα1-GFP reporter mice were given STAT1 inhibitor (STAT1 I) or, as a negative control, STAT6 inhibitor (STAT6 I) and the Lin-CD4-CD8- thymocytes were isolated by depletion of Lin+ cells using by MACS. The cells were then stained with antibodies to CD25, CD44, c-Kit, pSTAT1, IRF-8, and PU.1. The histograms show a representative experiment for STAT1 phosphorylation, IRF-8 and PU.1 expression by CD25-CD44+c-Kit+HR+(GFP+) ETPs. The bar graphs show the mean ± SD MFI results compiled from 3 independent experiments. **p<0.01 as determined by two-tailed, unpaired Student t-test. (E) HR+/+ IL-13Rα1-GFP reporter mice were given STAT1 or STAT6 inhibitor, and their thymic cells were depleted of Lin+ cells, stained with antibodies to CD25, CD44 and c-Kit and sorted as CD25-CD44+c-Kit+GFP+ (HR+ETPs). The cells were then analysed for mRNA expression of the indicated genes. The bar graph shows relative mRNA quantification (RQ) of data compiled from 2 independent experiments. **p<0.01 as determined by one way ANOVA.
To determine whether HR-induced STAT1 activation is involved in upregulation of DC-specific transcription factors in vivo, IL-13Rα1-GFP reporter mice were treated with STAT1 inhibitor and HR+ETPs were tested for phosphorylation of STAT1 and expression of IRF-8. The results indicate that when STAT1 activation is interfered with by STAT1 inhibitor, IRF-8 expression is downregulated (Fig. 4D). In vivo inhibition of STAT1 had no effect on the expression of the control PU.1 transcription factor. The control STAT6 inhibitor had no effect on STAT1 phosphorylation or IRF8 expression indicating that control of IRF-8 is specific to STAT1 (Fig. 4D). The effect of STAT1 activation on IRF8 expression is at the transcriptional level because mRNA expression of IRF-8 was drastically inhibited when mice were treated with STAT1 inhibitor. Indeed, STAT1 inhibitor significantly downregulated IRF-8 mRNA expression relative to mice that did not receive STAT1 inhibitor. This effect is specific to STAT1 as STAT6 inhibitor did not induce downregulation of IRF-8 mRNA transcription (Fig. 4E). Finally, STAT1 inhibition had no effect on mRNA expression of transcription factors such as RelB, NFil3, IRF-4 or PU.1, again indicating that STAT1 regulates IRF-8 specifically (Fig. 4E).
STAT1 activation can be triggered by IFNγ and IL-12 through IFNγR and IL-12R, respectively (26, 34). It is thus possible that STAT1 phosphorylation and the resulting IRF8 expression in ETPs is related to signaling by IFNγ or IL-12 in the microenvironment. To test this premise, HR-RV ETPs were stimulated with IFNγ or IL-12 and STAT1 phosphorylation as well as IRF-8 expression were measured in comparison to IL-4 and IL-13 controls. The data show that despite that the ETPs display mRNA expression for the chains of IFNγ and IL-12 receptors as compared to IL-27p28 (Fig. 5A), and there was protein expression of the inducible IFNγR1 and IL-12Rβ2 chains (Fig. 5B), neither cytokine induced up-regulation of STAT1 phosphorylation or IRF-8 expression in comparison to IL-4 or IL-13 (Fig. 5C).
Figure 5. STAT1 phosphorylation and IRF-8 expression in ETPs is not due to IFNɣ or IL-12 signaling.
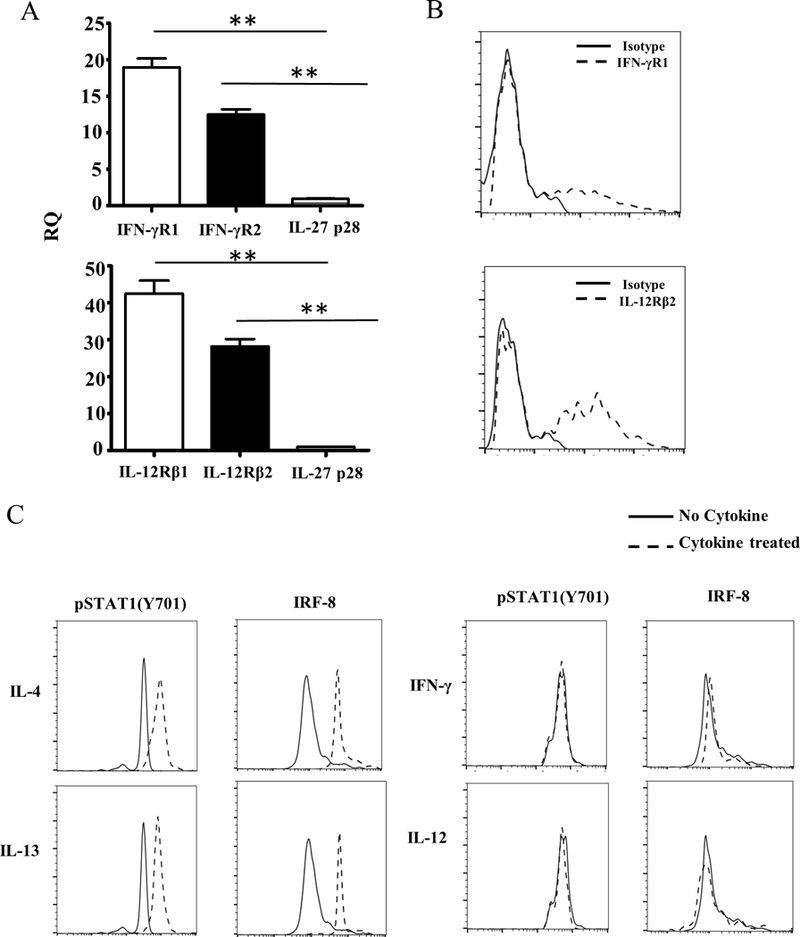
(A) Thymic cells from HR−/− mice were depleted of Lin+ cells and the Lin-CD4-CD8- cells were stained with antibodies to CD25, CD44 and c-Kit, sorted as CD25-CD44+c-Kit+HR−/− ETPs. RNA was then isolated and mRNA for the indicated cytokine receptor genes was analysed by real-time PCR. The bar graph shows the RQ values for IFNɣ and IL-12 receptors and IL-27p28 subunit genes normalized over GAPDH housekeeping gene. The bars represent the mean ± SD from 3 independent experiments. **p<0.01 as determined by one way ANOVA. (B) CD25-CD44+c-Kit+HR−/− ETPs were sorted as in (A) and stained with anti-IFNγR1 and IL-12Rβ2 antibodies (dashed histograms) in comparison to isotype control (solid histograms). (C) The CD25-CD44+c-Kit+HR−/− ETPs were transduced with HR-RV to drive HR expression and the cells were stained with anti-Thy1.1 and anti-IL-13Rα1 (marker for HR expression) and sorted as IL-13Rα1+Thy1.1+ cells. The HR-RV transduced ETPs were cultured in the presence of IL-4 (10 ng/ml), IL-13 (20 ng/ml), IFNγ (10 ng/ml) or IL-12 (10 ng/ml). Subsequently, phosphorylation of STAT1(Y701) was analyzed after 1 hour while IRF-8 expression was measured after 24 hours. The histograms show data from a representative experiment out of 3.
Overall, the findings indicate that HR-driven STAT1 signaling controls IRF-8 expression perhaps suggesting involvement in maturation of HR+ETPs towards the CD8α+ cDC lineage.
IL-4/IL-13 signaling through the HR drive ETPs maturation towards CD8α+ thymic resident DCs
IRF-8 is essential for the development of CD8α+ cDCs and mice deficient for this transcription factor display an impaired DC differentiation towards the CD8α+ DC subset (19). Given that STAT1 activation selectively up-regulates IRF-8 expression in HR+ETPs, it is likely that IL-4/IL-13 signaling which triggers STAT1 activation and the consequent IRF-8 upregulation fosters maturation of ETPs towards the thymic CD8α+ cDC subset among other myeloid cells. To test this premise, HR+ and HR-/PETPs were isolated, cultured on OP9 stromal cells in the presence of IL-4 or IL-13 and tested for maturation to CD8α+ cDCs. The findings indicate that both IL-4 and IL-13 support efficient maturation of HR+ETPs towards CD8α+CD11c+ cDCs (Fig. 6A). This effect is related to cytokine signaling through the HR as HR-/PETPs which do not express the HR give rise to little maturation towards CD8α+cCD11c+ cDCs. Indeed, HR+ETPs yielded 72–75% CD11b-CD11c+ cDCs which express CD8α whereas HR-/PETPs yielded much lower percentages of CD11b-CD11c+CD8α+ DCs (Fig. 6A). Data compiled from 3 independent experiments show that the mean numbers ± SD of CD11b-CD11c+CD8α+ DCs are significantly increased by the cytokines with HR+ETPs relative to HR-/PETPs (Fig. 6A, numbers on top of each quadrant). Furthermore, when the CD11b-CD11c+DCs were gated on CD8α+ and assessed for expression of SIRPα, there was minimal expression of this peripheral migratory DC marker (35, 36) (Fig. 6B) in comparison to CD11b-CD11c+CD4-CD8α+ splenic cDCs (Fig. 6C). Thus, HR signaling through STAT1 supports maturation of ETPs towards CD8α+SIRPα- cDCs. Moreover, analysis of SIRPα expression on thymic CD8α DCs in HR+/+ mice indicated that the CD11b-CD11c+CD4-CD8α+ cDCs display significantly lower expression of SIRPα relative to HR−/− mice (Fig. 6D). The frequency of these SIRPα-CD8α+ DCs is also significantly higher in HR+/+ relative to HR−/− mice (Fig. 6E). In all, HR signaling through STAT1 drives maturation of ETPs towards CD8α+SIRPα− DCs that reside in the thymus.
Figure 6. HR-driven STAT1 activation promotes ETP maturation into CD8α+ thymic resident DCs.
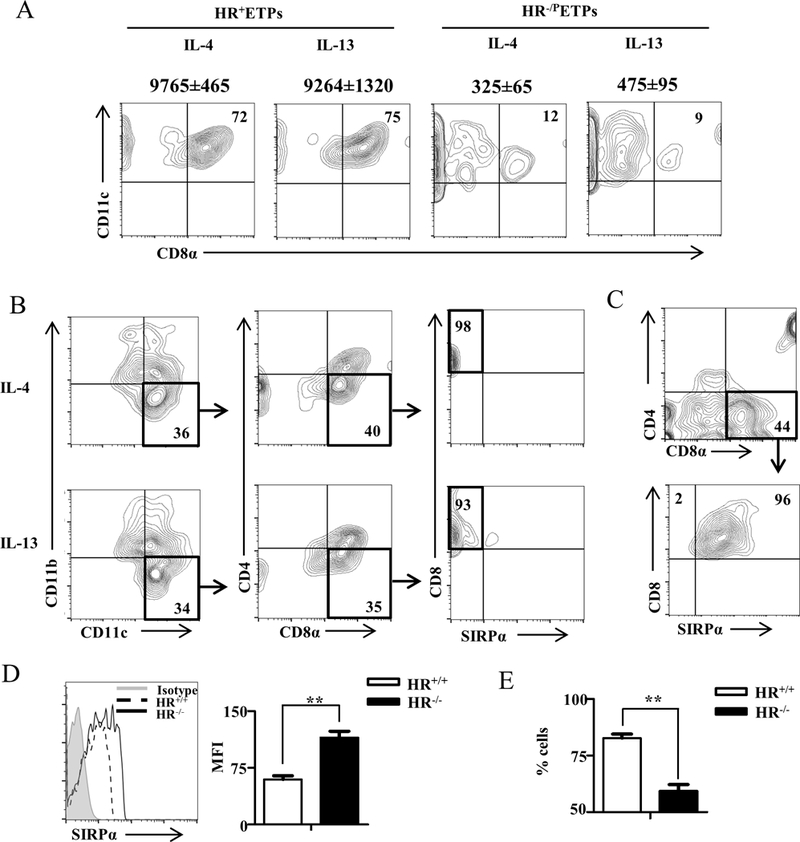
(A) Thymic cells from HR+/+IL-13Rα1-GFP reporter mice were depleted of Lin+ cells and the Lin-CD4-CD8- cells were stained with antibodies to CD25, CD44 and c-Kit. CD25-CD44+c-Kit+GFP+(HR+ETPs) and CD25-CD44+c-Kit+GFP- (HR-/PETPs) cells were cultured on OP9 stromal cells in the presence of the indicated cytokines for 7 days. The cultures were then stained with 7-AAD and antibodies to CD11b, CD11c, CD4, CD45, CD8α and SIRPα. Maturation into CD8α+ cDCs was assessed by measuring CD8α expression by cells gated as CD45+7-AAD-CD11b-CD11c+. The numbers in the upper right quadrant indicate the percentage of CD8α+CD11c+ cells. The number on top of each contour plot represents the total number ± SD of CD8α+CD11c+ live cells at the end of the culture compiled from 3 independent experiments. (B) HR+ETPs (Lin-CD4-CD8α-CD25-CD44+c-Kit+GFP+) were isolated from HR+/+IL-13Rα1-GFP reporter mice and cultured on OP9 stromal cells in the presence of 10ng/ml IL-4 or 20ng/ml IL-13 for 7 days. The cultures were then stained with 7-AAD and antibodies to CD11b, CD11c, CD4, CD45, CD8α and SIRPα. Maturation into CD8α+SIRPα- DCs was assessed on CD45+7-AAD-CD11b-CD11c+CD4- cells. The data is representative of 3 independent experiments. (C) Shows positive control splenic DCs staining for expression of SIRPα. The data is representative of 3 independent experiments. (D and E) Thymic cells from HR+/+ and HR−/− mice were stained with antibodies to CD11b, CD11c, CD4, CD8α and SIRPα expression was analysed on CD11b-CD11c+CD4-CD8α+ cDCs. (D) Shows a representative histogram data and a bar graph representing MFI ± SD compiled from 6 mice tested individually. (E) Shows the mean percent cells ± SD of CD11b-CD11c+CD4-CD8α+SIRPα- cDCs from 6 mice tested individually. **p<0.01 as determined by two-tailed, unpaired Student’s t-test.
In order for the HR to influence ETP maturation, IL-4 and IL-13 cytokines must be available in the thymus to trigger HR signaling. Cytokine detection assays were carried out and indicated that IL-4 and IL-13 mRNA levels in total thymic cells were significantly higher than IL-27p28 negative control mRNA (Fig. 7A). Furthermore, upon stimulation with PMA and ionomycin, the thymic cells secrete significant amounts of IL-4 and IL-13 cytokines (Fig. 7B). It is thus possible that the cytokines guide maturation of HR+ETPs towards CD8α+ cDCs in vivo. To test this premise, HR−/−ETPs from CD45.2 HR−/− mice were transduced with a retrovirus (RV) carrying IL-13Rα1 (HR-RV) which leads to expression of the HR or empty-RV which does not induce HR expression (8), and both HR-RV ETPs and empty-RV ETPs as well as control HR+ETP (from CD45.2 HR+/+) were transferred into CD45.1 HR+/+ mice and their maturation in vivo was evaluated. As indicated in Figure 7C the control HR+ETPs gave rise to CD11c+ cell most of which (65%) express the CD8α marker further conforming in vitro maturation data. However, while CD45.2 empty-RV ETPs gave rise to CD3+ T cells but no detectable CD11c+ or CD11c+CD8α+ DCs, the CD45.2 HR-RV ETPs, like the control HR+ETPs, had no detectable CD3+ T cells but gave rise CD11c+ cDCs (56%) most of which (78%) express the CD8α marker belonging to the CD11c+CD8α+ cDC subset (Fig. 7D). When the mice were given STAT1 inhibitor ETP maturation to CD11c+ and CD11c+CD8α+ cDCs decreased to 16.8 and 44%, respectively. Data compiled from 3 independent experiments show that STAT1 inhibitor significantly reduces the percentages (Fig. 7E) and cell number (Fig. 7F) of CD11c+ and CD11c+CD8α+ DCs relative to mice which did not receive STAT1 inhibitor. These results indicate that IL-4 and IL-13 in the thymic microenvironment signal through the HR and activate STAT1 which leads to ETP maturation towards the CD11c+CD8α+ DC subset.
Figure 7. Cytokine signaling through the HR drives in vivo ETP maturation towards CD8α+ thymic resident DCs.
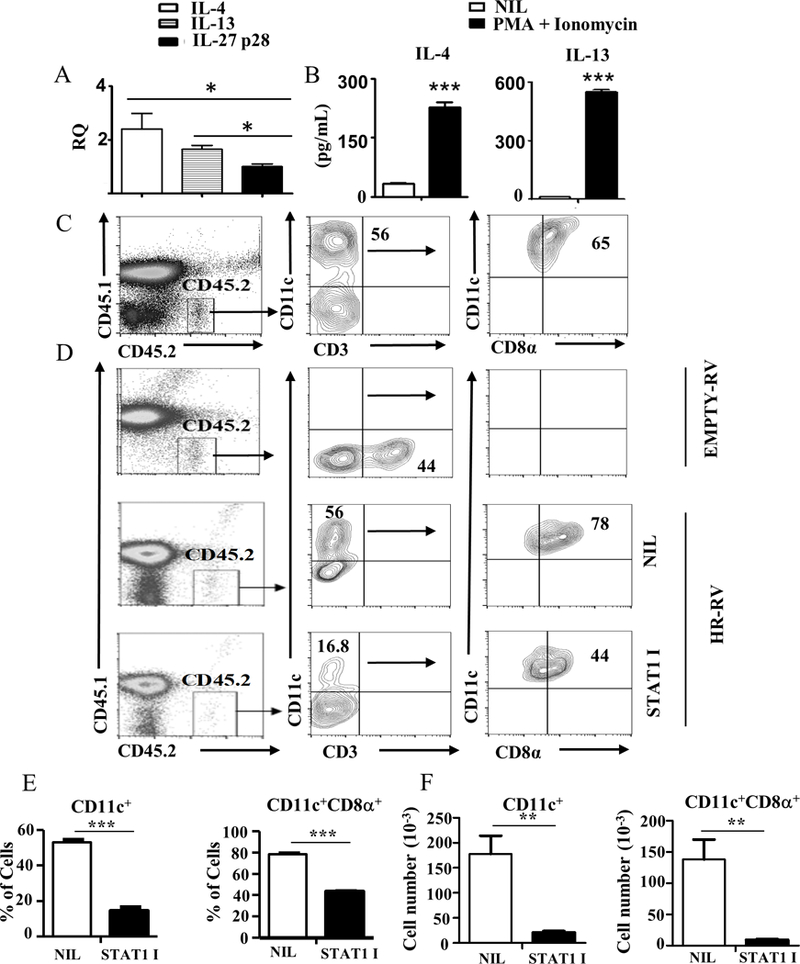
(A) mRNA expression of IL-4, IL-13 and IL-27p28 genes in thymic cells as determined by RT-PCR. The bars show the RQ values normalized over GAPDH housekeeping gene from 3 independent experiments. (B) Shows IL-4 and IL-13 secretion by thymic cells cultured without (Nil) or with PMA + Ionomycin for 6 hours as determined by ELISA. The bar graphs show the mean ± SD results compiled from 3 independent experiments. ***p<0.001 as determined by two-tailed, unpaired Students t-test. (C) Thymic cells from HR+/+ CD45.2 mice were depleted of Lin+ cells and the Lin-CD4-CD8- cells were stained with antibodies to CD25, CD44 and c-Kit, and sorted as CD25-CD44+c-Kit+ GFP+ (HR+) ETPs. These HR+ETPs were injected (50 × 103 cell per mouse) i.t. into CD45.1 HR+/+ mice. Thymic cells were then harvested on day 16 post transfer and maturation of CD45.2 ETPs to CD11c and CD8α cDCs was assessed by flow cytometry. The number within the quadrant represents cell percentages. This is representative of 3 experiments. (D) Thymic cells from HR−/− CD45.2 mice were depleted of Lin+ cells and the Lin-CD4-CD8- cells were stained with antibodies to CD25, CD44 and c-Kit, and sorted as CD25-CD44+c-Kit+HR−/− ETPs (HR−/− ETPs). The cells were then transduced with HR-RV or empty-RV, stained with anti-Thy1.1 and anti-IL-13Rα1 (marker for HR expression) antibodies, sorted as IL-13Rα1+Thy1.1+ (HR-RV ETPs) or IL-13Rα1-Thy1.1+ (Empty-RV ETPs) cells. Empty-RV ETPs and HR-RV ETPs were injected i.t. into CD45.1 HR+/+ mice. The mice recipient of HR-RV ETP were divided into 2 groups one of which was not given STAT1 inhibitor (NIL) and the other was given STAT1 inhibitor daily for 16 days (STAT1 I). Thymic cells were then harvested and maturation of CD45.2 ETPs to CD11c and CD8α cDCs was assessed by flow cytometry. The contour plots show data from a representative experiment out of 3. The number within the quadrant represents cell percentages. (E,F) Show the percentage (E) and number (F) of CD11c+ and CD11c+CD8α+ cells for the HR-RV (NIL) and STAT1 I groups compiled from 3 independent experiments. The data represent the mean ± SD for each population. **p<0.01 ***p<0.001 as analysed by unpaired student t-test.
Discussion
Here it is shown that ETPs expressing the HR give rise to myeloid cells which express the cDC marker, CD11c, in addition to cells expressing the CD11b monocyte/Mφ marker. The maturation of HR+ETPs to CD11c+ cDCs is tied to STAT1 activation and up-regulation of IRF-8, a transcription factor required for the development of CD8α+CD11c+ cDCs (27, 28). In fact, the HR+ETP-derived CD11c+ cDCs also express the CD8α marker. However, while the BM-derived peripheral CD8α+CD11c+ cDCs up-regulate SIRPα, a type I transmembrane receptor involved in DC maturation and migration (36, 37), the ETP-derived CD8α+CD11c+ cDCs do not. The lack of SIRPα migratory marker perhaps confines the ETP-derived CD8α+CD11c+ cDCs to reside in the thymus.
In a previous study, we have shown that IL-4/IL-13 signaling through the HR activates STAT6 transcription factor which inhibits maturation of HR+ETP towards the T cell lineage but enacts commitment to the myeloid lineage (8). Though, STAT6 activation does not seem to be responsible for maturation of HR+ETPs towards CD8α+CD11c+SIRPα- cDCs because STAT1, but not STAT6 inhibitor, nullifies ETP commitment towards CD8α+CD11c+ cDCs both in vitro and in vivo. STAT1-driven generation of thymic resident CD8α+CD11c+ cDCs is also the result of cytokine signaling through the HR. This statement is supported by observations showing that HR+ETPs can be stimulated with IL-4 and IL-13 to commit to CD8α+CD11c+ cDCs. More importantly, when HR-ETPs, rendered HR-positive by means of HR-RV transduction, were transferred into HR+/+ mice, they were able to give rise to CD8α+CD11c+ cDCs in a STAT1-dependent manner. Thus, IL-4 and IL-13 seem to utilize the HR to guide lineage commitment by both STAT6 (8) and STAT1 activation. In fact, both IL-4 and IL-13 are readily available in the thymus and may be produced by type 2 innate lymphoid cells (ILC2) (38) generated from DN1/DN2 thymocytes (13, 39) as well as NKT cells which also arise in the thymus (40). The HR and its ligands IL-4 and IL-13 may provide a means by which the thymic microenvironment shapes lineage commitment and ETP fate decision (41, 42).
Prior studies suggested that IL-7Rα increases survival and sustains progenitor commitment to lymphoid lineages (6, 43). This function is perhaps independent of STAT1 and STAT6 as it must preserve Notch1 expression and overcome IRF-8 transcription to sustain lymphoid fate decision. This raises the possibility that IL-7Rα and the HR operate through distinct signaling pathways to reinforce lineage commitment. Though, the question remains open as to the signaling pathway used by IL-2Rβ to sustain infidelity among T cell progenitors which guides commitment towards the myeloid lineage (3). Also, the findings raise another question as to whether cytokines and their receptors serve to assist ETPs in lineage fate decision and transit from multipotent (4, 5) to unipotent (6, 7) status.
From a functional perspective, since CD8α+ cDCs play a critical role in thymic negative T cell selection (44, 45), it is possible that the ETP-derived thymic resident CD8α+ cDCs would contribute to T cell selection and the shaping of the T cell repertoire and would determine whether IL-4 and IL-13 and their HR impact T cell tolerance and the development of autoimmunity. If this proves to be the case it would extend the role the HR plays in the immune system beyond its involvement in allergic reactions (12, 13) and neonatal immunity (14, 15).
Supplementary Material
Acknowledgments
Funding. This work was supported by grant RO1 NS057194 (to H.Z.) from the National Institutes of Health. M.M.M. was supported by T32 Training Grant GM008396 from the National Institute of General Medical Sciences.
Abbreviations:
- 7-AAD
7-aminoactinomycin D
- BM
bone marrow
- cDCs
conventional dendritic cells
- ETP
early thymic progenitors
- HR
IL-4Rα/IL-13Rα1 heteroreceptor
- Lin
lineage
References
- 1.Wu L, Antica M, Johnson GR, Scollay R, and Shortman K, 1991. Developmental potential of the earliest precursor cells from the adult mouse thymus. J Exp Med 174: 1617–1627. [DOI] [PMC free article] [PubMed] [Google Scholar]
- 2.Allman D, Sambandam A, Kim S, Miller JP, Pagan A, Well D, Meraz A, and Bhandoola A, 2003. Thymopoiesis independent of common lymphoid progenitors. Nat Immunol 4: 168–174. [DOI] [PubMed] [Google Scholar]
- 3.King AG, Kondo M, Scherer DC, and Weissman IL, 2002. Lineage infidelity in myeloid cells with TCR gene rearrangement: a latent developmental potential of proT cells revealed by ectopic cytokine receptor signaling. Proc Natl Acad Sci U S A 99: 4508–4513. [DOI] [PMC free article] [PubMed] [Google Scholar]
- 4.Bell JJ, and Bhandoola A, 2008. The earliest thymic progenitors for T cells possess myeloid lineage potential. Nature 452: 764–767. [DOI] [PubMed] [Google Scholar]
- 5.Wada H, Masuda K, Satoh R, Kakugawa K, Ikawa T, Katsura Y, and Kawamoto H, 2008. Adult T-cell progenitors retain myeloid potential. Nature 452: 768–772. [DOI] [PubMed] [Google Scholar]
- 6.Schlenner SM, Madan V, Busch K, Tietz A, Laufle C, Costa C, Blum C, Fehling HJ, and Rodewald HR, 2010. Fate mapping reveals separate origins of T cells and myeloid lineages in the thymus. Immunity 32: 426–436. [DOI] [PubMed] [Google Scholar]
- 7.Haymaker CL, Guloglu FB, Cascio JA, Hardaway JC, Dhakal M, Wan X, Hoeman CM, Zaghouani S, Rowland LM, Tartar DM, VanMorlan AM, and Zaghouani H, 2012. Bone marrow-derived IL-13Ralpha1-positive thymic progenitors are restricted to the myeloid lineage. J Immunol 188: 3208–3216. [DOI] [PMC free article] [PubMed] [Google Scholar]
- 8.Barik S, Miller MM, Cattin-Roy AN, Ukah TK, Chen W, and Zaghouani H, 2017. IL-4/IL-13 Signaling Inhibits the Potential of Early Thymic Progenitors To Commit to the T Cell Lineage. J Immunol 199: 2767–2776. [DOI] [PMC free article] [PubMed] [Google Scholar]
- 9.Sambandam A, Maillard I, Zediak VP, Xu L, Gerstein RM, Aster JC, Pear WS, and Bhandoola A, 2005. Notch signaling controls the generation and differentiation of early T lineage progenitors. Nat Immunol 6: 663–670. [DOI] [PubMed] [Google Scholar]
- 10.Luche H, Ardouin L, Teo P, See P, Henri S, Merad M, Ginhoux F, and Malissen B, 2011. The earliest intrathymic precursors of CD8alpha(+) thymic dendritic cells correspond to myeloid-type double-negative 1c cells. Eur J Immunol 41: 2165–2175. [DOI] [PMC free article] [PubMed] [Google Scholar]
- 11.Krueger A 2011. A missing link in thymic dendritic cell development. Eur J Immunol 41: 2145–2147. [DOI] [PubMed] [Google Scholar]
- 12.Ramalingam TR, Pesce JT, Sheikh F, Cheever AW, Mentink-Kane MM, Wilson MS, Stevens S, Valenzuela DM, Murphy AJ, Yancopoulos GD, Urban JF Jr., Donnelly RP, and Wynn TA, 2008. Unique functions of the type II interleukin 4 receptor identified in mice lacking the interleukin 13 receptor alpha1 chain. Nat Immunol 9: 25–33. [DOI] [PMC free article] [PubMed] [Google Scholar]
- 13.Halim TY, Hwang YY, Scanlon ST, Zaghouani H, Garbi N, Fallon PG, and McKenzie AN, 2016. Group 2 innate lymphoid cells license dendritic cells to potentiate memory TH2 cell responses. Nat Immunol 17: 57–64. [DOI] [PMC free article] [PubMed] [Google Scholar]
- 14.Li L, Lee HH, Bell JJ, Gregg RK, Ellis JS, Gessner A, and Zaghouani H, 2004. IL-4 utilizes an alternative receptor to drive apoptosis of Th1 cells and skews neonatal immunity toward Th2. Immunity 20: 429–440. [DOI] [PubMed] [Google Scholar]
- 15.Dhakal M, Miller MM, Zaghouani AA, Sherman MP, and Zaghouani H, 2015. Neonatal Basophils Stifle the Function of Early-Life Dendritic Cells To Curtail Th1 Immunity in Newborn Mice. J Immunol 195: 507–518. [DOI] [PMC free article] [PubMed] [Google Scholar]
- 16.Dhakal M, Hardaway JC, Guloglu FB, Miller MM, Hoeman CM, Zaghouani AA, Wan X, Rowland LM, Cascio JA, Sherman MP, and Zaghouani H, 2014. IL-13Ralpha1 is a surface marker for M2 macrophages influencing their differentiation and function. Eur J Immunol 44: 842–855. [DOI] [PMC free article] [PubMed] [Google Scholar]
- 17.Wills-Karp M, and Finkelman FD, 2008. Untangling the complex web of IL-4- and IL-13-mediated signaling pathways. Sci Signal 1: pe55. [DOI] [PMC free article] [PubMed] [Google Scholar]
- 18.Bhattacharjee A, Shukla M, Yakubenko VP, Mulya A, Kundu S, and Cathcart MK, 2013. IL-4 and IL-13 employ discrete signaling pathways for target gene expression in alternatively activated monocytes/macrophages. Free Radic Biol Med 54: 1–16. [DOI] [PMC free article] [PubMed] [Google Scholar]
- 19.Schiavoni G, Mattei F, Sestili P, Borghi P, Venditti M, Morse HC 3rd, Belardelli F, and Gabriele L, 2002. ICSBP is essential for the development of mouse type I interferon-producing cells and for the generation and activation of CD8alpha(+) dendritic cells. J Exp Med 196: 1415–1425. [DOI] [PMC free article] [PubMed] [Google Scholar]
- 20.Barik S, Ellis JS, Cascio JA, Miller MM, Ukah TK, Cattin-Roy AN, and Zaghouani H, 2017. IL-4/IL-13 Heteroreceptor Influences Th17 Cell Conversion and Sensitivity to Regulatory T Cell Suppression To Restrain Experimental Allergic Encephalomyelitis. J Immunol 199: 2236–2248. [DOI] [PMC free article] [PubMed] [Google Scholar]
- 21.Schmitt TM, and Zuniga-Pflucker JC, 2002. Induction of T cell development from hematopoietic progenitor cells by delta-like-1 in vitro. Immunity 17: 749–756. [DOI] [PubMed] [Google Scholar]
- 22.Wan X, Guloglu FB, VanMorlan AM, Rowland LM, Jain R, Haymaker CL, Cascio JA, Dhakal M, Hoeman CM, Tartar DM, and Zaghouani H, 2012. Mechanisms underlying antigen-specific tolerance of stable and convertible Th17 cells during suppression of autoimmune diabetes. Diabetes 61: 2054–2065. [DOI] [PMC free article] [PubMed] [Google Scholar]
- 23.Lyszkiewicz M, Zietara N, Fohse L, Puchalka J, Diestelhorst J, Witzlau K, Prinz I, Schambach A, and Krueger A, 2015. Limited niche availability suppresses murine intrathymic dendritic-cell development from noncommitted progenitors. Blood 125: 457–464. [DOI] [PubMed] [Google Scholar]
- 24.Kueh HY, Yui MA, Ng KK, Pease SS, Zhang JA, Damle SS, Freedman G, Siu S, Bernstein ID, Elowitz MB, and Rothenberg EV, 2016. Asynchronous combinatorial action of four regulatory factors activates Bcl11b for T cell commitment. Nat Immunol 17: 956–965. [DOI] [PMC free article] [PubMed] [Google Scholar]
- 25.Chen G, Tan CS, Teh BK, and Lu J, 2011. Molecular mechanisms for synchronized transcription of three complement C1q subunit genes in dendritic cells and macrophages. J Biol Chem 286: 34941–34950. [DOI] [PMC free article] [PubMed] [Google Scholar]
- 26.Li HS, Gelbard A, Martinez GJ, Esashi E, Zhang H, Nguyen-Jackson H, Liu YJ, Overwijk WW, and Watowich SS, 2011. Cell-intrinsic role for IFN-alpha-STAT1 signals in regulating murine Peyer patch plasmacytoid dendritic cells and conditioning an inflammatory response. Blood 118: 3879–3889. [DOI] [PMC free article] [PubMed] [Google Scholar]
- 27.Tamura T, Tailor P, Yamaoka K, Kong HJ, Tsujimura H, O’Shea JJ, Singh H, and Ozato K, 2005. IFN regulatory factor-4 and −8 govern dendritic cell subset development and their functional diversity. J Immunol 174: 2573–2581. [DOI] [PubMed] [Google Scholar]
- 28.Wang H, Yan M, Sun J, Jain S, Yoshimi R, Abolfath SM, Ozato K, Coleman WG Jr., Ng AP, Metcalf D, DiRago L, Nutt SL, and Morse HC 3rd, 2014. A reporter mouse reveals lineage-specific and heterogeneous expression of IRF8 during lymphoid and myeloid cell differentiation. J Immunol 193: 1766–1777. [DOI] [PMC free article] [PubMed] [Google Scholar]
- 29.Shih VF, Davis-Turak J, Macal M, Huang JQ, Ponomarenko J, Kearns JD, Yu T, Fagerlund R, Asagiri M, Zuniga EI, and Hoffmann A, 2012. Control of RelB during dendritic cell activation integrates canonical and noncanonical NF-kappaB pathways. Nat Immunol 13: 1162–1170. [DOI] [PMC free article] [PubMed] [Google Scholar]
- 30.Murphy TL, Grajales-Reyes GE, Wu X, Tussiwand R, Briseno CG, Iwata A, Kretzer NM, Durai V, and Murphy KM, 2016. Transcriptional Control of Dendritic Cell Development. Annu Rev Immunol 34: 93–119. [DOI] [PMC free article] [PubMed] [Google Scholar]
- 31.Satpathy AT, Kc W, Albring JC, Edelson BT, Kretzer NM, Bhattacharya D, Murphy TL, and Murphy KM, 2012. Zbtb46 expression distinguishes classical dendritic cells and their committed progenitors from other immune lineages. J Exp Med 209: 1135–1152. [DOI] [PMC free article] [PubMed] [Google Scholar]
- 32.Anderson KL, Perkin H, Surh CD, Venturini S, Maki RA, and Torbett BE, 2000. Transcription factor PU.1 is necessary for development of thymic and myeloid progenitor-derived dendritic cells. J Immunol 164: 1855–1861. [DOI] [PubMed] [Google Scholar]
- 33.Cobaleda C, Schebesta A, Delogu A, and Busslinger M, 2007. Pax5: the guardian of B cell identity and function. Nat Immunol 8: 463–470. [DOI] [PubMed] [Google Scholar]
- 34.Yang Y, Ochando JC, Bromberg JS, and Ding Y, 2007. Identification of a distant T-bet enhancer responsive to IL-12/Stat4 and IFNgamma/Stat1 signals. Blood 110: 2494–2500. [DOI] [PMC free article] [PubMed] [Google Scholar]
- 35.Li J, Park J, Foss D, and Goldschneider I, 2009. Thymus-homing peripheral dendritic cells constitute two of the three major subsets of dendritic cells in the steady-state thymus. J Exp Med 206: 607–622. [DOI] [PMC free article] [PubMed] [Google Scholar]
- 36.Raymond M, Van VQ, Rubio M, Welzenbach K, and Sarfati M, 2010. Targeting SIRP-alpha protects from type 2-driven allergic airway inflammation. Eur J Immunol 40: 3510–3518. [DOI] [PubMed] [Google Scholar]
- 37.Braun D, Galibert L, Nakajima T, Saito H, Quang VV, Rubio M, and Sarfati M, 2006. Semimature stage: a checkpoint in a dendritic cell maturation program that allows for functional reversion after signal-regulatory protein-alpha ligation and maturation signals. J Immunol 177: 8550–8559. [DOI] [PubMed] [Google Scholar]
- 38.Walker JA, Barlow JL, and McKenzie AN, 2013. Innate lymphoid cells--how did we miss them? Nat Rev Immunol 13: 75–87. [DOI] [PubMed] [Google Scholar]
- 39.Wong SH, Walker JA, Jolin HE, Drynan LF, Hams E, Camelo A, Barlow JL, Neill DR, Panova V, Koch U, Radtke F, Hardman CS, Hwang YY, Fallon PG, and McKenzie AN, 2012. Transcription factor RORalpha is critical for nuocyte development. Nat Immunol 13: 229–236. [DOI] [PMC free article] [PubMed] [Google Scholar]
- 40.Lee YJ, Holzapfel KL, Zhu J, Jameson SC, and Hogquist KA, 2013. Steady-state production of IL-4 modulates immunity in mouse strains and is determined by lineage diversity of iNKT cells. Nat Immunol 14: 1146–1154. [DOI] [PMC free article] [PubMed] [Google Scholar]
- 41.Rothenberg EV 2007. Negotiation of the T lineage fate decision by transcription-factor interplay and microenvironmental signals. Immunity 26: 690–702. [DOI] [PubMed] [Google Scholar]
- 42.Petrie HT, and Zuniga-Pflucker JC, 2007. Zoned out: functional mapping of stromal signaling microenvironments in the thymus. Annu Rev Immunol 25: 649–679. [DOI] [PubMed] [Google Scholar]
- 43.Akashi K, Kondo M, von Freeden-Jeffry U, Murray R, and Weissman IL, 1997. Bcl-2 rescues T lymphopoiesis in interleukin-7 receptor-deficient mice. Cell 89: 1033–1041. [DOI] [PubMed] [Google Scholar]
- 44.Atibalentja DF, Murphy KM, and Unanue ER, 2011. Functional redundancy between thymic CD8alpha+ and Sirpalpha+ conventional dendritic cells in presentation of blood-derived lysozyme by MHC class II proteins. J Immunol 186: 1421–1431. [DOI] [PMC free article] [PubMed] [Google Scholar]
- 45.Perry JS, Lio CW, Kau AL, Nutsch K, Yang Z, Gordon JI, Murphy KM, and Hsieh CS, 2014. Distinct contributions of Aire and antigen-presenting-cell subsets to the generation of self-tolerance in the thymus. Immunity 41: 414–426. [DOI] [PMC free article] [PubMed] [Google Scholar]
Associated Data
This section collects any data citations, data availability statements, or supplementary materials included in this article.