

Abstract
The aim of this study was to investigate the role of the mitogen-activated protein kinase kinase-extracellular signal-regulated kinases 1/2 (MEK-ERK1/2) signaling pathway in chondrocyte differentiation and cartilage tissue construction in vitro. Chondrocytes were stimulated with rat serum (RS) and fetal bovine serum (FBS), and chondrocyte phenotypes were investigated microscopically. Chondrocyte proliferation was analyzed using fluorescence activated cell sorting (FACS) and the CCK8 method. Protein and mRNA expressions were assessed by western blot and RT-qPCR. Constructed cartilage tissues were examined by Safranin O-Fast Green FCF staining and immunofluorescence. In contrast to FBS, RS induced rapid dedifferentiation of chondrocytes and decreased type II collagen expression and proteoglycan synthesis. ERK1/2 and type I collagen expression increased during dedifferentiation and decreased during redifferentiation. Increased MEK-ERK1/2 pathway activity resulted in chondrocyte dedifferentiation, and inhibition of ERK1/2 by the inhibitor PD0325901 reversed dedifferentiation and led to redifferentiation. These data suggest strongly that inhibition of MEK-ERK1/2 activation prevents chondrocyte dedifferentiation and fibrocartilage formation.
Keywords: MEK-ERK1/2 pathway, dedifferentiation and redifferentiation, fibrocartilage and hyaline cartilage, ECM, chondrocytes
Introduction
Cartilage reconstruction is essential to repair defects in articular joints in the head and the neck [1]. Mesenchymal stem cells (MSCs) are used for articular cartilage tissue engineering despite the existence of some problems, for example, it is difficult to obtain a high percentage of chondrocytes from differentiated MSCs [2]. Because large human articular cartilage defects cannot be repaired by the proliferation of resident chondrocytes, there is an acute clinical need for the generation of native tissues to serve as autologous grafts. Autologous chondrocytes may be an ideal resource for cartilage tissue reconstruction because autologous chondrocytes are easily obtained from enzymatic digests of small articular cartilage biopsies. But the number of autologous chondrocytes that can be obtained is limited and they must be serially passaged to obtain a sufficient number of cells. During in vitro expansion, chondrocytes usually lose their phenotype (dedifferentiate) and become fibroblast-like chondrocytes that produce fewer glycosaminoglycans (GAGs), have decreased type II collagen production, and are unable to form articular cartilage tissue [3]. Additionally, chondrocytes gradually lose their proliferation capacity during cell culture. To tissue engineer autologous cartilage, the problems that need to be solved are how to obtain sufficient numbers of chondrocytes, maintain their phenotype, and induce them to express the required genes.
Upon culture in serum-free media with insulin like growth factor I (IGF-I) and transforming growth factor beta-2 (TGFβ-2), chondrocytes showed more type II collagen expression and more GAG production than cells expanded in medium supplemented with 10% serum. However, chondrocytes expanded in serum-free medium supplemented with fibroblast growth factor 2 (FGF2) resulted in fewer cells expressing type I collagen and 11-fibrau (a fibroblast membrane marker) [4,5]. A reduction in fibroblastic cell outgrowths on the surfaces of chondrocytes was observed under low serum/ITS culture conditions, and the formation of fibrous capsules was observed at high fetal bovine serum (FBS) concentrations. The amount of fibrous tissue on the outer surfaces of chondrocytes correlated with the concentration of FBS in the media [6]. In addition, expression of specific cartilage extracellular matrix (ECM) molecules and GAG expression were reduced in chondrocytes cultured in FBS [7]. Moreover, it has been difficult to maintain the mechanical properties of explants in serum-supplemented media [8]. Nevertheless, some studies have reported that FBS is beneficial to type II collagen deposition because it inhibits the activity of collagenases, such as MMP13 [9,10]. The effects and underlying mechanisms of sera in chondrocyte culture remain unknown.
Activation of the mitogen-activated protein kinase (MAPK) pathway, which includes MEK-ERK1/2, JNK, and p38 MAPK, has been detected in chondrocytes [11]. Activated extracellular signal-regulated kinase (ERK) was detected primarily in hypertrophic chondrocytes and suppression of ERK activation by an MEK inhibitor caused a delay in maturation of hypertrophic chondrocytes [12]. Furthermore, inhibition of MEK signaling influenced chondrocyte hypertrophy, reduced matrix turnover, and inhibited fracture healing [13], and inhibitors of p38 MAPK inhibited MMP13 expression [14]. Inhibition of the p38 MAPK pathway downregulated chondrogenic gene expression and increased hypertrophic gene expression in normal chondrocytes [15]. In cultured murine cartilage and human chondrocytes stimulated with IL-1β, JNK-2 regulated aggrecan (A-can) degradation [16,17].
Recently, we found that rat serum (RS) induced chondrocyte metabolism more than FBS, and the aim of this study was to determine how RS promoted chondrocyte catabolism. We used a conventional serum-containing medium (10% FBS) as a control when investigating the effects of RS and FBS on chondrocyte cell morphology, gene expression, and cell proliferation. RS increased catabolism by increasing expression of matrix metalloproteinases (MMPs) and a disintegrin and metalloproteinase with thrombospondin motifs 5 (ADAMTS5) and by increasing degradation of the ECM, including type II collagen and proteoglycans. Fibroblast-like cells, which were derived from chondrocytes cultured in RS, were efficiently redifferentiated into the normal chondrocyte phenotype upon treatment with an MEK inhibitor. The gene expression alterations in the RS-treated cells were also reversed to normal levels by inhibition of the MEK-ERK1/2 pathway. Further, the MEK inhibitor inhibited proliferation, which was promoted by RS. These results suggest that activation of MEK-ERK1/2 promotes chondrocyte metabolism and proliferation.
Materials and methods
Cell and tissue culture
Chondrocytes were isolated from the articular cartilage of 24-hour-old Sprague-Dawley (SD) rats and dispersed in 0.1% collagenase type II (C6885, Sigma-Aldrich, Switzerland) for 3 h. Chondrocytes were collected and cultured in Dulbecco’s Modified Eagle’s Medium (DMEM, Biowest, France) supplemented with 10% FBS (Biowest, France) and 1% penicillin-streptomycin. Chondrocytes from passages 1 and 2 were used in all of the experiments.
RS preparation
Male breeder rats at 2-3 months of age were intraperitoneally anesthetized with 50 mg/kg sodium pentobarbital. Anesthetization was confirmed by checking for a lack of response to stimulation with forceps on the paws. The skin was disinfected with 70% ethanol, and the lower region of the abdominal wall was picked up with a pair of forceps and the layers were cut simultaneously toward the thorax region with a large pair of scissors to expose the internal organs and the abdominal aorta. The tip of a 21 G needle connected to a 20 ml syringe was carefully and immediately inserted into the aorta. The syringe plunger was pulled out slowly to collect blood that was then poured into an ice-cold 10 ml sterile test tube. The collected blood was centrifuged for 20 min at 1,500 g at room temperature (RT). The upper serum layer was carefully transferred into a 15 ml sterile tube using a sterile pipette in a laminar airflow cabinet. Aliquots (1.5 ml) of serum were stored in individual sterile tubes at -20°C until further use.
Chondrocyte treatments
Chondrocytes were cultured with either 10% FBS in DMEM (10F group), 5% RS in DMEM (5R group), or 5% RS plus the MEK inhibitor PD0325901 (Selleck-Bimake, China) at 0.25 µM, 0.5 µM, or 1 µM in DMEM (5R+0.25 µM, 5R+0.5 µM, 5R+1 µM groups). All of these cultures were grown for 24, 48, or 72 h and harvested for further analysis. The morphological changes of the chondrocytes were further investigated after being cultured for several passages.
CCK-8 assay
Cell proliferation was measured using a CCK8 assay (Dojindo, Japan). Rat chondrocytes (3,000 cells/well) were incubated in 96-well plates in the presence of different FBS and RS concentrations, as well as various PD0325901 concentrations (0.25 µM, 0.5 µM, or 1 µM) for 24, 48, or 72 h. Then, 10 µl of CCK-8 solution was added to each well and the plates were incubated for 0.5 h at 37°C. The optical density of each well was measured at 450 nm using a microplate reader (SYNERGY4, USA). At least three independent experiments were performed.
Western blot
Cells were lysed with lysis buffer (Beyotime, P0013B) containing PMSF. The lysates were centrifuged at 12,000 g at 4°C for 10 min, and protein concentrations were measured with a BCA Protein Assay Kit (Cat. No 23227, Pierce, USA). Proteins were separated by 15% SDS-PAGE and transferred to PVDF membranes using a standard protocol. Membranes were incubated with primary antibodies and probed with the corresponding secondary antibodies. Enhanced chemiluminescence (Pierce Biotechnology, Rockford, USA) was used for visualization. The antibodies used were MMP13 (SC-30073), Col2a1 (SC-52658), PCNA (SC-25280), CyclinD1 (#2978, CST), Col1a1 (ab34710), and GAPDH (#2118s, CST).
Quantitative analysis of GAG content
GAG levels were measured with a Blyscan Sulfated Glycosaminoglycan assay kit (Biocolor Ltd, UK) according to the manufacturer’s protocol. Briefly, 1 × 10⁶ cells or 1 mg of cartilage tissue was lysed in 1 ml of papain extraction reagent at 65°C for 3 h and then centrifuged at 10,000 g for 10 min. One hundred microliters of supernatant was mixed with 1 ml of Blyscan dye reagent, the mixture was placed in a shaker for 30 min, and then centrifuged at 12,000 g for 10 min. The supernatant was drained carefully, 0.5 ml of dissociation reagent was added, and absorbance was measured at 656 nm. To reduce the effect of the size of cartilage nodules on the GAG concentration, the weights of the cartilage nodules were taken into account.
Cell cycle distribution analysis
The effects of different sera on cell cycle distributions were determined by flow cytometric analysis of the DNA content in cell nuclei following propidium iodide (PI) staining. Rat chondrocytes were seeded in a 6 cm dish and allowed to attach overnight. The medium was replaced with DMEM containing 1%, 5%, or 10% RS (1R, 5R, or 10R) or with DMEM containing 1%, 5%, or 10% FBS (1F, 5F, or 10F) or with DMEM containing various concentrations of PD0325901. The cells were incubated for 24 h at 37°C, harvested, washed three times with 1 × PBS, and then fixed with 70% ethanol overnight at 4°C. Next, the cells were treated with 100 µg/ml RNaseA and 100 µg/ml PI for 30 min at 37°C. The stained cells were transferred to FACS tubes for flow cytometric analysis (Beckman Coulter).
Cell immunofluorescence
Rat chondrocytes were seeded onto cover slips and maintained in DMEM containing 10% FBS or 5% RS for 24 h. The culture medium was discarded and the cover slips were rinsed twice with PBS pH 7.4. The cells were fixed with 4% paraformaldehyde, washed with PBS three times, permeabilized with 0.1% Triton X-100 in PBS for 30 min at RT, washed with PBS three times, incubated in PBST with 10% BSA for 60 min to block nonspecific antibody binding, incubated with primary Col2a1 (SC-52658), Sox9 (SC-17341), and Collagen I antibodies (ab34710) in 1% BSA for 60 min at RT, washed with PBS three times, and incubated with a secondary antibody in 1% BSA for 30 min at RT. The nuclei were stained with 10 ng/ml DAPI (Cat. No A1001, Aleichem, Germany).
Culturing tissue-engineered cartilage in vitro
To explore the role of the MEK-ERK1/2 pathway in cartilage tissue construction, 5 × 10⁵-1 × 10⁶ cells were centrifuged at 1,000 g, and the cell pellets were cultured in DMEM containing 10% FBS. Cartilage nodules appeared after two days. The chondrocytes were cultured in DMEM supplemented with 10% FBS (10F group). For the 5R and 5R+0.25 µM groups, the FBS was replaced with 5% RS and 5% RS plus 0.25 µM PD0325901, respectively. Media was changed every other day and chondrocytes were cultured for 14 days. The supernatants were collected and the GAG contents were analyzed.
GAG staining
The tissue-engineered cartilage tissues were fixed with 4% paraformaldehyde overnight at 4°C and then dehydrated in 10%, 20%, and 30% sucrose for 24 h. The specimens were embedded in Tissue OCT-Freeze Medium (Leica) and cut into slices. The frozen slices were hydrated and washed with PBS three times, incubated with Alcian blue solution or with Safranin O-Fast Green (FCF) for 1-2 h or overnight and then washed twice with PBS. Finally, the samples were kept in PBS and photographs were taken.
Tissue immunofluorescence
Frozen specimens embedded in OCT were hydrated, incubated with 0.1% trypsin for 30 min at RT, washed with PBS three times, permeabilized with 0.1% Triton X-100 in PBS for 30 min at RT, washed with PBS three times, incubated in PBST with 10% BSA for 60 min to block nonspecific antibody binding, incubated with primary Col2a1 (SC-52658) or Col1a1 (ab34710) antibodies in 1% BSA for 60 min at RT, washed with PBS three times, and then incubated with a secondary antibody in 1% BSA for 30 min at RT. Nuclei were stained with 10 ng/ml DAPI (Cat. No A1001, Applichem, Germany). Pictures were taken using an OLY-MPUS IX71 inverted microscope.
Alkaline phosphatase (ALP) activity
Chondrocytes were cultured with RS or FBS until cells were at the fifth passage. Protein was extracted with lysis buffer (Beyotime, P0013B) containing PMSF. The protein concentrations were determined using a BCA Protein Assay Kit (Cat. No 23227, Pierce, USA). Briefly, 40 µg of total protein was mixed with 100 μL of 1-step TM PNPP (Cat. No 37621, Pierce, USA) and incubated at RT for 30 min. The reaction was stopped by adding 50 μL of 2 M NaOH. The product of the reaction was a yellow p-nitro phenol (pNP) compound, which was measured colorimetrically by absorbance at 405 nm.
Real-time quantitative PCR (RT-qPCR)
Total RNA was isolated from the cultured cells with TRIzol reagent (Cat. No 15596-026, Invitrogen). First strand cDNA was synthesized with the RT Reagent Kit (Takara code DRR037A). Quantitative PCR (qPCR) was performed with SYBR Premix Ex TaqTM (Cat. no. RR420R). The delta-delta Ct method was used to analyze the results. The primer sequences are listed in Table 1. All of the experiments were performed three independent times.
Table 1.
Primer sequences for qPCR
| Gene name | GenBank accession no. | mRNA sequences (5’-3’) |
|---|---|---|
| GAPDH-F | NM_017008.4 | TTCAACGGCACAGTCAAGG CTCAGCACCAGCATCACC |
| GAPDH-R | ||
| A-can-F | NM_022190.1 | GCAGGGATAACGGACTGAAGGAGTAAAGTGGTCATAGTTCAGCTTG |
| A-can-R | ||
| Sox9-F | XM_003750950.2 | ATCTTCAAGGCGCTGCAA CGGTGGACCCTGAGATTG |
| Sox9-R | ||
| ADAMTS5-F | NM_198761.1 | AGCCATCCTGTTCACCAGAG CATTCCCAGGGTGTCACAT |
| ADAMTS5-R | ||
| Col1a1-F | NM_053304.1 | CATGTTCAGCTTTGTGGACCT GCAGCTGACTTCAGGGATGT |
| Col1a1-R | ||
| Col1a2-F | NM_053356.1 | CCTGGCTCTCGAGGTGAACCAATGCCCAGAGGACCAG |
| Col1a2-R | ||
| MMP9-F | NM_031055.1 | CCTCTGCATGAAGACGACATAA GGTCAGGTTTAGAGCCACGA |
| MMP9-R | ||
| Runx2-F | NM_001278483.1 | AAGGAGCACAAACATGGCTG TCTTAGGGTCTCGGAGGGAA |
| Runx2-R | ||
| MMP2-F | NM_031054.2 | GTCGCCCATCATCAAGTTCC GCATGGTCTCGATGGTGTTC |
| MMP2-R |
GAPDH, glyceraldehyde-3-phosphate dehydrogenase; A-can, aggrecan; Sox9, sex determining region Y-box 9; ADAMTS5, A disintegrin and metalloproteinase with thrombospondin motifs 5; Col1a1, alpha1 chain of type I collagen; Col1a2, alpha2 chain of type I collagen; MMP9, matrix metalloproteinase 9; RUNX2, runt-related transcription factor 2; MMP2, matrix metalloproteinase 2.
Statistical analysis
Statistical analysis was performed with SPSS 20.0 software (IBM SPSS Inc., Chicago, IL, USA). The data were expressed as the mean ± standard deviation. Statistical correlations were evaluated for significance by one-way ANOVA with a post-hoc Tukey’s HSD test or unpaired Student’s t-test for two groups or multi-groups. P values < 0.05 were considered statistically significant.
Results
The effects of RS on chondrocyte gene expression and morphology
ECM molecules, such as Col2a1, play important roles in maintaining cartilage function and integrity. MMP13 plays a key role in degrading collagen matrix molecules, including Col2a1 [18]. Sex determining region Y-box 9 (Sox9) is a master transcription factor in chondrocytes that regulates expression of genes involved in cartilage ECM formation, including Col2a1 and GAG [19]. Col1a1 is specifically expressed in fibroblastic chondrocytes [20].
Col2a1, Col1a1, Sox9, and MMP13 expression levels were evaluated by western blot and cell immunofluorescence. We found that chondrocyte morphology changed after being cultured in DMEM containing RS (Figure 1A). Western blots showed that in the presence of RS, Col2a1 expression decreased, whereas MMP13 and Col1a1 expression increased (Figure 1B). The cell immunofluorescence results demonstrated that in the presence of RS, Sox9 and Col2a1 expression decreased, whereas Col1a1 expression increased, which is consistent with the western blot results (Figure 1C).
Figure 1.
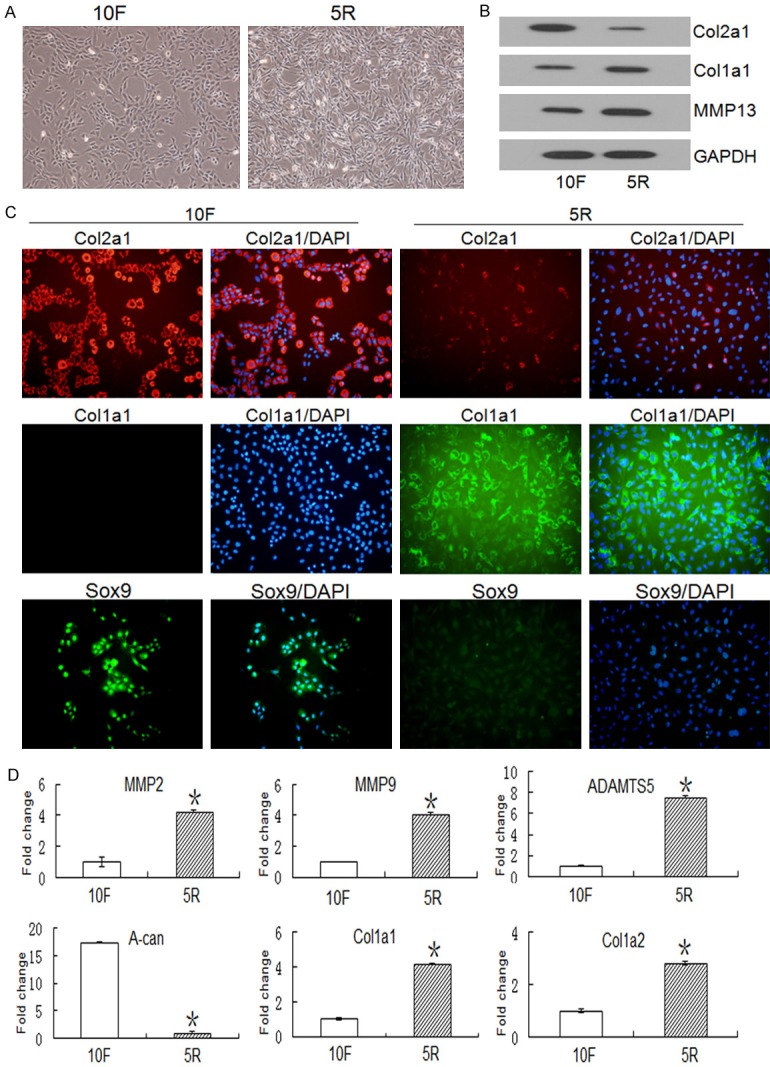
Cell morphology and gene and protein expression of Col2a1, Col1a1, Sox9, and MMP13 in chondrocytes stimulated with RS. A. Rat chondrocytes were cultured with DMEM plus 5% RS (5R) or DMEM plus 10% FBS (10F) for 24 h, and cell cultures were analyzed by microscopy. The chondrocytes dedifferentiated into fibroblastic chondrocytes after normal medium (DMEM plus 10% FBS, 10F) was replaced with DMEM containing 5% RS (5R). B. Col2a1, Col1a1 and MMP13 protein levels were analyzed by western blot. Col1a1 and MMP13 protein expression increased and Col2a1 protein expression decreased in the 5R group when compared to the 10F group. C. In situ expression of Col2a1, Col1a1, and Sox9 were detected in chondrocytes cultured with 5% RS or 10% FBS. The blue color indicates DAPI staining of nuclei. Red indicates Col2a1 expression and green indicates Col1a1 or Sox9 expression. Col1a1 and Sox9 expression increased and Col2a1 expression decreased in the 5R group when compared to the 10F group. D. Chondrocytes were cultured with RS or FBS for 24 h, mRNA was isolated from the chondrocytes, and expression of matrix degradation enzymes and collagen synthesis genes were analyzed by qRT-PCR. Data are expressed as the mean ± SD from three separate experiments. *P < 0.05 versus 10F. The Y-axis indicates the values normalized to the 10F value.
It has been demonstrated that matrix degradation enzymes, such as MMP2, MMP9, and ADAMTS5, are induced under inflammatory conditions [21,22]. We found that RS stimulated expression of these genes and caused A-can degradation in rat chondrocytes. Additionally, Col1a1 and Col1a2 mRNA expression levels were upregulated, and the increased expression of these two genes in the presence of RS is consistent with morphological changes from the normal chondrocyte phenotype to a fibroblast-like chondrocyte phenotype (Figure 1D).
RS stimulated chondrocyte proliferation
Autologous serum stimulates chondrocyte proliferation [23]. The CCK8 method showed that treatment of chondrocytes with RS markedly promoted cell growth in a dose-dependent manner (Figure 2A). Increased Proliferating Cell Nuclear Antigen (PCNA)and Cyclin D1 protein levels further confirmed the concentration-dependent, proliferative effect of RS on chondrocytes (Figure 2B). Cell cycle analysis by PI staining and flow cytometry showed that RS treatment led to an increase in the proportion of cells in the S phase and a corresponding decrease in the proportion of cells in the G0/G1 phase (Figure 2C, left) when compared with chondrocytes treated with the same concentration of FBS (Figure 2C, right).
Figure 2.

The effects of RS and FBS on chondrocyte proliferation and cell cycle phase distributions. A. Rat chondrocytes were cultured with 1% RS (1R), 5% RS (5R), 10% RS (10R), 1% FBS (1F), 5% FBS (5F), or 10% FBS (10F) for 24, 48, or 72 h. The CCK-8 method was performed on these cultures and the optical densities at 450 nm were measured to evaluate proliferation. B. PCNA and CyclinD1 expression levels were investigated by western blot after treatment with different sera for 24 h to evaluate cell proliferation. C. Chondrocytes were cultured with different sera for 24 h and then their cell cycles were analyzed by FACS (left) to determine the percentages of cells in G0/G1, S, and G2 phases (right). Data are expressed as the mean ± SD from three separate experiments. #P < 0.05 versus 1F, *P < 0.05 versus 5F, ※P < 0.05 versus 10F.
MAPK pathway activity increased upon RS stimulation in chondrocytes
Inhibition of the MAPK-MEK pathway results in A-can and Col2a1 downregulation via mediation of Sox9 expression [24]. The loss of activity in this pathway also influences the formation of tracheal cartilage [25]. The downstream molecules of the MAPK-MEK pathway, including p-ERK1/2, p-p38 MAPK, and p-JNK, were detected in rat chondrocytes by western blot after being cultured in different sera for 5 and 15 min. Expression of these proteins were higher in the RS-treated groups than in the FBS-treated groups (Figure 3).
Figure 3.
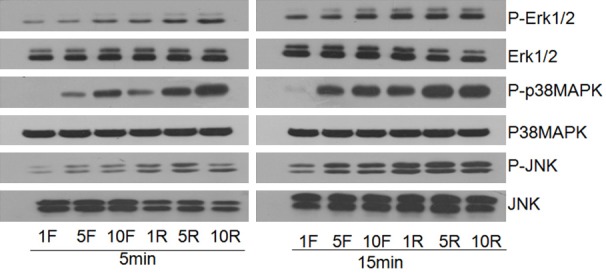
Expression of MAPK pathway proteins in chondrocytes cultured with RS and FBS. Levels of phosphorylated (P) and non-phosphorylated ERK1/2, p38MAPK, and JNK were detected in chondrocytes by western blot after 5 and 15 min of incubation with various concentrations of RS (1% RS, 5% RS and 10% RS) and FBS (1% FBS, 5% FBS and 10% FBS).
Changes in cell morphology, ECM synthesis, and MMP13 expression upon inhibition of the MAPK pathway
RS treatment increased the activity of the MAPK pathway. To understand the role of the MAPK pathway on chondrocyte phenotype, chondrocytes were cultured with and without MEK, p38 MAPK, or JNK inhibitors. The morphology of chondrocytes cultured in RS without inhibitors was similar to the morphology of fibroblasts cultured in RS. However, upon addition of the MEK inhibitor to the chondrocyte culture, the chondrocytes reversed to the normal chondrocyte morphology. But, this effect was not observed with the p38 MAPK or JNK inhibitors (Figure 4A).
Figure 4.

The effects of different MAPK pathway inhibitors on chondrocyte morphology and Col2a1, Col1a1, and MMP13 protein expression. A. The chondrocyte phenotype transformed from normal (10F) to fibroblast-like (5R) after media containing 10% FBS was replaced with media containing 5% RS. B. Chondrocytes were cultured with 5% RS plus different concentrations of the MEK inhibitor PD0325901. Chondrocyte morphology is shown in the microscope images. MMP13, Col2a1, and Col1a1 protein levels in the cells are shown in the adjacent western blot. C. Chondrocytes were cultured with 5% RS plus different concentrations of the p38 MAPK inhibitor AK715. Chondrocyte morphology is shown in the microscope images. MMP13, Col2a1, and Col1a1 protein levels in the cells are shown in the adjacent western blot. D. Chondrocytes were cultured with 5% RS plus different concentrations of the JNK inhibitor. Chondrocyte morphology is shown in the microscope images. MMP13, Col2a1, and Col1a1 protein levels in the cells are shown in the adjacent western blot.
After inhibition of the MEK-ERK1/2 pathway with the MEK inhibitor, the increased Col1a1 and MMP13 expression and the decreased Col2a1 expression caused by RS treatment reversed (Figure 4B). However, this reversal did not occur in the presence of the p38 MAPK or JNK-MAPK inhibitors (Figure 4C and 4D).
The MEK-ERK1/2 pathway affects GAG content and gene expression in chondrocytes
ECM molecules, including collagen and GAG, cooperatively maintain the function and integrity of cartilage tissue, and the synthesis of cartilage tissue is regulated by MMP13 and ADAMTS5. In our study, Safranin O staining showed that chondrocytes in the 10F and 5R plus PD0325901 groups stained deep red, whereas the chondrocytes in the 5R group stained light red suggesting that the GAG content was lower in the 5R group than in the 10F and 5R plus PD0325901 groups (Figure 5A, left). Additionally, we found that the GAG content, which was reduced by RS treatment, increased with PD0325901 treatment (Figure 5A, right). The expression levels of the matrix degradation enzymes MMP2, MMP9, and ADAMTS5, which were stimulated in the presence of RS, were downregulated upon PD0325901 treatment. In chondrocytes, the changes in the expression patterns of Sox9 and A-can were similar to the changes in GAG, but were contrary to the changes in Col1a1 expression (Figure 5B).
Figure 5.

Analysis of GAG content and gene expression in chondrocytes cultured with the MEK inhibitor PD0325901. A. Chondrocytes were cultured in DMEM supplemented with 5% RS (5R), 10% FBS (10F), or 5% RS plus various PD0325901 concentrations for 24 h. Chondrocytes were stained with Safranin O (left), and the GAG content in the chondrocytes was measured using the DMB method (right). B. Gene expression of matrix degradation enzymes and collagen synthesis genes in chondrocytes was evaluated by qPCR after treatment with and without various concentrations of the MEK-ERK1/2 pathway inhibitor PD0325901. Data are expressed as the mean ± SD from three separate experiments. #P < 0.05 versus 10F, *P < 0.05 versus 5R. The Y-axis indicates values that were normalized to the 10F value.
The MEK-ERK1/2 pathway regulates chondrocyte proliferation
The CCK8 method showed that RS-induced chondrocyte proliferation was inhibited by the MEK inhibitor in a concentration-dependent manner (Figure 6A). The reduced expression of the CyclinD1 and PCNA proteins in the presence of the MEK inhibitor further confirmed the influence of the MEK-ERK1/2 pathway on proliferation (Figure 6B). FACS data showed that the number of cells in the S phase decreased and the number of cells in the G0/G1 phase increased upon inhibition of the MEK-ERK1/2 pathway, thus inhibition of the MEK-ERK1/2 pathway had the opposite effect of RS treatment (Figure 6C, left). Differences in the cell cycle distributions between the different groups were significant (Figure 6C, right).
Figure 6.

The effects of the MEK-ERK1/2 pathway on chondrocyte proliferation. (A) Rat chondrocytes were cultured with 10% FBS (10F), 5% RS (5R), or 5% RS (5R) plus various PD0325901 concentrations for 24, 48, or 72 h, and proliferation levels were analyzed using the CCK-8 method and measuring optical densities at 450 nm (B) PCNA and CyclinD1 expression levels were assessed by western blot. (C) Chondrocytes were cultured with various PD0325901 concentrations and then their cell cycles were analyzed by FACS (left) to determine the percentages of cells in G0/G1, S, and G2 phases (right). Data are expressed as the mean ± SD from three separate experiments. #P < 0.05 versus 10F, *P < 0.05 versus 5R.
Cartilage tissue structure, GAG content, and in situ expression of ECM genes in constructed cartilage tissue under different culture conditions
To explore the role of the MEK-ERK1/2 pathway in the construction of cartilage tissue, cell masses were cultured in vitro for 14 days, chondrocytes were centrifuged and pelleted, and the GAG content in the cartilage tissue and the weight of the cartilage tissue were measured. The release of GAG into the media usually indicates cartilage degeneration because GAG is the main component in cartilage ECM. GAG synthesis is detected with Alcian blue and Safranin O-Fast Green FCF staining, whereas the dimethylmethylene-blue (DMB) method is used to measure GAG release into the supernatant. The weight of the cartilage tissue was lower in the 5R group than in the 10F group. There was no significant difference in the weight of the cartilage tissue in the 5R+0.25 µM and the 10F groups. The GAG concentration in the media was lower in the 5R group than in the 10F group, and the GAG concentrations in the media were lower for the 5R and 10F groups than for the 5R+0.25 µM group (Figure 7A-C).
Figure 7.
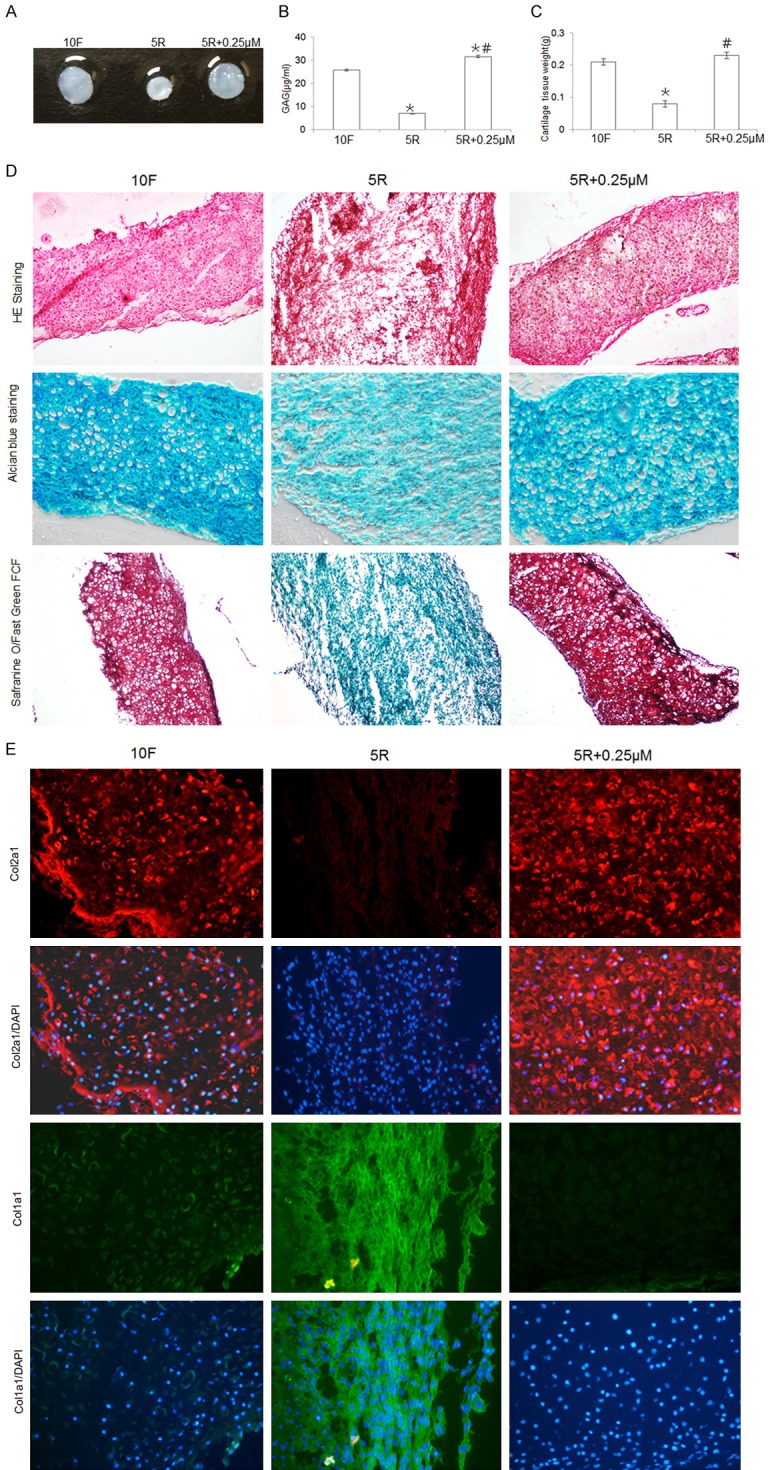
The effects of the MEK-ERK1/2 pathway on characteristics of the constructed cartilage tissue, including weight, GAG synthesis, and ECM expression (Col2a1 and Col1a1). A. Chondrocyte pellets were cultured with 10% FBS (10F), 5% RS (5R group), or 5% RS plus PD0325901 (5R+0.25 µM group) for 14 days in vitro, and the gross morphologies of the cartilage tissues constructed from chondrocyte pellets are shown. B. The GAG concentrations in the supernatants of the 10F, 5R, and 5R+0.25 µM cultures were evaluated using the DMB method. Data are expressed as the mean ± SD from three separate experiments. *P < 0.05 versus 10F. #P < 0.05 versus 5R. C. The weights of the cartilage tissues from the 10F, 5R, and 5R+0.25 µM groups were compared. Data are expressed as the mean ± SD from three separate experiments. *P < 0.05 versus 10F. #P < 0.05 versus 5R. D. The structures of the constructed cartilage tissues were examined by H&E staining (top panel), and the GAG contents in the cartilage tissues were evaluated by Alcianblue (middle panel) and Safranin O-Fast Green FCF staining (bottom panel) and are shown at 100 × magnification. E. In situ expression of Col2a1 and Col1a1 was evaluated by immunofluorescence (100 ×). The blue color indicates DAPI staining of nuclei. Red indicates Col2a1 expression and green indicates Col1a1 expression.
Hematoxylin and eosin (H&E) staining showed that the tissue in the 5R group lost its cartilage structure and had fibrous tissue features, whereas the tissue structures in the 10F and 5R+0.25 µM groups exhibited the typical cartilage tissue phenotype (Figure 7D, upper lane). Cartilage tissue that stains a dark blue with Alcian blue dye indicates a high concentration of GAG, and these staining results were consistent with the GAG release into the supernatant data (Figure 7D, middle lane). Safranin O-Fast Green FCF staining is an effective staining method to distinguish hyaline cartilage from fibrocartilage. Hyaline cartilage stains positively with Safranin O (red) and fibrocartilage stains positively with Fast Green FCF (green). The Safranin O-Fast Green FCF staining confirmed the finding that the 5R group lost its cartilage structure, whereas the 10F and 5R+0.25 µM groups did not (Figure 7D, lower lane).
Expression of Col2a1, Col1a1, and MMP13 was assessed by immunofluorescence. Col2a1 expression was lower and MMP13 and Col1a1 expression was higher in the 5R group than in the 10F group (Figure 7E). Col2a1 protein expression was higher and Col1a1 expression was lower in the 5R+0.25 µM group than in the 10F group. These findings were consistent with the staining results.
Discussion
It has been shown that in primary monolayer chondrocyte cultures, synthesis of type II collagen declines steadily and ceases by the fifth passage [26] and synthesis of collagen switches from cartilage-specific type II collagen to a mixture of type I collagen and the type I trimer [27]. Initially, all chondrocytes displayed the characteristic polygonal morphology in culture, but after a few passages, numerous fibroblastic phenotypes characterized by expression of Col1a1 began to appear until all of the cells displayed the fibroblast morphology. The gradual loss of molecular markers that define a differentiated chondrocyte (type II collagen, Sox9, GAGs, and A-can) and an increase in fibroblastic chondrocytes is defined as dedifferentiation, which is induced by long expansion times and multiple passages in vitro [28,29].
With regard to new treatments for major cartilage defects, whether the repair tissue is composed of hyaline cartilage or fibrocartilage is of great concern to both orthopedic surgeons and researchers. The culturing of chondrocytes in vitro, which results in dedifferentiated fibroblast-like cells, is a difficulty in the construction of cartilage tissue for clinical field applications. It is necessary to understand the mechanisms underlying cartilage degradation to develop new biological therapies to improve outcomes for patients suffering from joint diseases.
Our study was designed to examine the effects and associated mechanisms of serum on chondrocytes cultured in vitro. We discovered more dedifferentiation of rat chondrocytes into fibroblast-like chondrocytes after being cultured in RS than FBS. Routinely, chondrocytes are cultured in vitro in media supplemented with FBS. In this study, we cultured rat chondrocytes with RS and used FBS as a control. Chondrocyte gene expression, cell morphology, and cell proliferation were compared between the different culture conditions. Our study showed that supplementation with RS caused dedifferentiation as indicated by the increased catabolic activities.
Cartilage degeneration is caused by an increase in expression of proteolytic enzymes, such as ADAMTS (ADAMTS5) and MMPs (MMP2, MMP9), which leads to the loss of ECM components, such as Col2a1, A-can, and proteoglycan [30,31]. Sox9 is an essential transcription factor for maintaining the cartilage phenotype because it regulates Col2a1 expression [32]. Sox9 is characterized as the master gene of chondrogenesis, which regulates proliferation and differentiation of nonhypertrophic chondrocytes [33]. In addition, Sox9 acts as a negative regulator of chondrocyte hypertrophy [34]. We analyzed the effects of RS on Sox9, Col2a1, A-can, ADAMTS5, MMP2, and MMP9 mRNA levels. We found that when chondrocytes were cultured with RS, the expression of anabolic genes, including Sox9, Col2a1, and A-can, decreased, whereas expression of catabolic genes, including ADAMTS5, MMPP2, and MMP9 increased.
Chondrocytes typically lose their original morphology after being isolated from cartilage tissue and being cultured in vitro [3]. We found that chondrocytes transformed into fibroblast-like cells after incubation in culture medium with RS for 24 h. This phenotype change was consistent with reduced Col2a1 expression and increased Col1a1 expression, which occur during the fibrocartilage to hyaline cartilage transition.
MEK-ERK1/2 activity has been shown to increase upon surgically induced osteoarthritis (OA) in models of anterior cruciate ligament transaction and meniscectomy. In vivo studies showed that inhibition of MEK-ERK1/2 reduced the development of structural changes in experimental rabbit OA [35]. Molecular therapy for OA, which includes a combination of a MEK-ERK inhibitor and hyaluronic acid, reduced expression of chondrocyte hypertrophic markers and increased chondrogenic marker levels [36]. These studies suggest that there is a close relationship between activation of the MEK-ERK1/2 pathway and cartilage degeneration. Several lines of evidence suggest that the MEK-ERK1/2 pathway is involved in the regulation of chondrocyte proliferation and matrix synthesis [37,38]. However, contrary conclusions, such as the fact that periodic mechanical stress induces matrix synthesis by activating the MEK-ERK1/2 pathway have also been reported [39].
In addition to the ERK1/2 pathway, other signaling pathways, such as p38 MAPK and JNK, have been associated with the regulation of chondrocyte metabolism [14-17]. Based on studies on the effects of the MAPK pathway on cartilage and chondrocytes, we investigated the activation of MAPK-ERK1/2, p38 kinase, and JNK pathways in chondrocytes treated with RS or FBS for various times. ERK1/2, p38 MAPK, and JNK are downstream components of the MAPK pathway whose activities are determined by their phosphorylation (p) state. We observed that p-ERK1/2, p-p38 MAPK, and p-JNK expression levels were higher in the 5R group than in the 10F group. Our data suggest that activation of the MAPK pathway plays an important role in regulating the biological functions of chondrocytes. We hypothesized that the chondrogenic potential of chondrocytes associates with the synthesis of cartilage markers and the activation of key signaling proteins in the MAPK pathway, including ERK1/2, p38 MAPK and JNK, and we tested this hypothesis by evaluating the effects of select inhibitors of these key proteins.
The chondrocyte phenotypes in the different treatment groups were investigated, and we found that the dedifferentiation phenotype of chondrocytes was induced by RS, which activated ERK1/2. We also compared expression levels of Col2a1, Col1a1, and MMP13 upon treatment with various inhibitors and found that the effects of MEK-ERK1/2 inhibition on protein expression were consistent with the chondrocyte phenotypes observed. The increase in Col1a1 and MMP13 expression in chondrocytes, which was stimulated by RS, was reduced to expression levels near or lower than control levels (10F group) in the presence of the MEK inhibitor, whereas Col2a1 expression increased in the presence of the inhibitor. Our results are similar to previous observations that the prevention of ERK1/2 phosphorylation inhibited dedifferentiation of serial monolayer cultures of rabbit articular chondrocytes [40]. Activation of the p38 MAPK pathway prevented OA cartilage degeneration and protected chondrocyte differentiation [15,41]. Although p38 MAPK was activated in the presence of RS, the protective role of activated p38 MAPK did not neutralize the negative effect of MEK-ERK1/2 on chondrocyte differentiation. In addition, activation of the JNK-MAPK pathway by inflammatory cytokines has been shown to promote A-can degradation in cultured murine cartilage [16,17]. Although the MEK-ERK1/2 inhibitor reversed RS-induced Col2a1 degradation, the JNK-MAPK inhibitor did not prevent Col2a1 degradation.
A-can and Sox9 mRNA expression levels were downregulated by RS, but were upregulated by the MEK inhibitor, whereas MMP13, MMP2, MMP9, and ADAMTS5 expression levels were upregulated by RS, but were downregulated by the MEK-ERK1/2 inhibitor. Consistent with previously published studies, we found that the MEK-ERK1/2 pathway regulated chondrocyte cell proliferation. RS stimulated chondrocyte proliferation, whereas the MEK inhibitor PD0325901 inhibited proliferation suggesting that proliferation associates with activation of the ERK1/2 signaling pathway. Treatment with PD0325901 reverted chondrocyte proliferation and morphology back to the normal chondrocyte phenotype. Our data shows that activation of the MEK-ERK1/2 pathway negatively regulates gene expression, cell morphology, and cell proliferation in chondrocytes.
The effects of serum on in vitro constructed cartilage tissue were also investigated. Staining results showed that the constructed cartilage tissue in the 5R group had a typical fibrous tissue structure. In contrast to the smooth surface of the cartilage tissue in the 5R+0.25 µM group, a superficial fibrous layer was seen on the cartilage tissue in the 10F group.
The difference between hyaline cartilage and fibrocartilage is the collagen fiber subtype. Hyaline cartilage primarily contains type II collagen, whereas fibrocartilage is primarily composed of type I collagen [42]. Col2a1 and Col1a1 protein expression and GAG synthesis in constructed cartilage tissue were assessed. Col2a1 expression was lower in the 5R group than in the 10F group, whereas Col2a1 expression was higher in the 5R+0.25 µM group than in the 10F group. The immunofluorescence results for Col1a1 expression were the opposite of the immunofluorescence results for Col2a1 expression in the different groups. These data suggest that the quality of the constructed cartilage tissue was much better in the 5R+0.25 µM group than in the 10F group. The amounts of GAG released from the tissue-engineered constructions were consistent with the protein expression levels.
Interestingly, the weight of the chondrocyte tissue in the 5R group was lower than in the 10F group, which conflicted with the chondrocyte monolayer proliferation results, perhaps because chondrocytes in their normal environment will continue synthesizing chondroitin sulfate and collagen, which helps to form cartilage tissue, rather than continue dividing, and the chondrocytes in the cartilage tissue were surrounded by ECM (chondroitin sulfate, collagen). Several reports have shown that rapidly dividing fibroblasts do not synthesize collagen in their rapid growth phase [43,44]. We hypothesized that rat chondrocytes dedifferentiated into fibroblastic chondrocytes and divided rapidly after being stimulated by RS, which indicated that ECM was not synthesized by the dedifferentiated chondrocytes, and cytoplasm staining with Alcian blue and Safranin O-Fast Green FCF supported this hypothesis. Secreted ECM was observed between chondrocytes that were farther apart as determined by nuclei staining in the 10F and 5R+0.25 µM groups, which formed the larger and heavier cartilage tissue, but ECM was not observed around the cells in 5R group, which formed the smaller and lighter cartilage tissue.
Inhibiting chondrocyte dedifferentiation and maintaining proliferation are vital factors for in vitro cartilage tissue construction. We demonstrated for the first time that the MEK-ERK1/2 pathway simultaneously regulates chondrocyte proliferation and differentiation, which suggests that inhibition of the MEK-ERK1/2 pathway promotes hyaline cartilage formation in vitro. We also showed that culturing chondrocytes in RS supplemented with PD0325901 reversed the dedifferentiation that occurred during cell number expansion in monolayer culture and re-established the ability of chondrocytes to form cartilage-like tissue.
Our study provides definitive evidence to support the critical role of MEK-ERK1/2 signaling in the dedifferentiation of chondrocytes in vitro and the formation of hyaline cartilage. The development of a method to expand cell number in the absence of serum supplementation may further enhance clinical translation. Further studies are required to be able to form a continuous layer of articular cartilage tissue suitable for repair of focal joint surface defects.
Acknowledgements
This study was supported by National Natural Science Foundation of China (81503598; 81373665), Budget research project of Shanghai university of TCM (18LK039), Summit plateau team project in traumatology of Shanghai university of TCM.
Disclosure of conflict of interest
None.
References
- 1.Oseni A, Crowley C, Lowdell M, Birchall M, Butler PE, Seifalian AM. Advancing nasal reconstructive surgery: the application of tissue engineering technology. J Tissue Eng Regen Med. 2012;6:757–768. doi: 10.1002/term.487. [DOI] [PubMed] [Google Scholar]
- 2.Ahmed TA, Hincke MT. Mesenchymal stem cell-based tissue engineering strategies for repair of articular cartilage. Histol Histopathol. 2014;29:669–689. doi: 10.14670/HH-29.669. [DOI] [PubMed] [Google Scholar]
- 3.Schnabel M, Marlovits S, Eckhoff G, Fichtel I, Gotzen L, Vecsei V, Schlegel J. Dedifferentiation-associated changes in morphology and gene expression in primary human articular chondrocytes in cell culture. Osteoarthritis Cartilage. 2002;10:62–70. doi: 10.1053/joca.2001.0482. [DOI] [PubMed] [Google Scholar]
- 4.Mandl EW, van der Veen SW, Verhaar JA, van Osch GJ. Serum-free medium supplemented with high-concentration FGF2 for cell expansion culture of human ear chondrocytes promotes redifferentiation capacity. Tissue Eng. 2002;8:573–580. doi: 10.1089/107632702760240490. [DOI] [PubMed] [Google Scholar]
- 5.Mandl EW, Jahr H, Koevoet JL, van Leeuwen JP, Weinans H, Verhaar JA, van Osch GJ. Fibroblast growth factor-2 in serum-free medium is a potent mitogen and reduces dedifferentiation of human ear chondrocytes in monolayer culture. Matrix Biol. 2004;23:231–241. doi: 10.1016/j.matbio.2004.06.004. [DOI] [PubMed] [Google Scholar]
- 6.Kelly TA, Fisher MB, Oswald ES, Tai T, Mauck RL, Ateshian GA, Hung CT. Low-serum media and dynamic deformational loading in tissue engineering of articular cartilage. Ann Biomed Eng. 2008;36:769–779. doi: 10.1007/s10439-008-9476-1. [DOI] [PubMed] [Google Scholar]
- 7.Ho ST, Yang Z, Hui HP, Oh KW, Choo BH, Lee EH. A serum free approach towards the conservation of chondrogenic phenotype during in vitro cell expansion. Growth Factors. 2009;27:321–333. doi: 10.1080/08977190903137595. [DOI] [PubMed] [Google Scholar]
- 8.Bian L, Lima EG, Angione SL, Ng KW, Williams DY, Xu D, Stoker AM, Cook JL, Ateshian GA, Hung CT. Mechanical and biochemical characterization of cartilage explants in serum-free culture. J Biomech. 2008;41:1153–1159. doi: 10.1016/j.jbiomech.2008.01.026. [DOI] [PMC free article] [PubMed] [Google Scholar]
- 9.Kandel RA, Pritzker KP, Mills GB, Cruz TF. Fetal bovine serum inhibits chondrocyte collagenase production: interleukin 1 reverses this effect. Biochim Biophys Acta. 1990;1053:130–134. doi: 10.1016/0167-4889(90)90004-w. [DOI] [PubMed] [Google Scholar]
- 10.Wu P, DeLassus E, Patra D, Liao W, Sandell LJ. Effects of serum and compressive loading on the cartilage matrix synthesis and spatiotemporal deposition around chondrocytes in 3D culture. Tissue Eng Part A. 2013;19:1199–1208. doi: 10.1089/ten.tea.2012.0559. [DOI] [PMC free article] [PubMed] [Google Scholar]
- 11.Stanton LA, Underhill TM, Beier F. MAP kinases in chondrocyte differentiation. Dev Biol. 2003;263:165–175. doi: 10.1016/s0012-1606(03)00321-x. [DOI] [PubMed] [Google Scholar]
- 12.Provot S, Nachtrab G, Paruch J, Chen AP, Silva A, Kronenberg HM. A-raf and B-raf are dispensable for normal endochondral bone development, and parathyroid hormone-related peptide suppresses extracellular signal-regulated kinase activation in hypertrophic chondrocytes. Mol Cell Biol. 2008;28:344–357. doi: 10.1128/MCB.00617-07. [DOI] [PMC free article] [PubMed] [Google Scholar]
- 13.El-Hoss J, Kolind M, Jackson MT, Deo N, Mikulec K, McDonald MM, Little CB, Little DG, Schindeler A. Modulation of endochondral ossification by MEK inhibitors PD0325901 and AZD6244 (Selumetinib) Bone. 2014;59:151–161. doi: 10.1016/j.bone.2013.11.013. [DOI] [PubMed] [Google Scholar]
- 14.Joos H, Albrecht W, Laufer S, Brenner RE. Differential effects of p38MAP kinase inhibitors on the expression of inflammation-associated genes in primary, interleukin-1beta-stimulated human chondrocytes. Br J Pharmacol. 2010;160:1252–1262. doi: 10.1111/j.1476-5381.2010.00760.x. [DOI] [PMC free article] [PubMed] [Google Scholar]
- 15.Prasadam I, Mao X, Wang Y, Shi W, Crawford R, Xiao Y. Inhibition of p38 pathway leads to OA-like changes in a rat animal model. Rheumatology (Oxford) 2012;51:813–823. doi: 10.1093/rheumatology/ker360. [DOI] [PubMed] [Google Scholar]
- 16.Ismail HM, Miotla-Zarebska J, Troeberg L, Tang X, Stott B, Yamamoto K, Nagase H, Fosang AJ, Vincent TL, Saklatvala J. Brief report: JNK-2 controls aggrecan degradation in murine articular cartilage and the development of experimental osteoarthritis. Arthritis Rheumatol. 2016;68:1165–1171. doi: 10.1002/art.39547. [DOI] [PubMed] [Google Scholar]
- 17.Ismail HM, Yamamoto K, Vincent TL, Nagase H, Troeberg L, Saklatvala J. Interleukin-1 acts via the JNK-2 signaling pathway to induce aggrecan degradation by human chondrocytes. Arthritis Rheumatol. 2015;67:1826–1836. doi: 10.1002/art.39099. [DOI] [PubMed] [Google Scholar]
- 18.Sondergaard BC, Henriksen K, Wulf H, Oestergaard S, Schurigt U, Brauer R, Danielsen I, Christiansen C, Qvist P, Karsdal MA. Relative contribution of matrix metalloprotease and cysteine protease activities to cytokinestimulated articular cartilage degradation. Osteoarthritis Cartilage. 2006;14:738–748. doi: 10.1016/j.joca.2006.01.016. [DOI] [PubMed] [Google Scholar]
- 19.Lefebvre V, Smits P. Transcriptional control of chondrocyte fate and differentiation. Birth Defects Res C Embryo Today. 2005;75:200–212. doi: 10.1002/bdrc.20048. [DOI] [PubMed] [Google Scholar]
- 20.Ahmed MR, Mehmood A, Bhatti FU, Khan SN, Riazuddin S. Combination of ADMSCs and chondrocytes reduces hypertrophy and improves the functional properties of osteoarthritic cartilage. Osteoarthritis Cartilage. 2014;22:1894–1901. doi: 10.1016/j.joca.2014.07.028. [DOI] [PubMed] [Google Scholar]
- 21.Jackson MT, Moradi B, Smith MM, Jackson CJ, Little CB. Activation of matrix metalloproteinases 2, 9, and 13 by activated protein C in human osteoarthritic cartilage chondrocytes. Arthritis Rheumatol. 2014;66:1525–1536. doi: 10.1002/art.38401. [DOI] [PubMed] [Google Scholar]
- 22.Gilbert SJ, Blain EJ, Al-Sabah A, Zhang Y, Duance VC, Mason DJ. Protein kinase R plays a pivotal role in oncostatin M and interleukin-1 signalling in bovine articular cartilage chondrocytes. Eur Cell Mater. 2012;23:41–57. doi: 10.22203/ecm.v023a04. [DOI] [PubMed] [Google Scholar]
- 23.Munirah S, Ruszymah BH, Samsudin OC, Badrul AH, Azmi B, Aminuddin BS. Autologous versus pooled human serum for articular chondrocyte growth. J Orthop Surg (Hong Kong) 2008;16:220–229. doi: 10.1177/230949900801600219. [DOI] [PubMed] [Google Scholar]
- 24.Shakibaei M, Seifarth C, John T, Rahmanzadeh M, Mobasheri A. Igf-I extends the chondrogenic potential of human articular chondrocytes in vitro: molecular association between Sox9 and Erk1/2. Biochem Pharmacol. 2006;72:1382–1395. doi: 10.1016/j.bcp.2006.08.022. [DOI] [PubMed] [Google Scholar]
- 25.Boucherat O, Nadeau V, Berube-Simard FA, Charron J, Jeannotte L. Crucial requirement of ERK/MAPK signaling in respiratory tract development. Development. 2014;141:3197–3211. doi: 10.1242/dev.110254. [DOI] [PubMed] [Google Scholar]
- 26.Benya PD, Padilla SR, Nimni ME. Independent regulation of collagen types by chondrocytes during the loss of differentiated function in culture. Cell. 1978;15:1313–1321. doi: 10.1016/0092-8674(78)90056-9. [DOI] [PubMed] [Google Scholar]
- 27.Mayne R, Vail MS, Mayne PM, Miller EJ. Changes in type of collagen synthesized as clones of chick chondrocytes grow and eventually lose division capacity. Proc Natl Acad Sci U S A. 1976;73:1674–1678. doi: 10.1073/pnas.73.5.1674. [DOI] [PMC free article] [PubMed] [Google Scholar]
- 28.Holtzer H, Abbott J, Lash J, Holtzer S. The loss of phenotypic traits by differentiated cells in vitro, I. dedifferentiation of cartilage cells. Proc Natl Acad Sci U S A. 1960;46:1533–1542. doi: 10.1073/pnas.46.12.1533. [DOI] [PMC free article] [PubMed] [Google Scholar]
- 29.von der Mark K, Gauss V, von der Mark H, Muller P. Relationship between cell shape and type of collagen synthesised as chondrocytes lose their cartilage phenotype in culture. Nature. 1977;267:531–532. doi: 10.1038/267531a0. [DOI] [PubMed] [Google Scholar]
- 30.Sandy JD, Verscharen C. Analysis of aggrecan in human knee cartilage and synovial fluid indicates that aggrecanase (ADAMTS) activity is responsible for the catabolic turnover and loss of whole aggrecan whereas other protease activity is required for C-terminal processing in vivo. Biochem J. 2001;358:615–626. doi: 10.1042/0264-6021:3580615. [DOI] [PMC free article] [PubMed] [Google Scholar]
- 31.Bau B, Gebhard PM, Haag J, Knorr T, Bartnik E, Aigner T. Relative messenger RNA expression profiling of collagenases and aggrecanases in human articular chondrocytes in vivo and in vitro. Arthritis Rheum. 2002;46:2648–2657. doi: 10.1002/art.10531. [DOI] [PubMed] [Google Scholar]
- 32.Tew SR, Li Y, Pothacharoen P, Tweats LM, Hawkins RE, Hardingham TE. Retroviral transduction with SOX9 enhances re-expression of the chondrocyte phenotype in passaged osteoarthritic human articular chondrocytes. Osteoarthritis Cartilage. 2005;13:80–89. doi: 10.1016/j.joca.2004.10.011. [DOI] [PubMed] [Google Scholar]
- 33.Akiyama H. Control of chondrogenesis by the transcription factor Sox9. Mod Rheumatol. 2008;18:213–219. doi: 10.1007/s10165-008-0048-x. [DOI] [PubMed] [Google Scholar]
- 34.Hattori T, Muller C, Gebhard S, Bauer E, Pausch F, Schlund B, Bosl MR, Hess A, Surmann-Schmitt C, von der Mark H, de Crombrugghe B, von der Mark K. SOX9 is a major negative regulator of cartilage vascularization, bone marrow formation and endochondral ossification. Development. 2010;137:901–911. doi: 10.1242/dev.045203. [DOI] [PubMed] [Google Scholar]
- 35.Pelletier JP, Fernandes JC, Brunet J, Moldovan F, Schrier D, Flory C, Martel-Pelletier J. In vivo selective inhibition of mitogen-activated protein kinase kinase 1/2 in rabbit experimental osteoarthritis is associated with a reduction in the development of structural changes. Arthritis Rheum. 2003;48:1582–1593. doi: 10.1002/art.11014. [DOI] [PubMed] [Google Scholar]
- 36.Prasadam I, Mao X, Shi W, Crawford R, Xiao Y. Combination of MEK-ERK inhibitor and hyaluronic acid has a synergistic effect on anti-hypertrophic and pro-chondrogenic activities in osteoarthritis treatment. J Mol Med (Berl) 2013;91:369–380. doi: 10.1007/s00109-012-0953-5. [DOI] [PubMed] [Google Scholar]
- 37.Ryan JA, Eisner EA, DuRaine G, You Z, Reddi AH. Mechanical compression of articular cartilage induces chondrocyte proliferation and inhibits proteoglycan synthesis by activation of the ERK pathway: implications for tissue engineering and regenerative medicine. J Tissue Eng Regen Med. 2009;3:107–116. doi: 10.1002/term.146. [DOI] [PMC free article] [PubMed] [Google Scholar]
- 38.Ding L, Heying E, Nicholson N, Stroud NJ, Homandberg GA, Buckwalter JA, Guo D, Martin JA. Mechanical impact induces cartilage degradation via mitogen activated protein kinases. Osteoarthritis Cartilage. 2010;18:1509–1517. doi: 10.1016/j.joca.2010.08.014. [DOI] [PMC free article] [PubMed] [Google Scholar]
- 39.Ren K, Ma Y, Huang Y, Liang W, Liu F, Wang Q, Cui W, Liu Z, Yin G, Fan W. Periodic mechanical stress activates MEK1/2-ERK1/2 mitogenic signals in rat chondrocytes through Src and PLCgamma1. Braz J Med Biol Res. 2011;44:1231–1242. doi: 10.1590/s0100-879x2011007500150. [DOI] [PubMed] [Google Scholar]
- 40.Yoon YM, Kim SJ, Oh CD, Ju JW, Song WK, Yoo YJ, Huh TL, Chun JS. Maintenance of differentiated phenotype of articular chondrocytes by protein kinase C and extracellular signal-regulated protein kinase. J Biol Chem. 2002;277:8412–8420. doi: 10.1074/jbc.M110608200. [DOI] [PubMed] [Google Scholar]
- 41.Han Y, Kim SJ. Simvastatin induces differentiation of rabbit articular chondrocytes via the ERK-1/2 and p38 kinase pathways. Exp Cell Res. 2016;346:198–205. doi: 10.1016/j.yexcr.2016.07.025. [DOI] [PubMed] [Google Scholar]
- 42.Perez-Castro AV, Vogel KG. In situ expression of collagen and proteoglycan genes during development of fibrocartilage in bovine deep flexor tendon. J Orthop Res. 1999;17:139–148. doi: 10.1002/jor.1100170120. [DOI] [PubMed] [Google Scholar]
- 43.Goldberg B, Green H. An analysis of collagen secretion by established mouse fibroblast lines. J Cell Biol. 1964;22:227–258. doi: 10.1083/jcb.22.1.227. [DOI] [PMC free article] [PubMed] [Google Scholar]
- 44.Castor CW, Muirden KD. Collagen formation in monolayer cultures of human fibroblasts. The effects of hydrocortisone. Lab Invest. 1964;13:560–574. [PubMed] [Google Scholar]