Abstract
Osteoporosis, characterized by bone mass reduction and increased fractures, has become a global health problem that seriously affects the health of people, especially postmenopausal women; however, the current pathogenesis of postmenopausal osteoporosis (PMOP) has not been thoroughly elucidated to date. In this study, bilateral ovariectomy was performed to establish an OVX mouse model of osteoporosis. UPLC-Q-TOF-MS-based lipidomics in combination with metabolomics were used to analyze the femur tissue of osteoporosis mice. We found that 11 polar metabolites and 93 lipid metabolites were significantly changed and were involved in amino acid metabolism, nucleotide metabolism and lipid metabolism. Among the lipids, fatty acyls, glycerolipids, glycerophospholipids, sphingolipids and sterols showed robust changes. These results revealed that several metabolic disorders caused by changes in the hormone levels in OVX, especially disordered lipid metabolism, are closely related to the imbalance between bone resorption and formation and may underlie the development of PMOP. The data generated via lipidomics and metabolomics presented in this study shows good applicability and wide coverage in the construction of the metabolic profile of bone tissue. Therefore, this approach may provide the pathway focusing and data support at the metabolite level for the in-depth mechanism of PMOP.
Introduction
Osteoporosis is a progressive, age-related metabolic bone disease, it characterized by generalized reduced bone mass that is accompanied by microstructural degeneration of bone tissue, resulting in decreased bone mineral density (BMD) and increased risk of fracture1,2. Osteoporosis can be divided into primary and secondary, with postmenopausal osteoporosis (PMOP) being the most common primary form3. With aging of worldwide population, osteoporosis has become a global health problem that seriously affects the health of middle-aged and aged people, especially in middle-aged and aged women, which burdens the government financial and healthcare system greatly4.
The imbalance between bone resorption and formation is the pathophysiological basis of osteoporosis5. The current studies of osteoporosis mainly primarily focus on the differentiation, regulation and balance of osteoblasts and osteoclasts6. Many factors can play a role in PMOP formation, including metabolic disorders, especially hormone imbalance3. Thus, studies of the internal metabolic environment of PMOP to monitor changes in endogenous metabolites related bone resorption and bone formation disorders will help to determine the mechanisms of osteoporosis.
Metabolomics, a strategy to study endogenous small-molecule metabolites systematically, can explore changes in the metabolic environment after the dynamic stimulation of pathophysiological, environmental or genetic factors7. Furthermore, metabolomics has been widely used in exploration of pathologic mechanism, discovery of biomarker and toxicity and safety study of drugs8,9. As the object of metabolomics studies is to quantify downstream molecules of the bioinformatics flow, which is close to biological phenotypes10, metabolomics can more readily screen out phenotype-related key biological nodes or biological pathways for diseases with complex causes and unknown mechanisms.
Recently, the application of metabolomics for the study of osteoporosis has attracted more and more attention11,12; however, most of these early studies used patients’ peripheral body fluids, including serum, plasma, and urine13–15, and bone tissue-related literature is notably rare. Metabolites changes in the peripheral body fluids include metabolic changes not only induced by osteoporosis but also induced by outside stimuli. So many confounding factors made it hard to indicate the pathogenesis directly and clearly. Bone tissue, the target tissue of osteoporosis, can be used to uncover the metabolic dysregulation directly associated with the development of osteoporosis. Additionally, due to the failure to use more advanced and targeted methods, the current bone metabolomic studies of osteoporosis reflect an incomplete characterization of metabolic changes. Certain metabolic molecules with important biological functions, including lipids, were omitted from these previous studies. Lipids play an important role in cell function maintenance and energy storage16 and have a close relationship with osteoporosis17–19. The traditional metabolomics studies have limitations in the extraction and analysis of lipid molecules, which greatly influenced the characterization of lipids20. In recent years, lipidomics has been developed to analyze lipid molecules in a more targeted fashion, especially those based on electrospray ionization mass spectrometry (ESI-MS), which has been widely used in lipid metabolism, lipid mediated signal transduction and other related fields21,22. Therefore, the application of advanced techniques in metabolomics can provide more complete and more accurate data for the interpretation of osteoporosis-related metabolic changes.
As mice can reproduce very similar models of human diseases as well as clear genetic background, in vivo microorganism controlled, stable and cheap, lots of researchers preferred establishing mice model to understand human clinical diseases23,24. So in our study, an ovariectomized (OVX) mouse model was established to simulate postmenopausal osteoporosis25. Lipidomics in combination with metabolomics analyses were performed on the femur to generate a bone metabolism profile of PMOP. To demonstrate the differential metabolites and metabolic pathways involved in the OVX model, we provide the complete metabolic data and a clear direction for revealing the metabolic dysregulation and mechanisms associated with PMOP occurrence and development.
Result
Micro-CT analysis and histological analysis
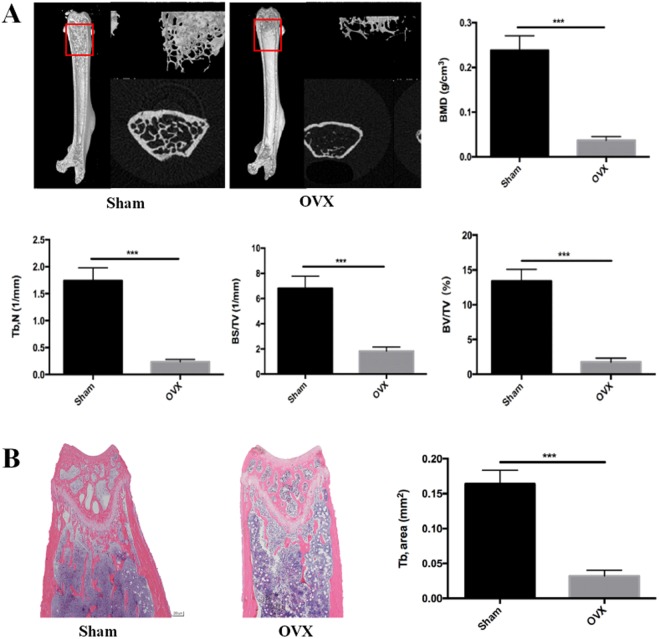
Micro-CT and histological analysis are taken to show bone loss after an OVX operation. In Fig. 1A, Micro-CT with 3D reconstruction of the femur shows that BMD (g/cm3), trabecular number (Tb.N, 1/mm), bone surface area/total value (BS/TV, 1/mm) and bone value/total value (BV/TV, %) were reduced in OVX group (P < 0.001) compared to the sham group, all four parameters revealed significant bone loss. Further histological and histomorphometric analyses confirmed the destruction on bone after OVX operation (Fig. 1B). Less bone trabecular was observed in the OVX group, revealing significantly bone loss and impaired trabecular microarchitecture in the femur bone. All these results suggested that we established a successful osteoporosis model.
Figure 1.
Ovariectomy-induced bone loss in vivo. (A) Micro CT analysis of the distal femur from sham and OVX group. Calculations of bone mineral density (BMD), trabecular number (Tb, N), bone surface area/ total value (BS/TV), bone value/total value (BV/TV). (B) H&E staining of distal femoral sections and quantification of trabecular area from sham and OVX group. (***P < 0.001).
Metabolic and lipidomic profiling analysis of femur
The system stability was carried out by injecting a QC sample every 4 samples during the whole sample batch. The total ion chromatography (TIC) the 4 QC samples displayed in Fig. 2A,B showed a good overlap in positive mode. Negative mode data is shown in Supplementary Figure S1A,B. The RSD values of the peak intensities in the QC samples were measured for stability. As is shown in Fig. 3, more than 80% of the RSD values of the QC samples in metabolomics and lipidomics analysis were less than 20%. These results demonstrated that the stability of the proposed method was sufficient.
Figure 2.
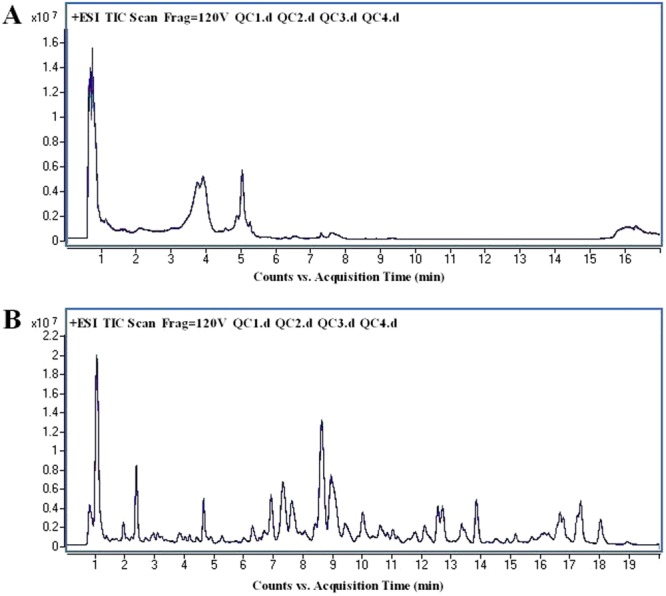
The overlapped total ion chromatography (TIC) of 4 QC samples in positive ion mode in both (A) metabolomic analysis and (B) lipidomic analysis.
Figure 3.
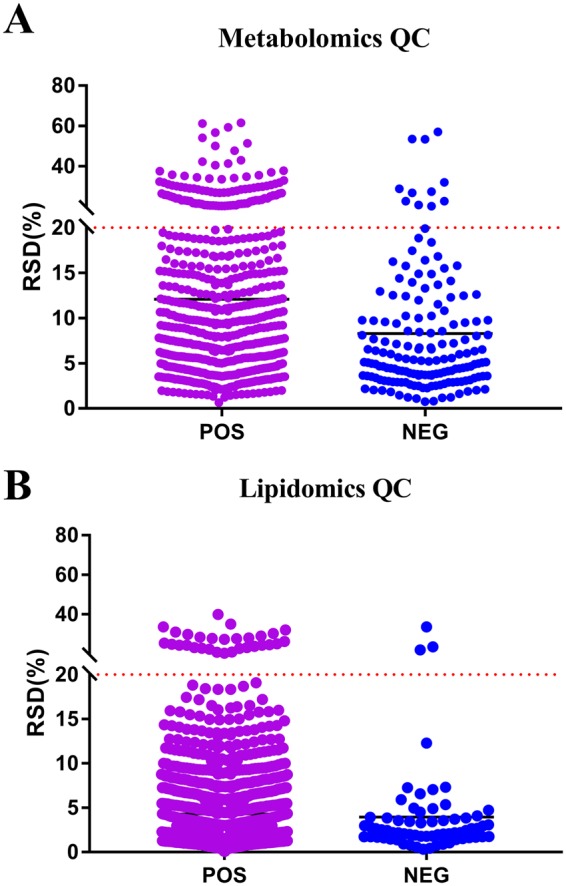
The RSD values of the peak intensities in QC samples. (A) Scatter plot of RSD values in metabolomics QC samples (B) Scatter plot of RSD values in lipidomics QC samples.
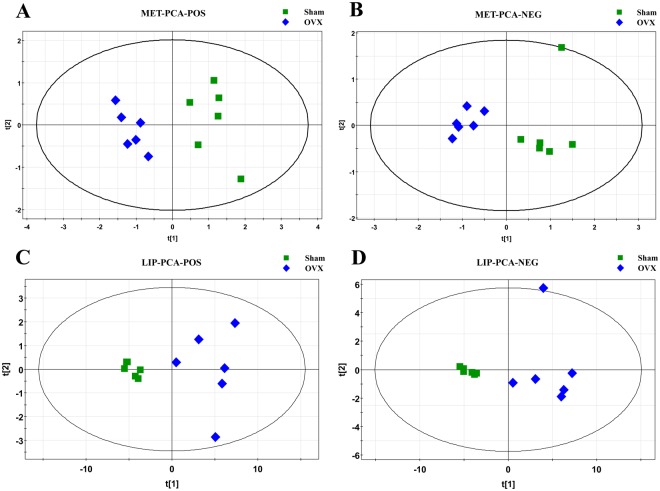
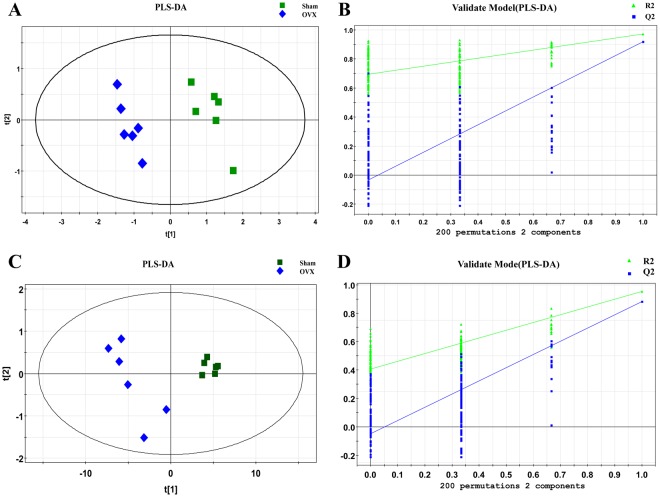
The entire normalized data from all samples was imported into SIMCA-P program (version 11) to perform principal components analysis (PCA) and partial least square discriminate analysis (PLS-DA). PCA, an unsupervised method, is applied as the first step in the separation procedure to reduce the dimension of data and make the observation more straightforward; PLS-DA, a supervised method that has a similar principle to PCA, is used to enhance the classification performance26,27. The PCA score plots in both modes showed that there was no outlier and that the Sham group was clearly separated from the OVX group in both the metabolic and lipidomic analyses (Fig. 4). Both modes of the supervised PLS-DA scores plots (Fig. 5A,C and Supplementary Figure S2A,C) displayed clearly separated clusters between the two groups. The reliability of the established PLS-DA models was evaluated by the explained variation R2 and the predicted total variation Q2, which is calculated by cross-validation. The expected R2 and Q2, highly dependent on their application model, should be more than 0.5 and 0.4, respectively, for a significant biological model28. In our established model for PMOP, the value of R2 and Q2 were above 0.6 (Table 1), indicating that the PLS-DA model was established successfully. R2 and Q2 from the PLS-DA analyses were calculated in the permutation test and shown in Fig. 5B,D and Supplementary Figure S2B,D. In the present research, ions with VIPs greater than 1.0 were considered to be important differential metabolites. Students t-test was performed to assess the statistical significance. Finally, 11 metabolites (Table 2, all decreased in the OVX group) and 93 lipids (Supplementary Table S1, 9 decreased and 84 increased in the OVX group) with significant differences between the sham and OVX groups were identified as potential biomarkers. The heat map (Fig. 6 and Supplementary Figure S3) of potential biomarkers was performed using the MetaboAnalyst platform (http://www.metaboanalyst.ca) to visually display the differences between groups.
Figure 4.
PCA score plot of multivariate statistical analysis of the experimental group in ESI positive and negative ion mode. (A,B) PCA score plot of the sham and OVX group in ESI positive and negative ion mode respectively in metabolomic analysis; (C,D) PCA score plot of the sham and OVX group in ESI positive and negative ion mode respectively in lipidomic analysis.
Figure 5.
Plots of multivariate statistical analysis of the experimental group in ESI positive ion mode.(A,C) PLS-DA score plot of the sham and OVX group in metabolomic and lipidomic analysis respectively; (B,D) Permutation test plot of the sham and OVX group in metabolomic and lipidomic analysis respectively.
Table 1.
Summary of the parameters for assessing quality of partial least square discriminate analysis (PLS-DA) model.
| OVX-Sham | Mode | No. Component | R2X | R2Y | Q2 |
|---|---|---|---|---|---|
| Metabolic Analysis | Positive | 2 | 0.652 | 0.965 | 0.906 |
| Negative | 2 | 0.698 | 0.966 | 0.892 | |
| Lipidomic Analysis | Positive | 2 | 0.895 | 0.952 | 0.883 |
| Negative | 2 | 0.926 | 0.903 | 0.855 |
Table 2.
Differential metabolites expressed in OVX group.
| No. | Name | Formula | m/z | Adduct | Rt(min) | FC(M-C) | P(M-C) | FDR | Pathway |
|---|---|---|---|---|---|---|---|---|---|
| 1 | Uridinea | C9H12N2O6 | 243.0607 | [M − H]− | 3.61 | 0.49↓ | 2.83E-08*** | 4.143E-07 | Pyrimidine metabolism |
| 2 | Hypoxanthineb | C5H4N4O | 137.0458 | [M + H]+ | 3.73 | 0.78↓ | 3.13E-04*** | 6.808E-07 | Purine metabolism |
| 3 | Ubiquinol 8c | C49H74O4 | 744.5893 | [M + NH4]+ | 3.93 | 0.44↓ | 2.35E-08*** | 1.785E-05 | Respiratory chain |
| 4 | Xanthineb | C5H4N4O2 | 151.0246 | [M − H]− | 4.58 | 0.61↓ | 7.07E-08*** | 8.762E-07 | Purine metabolism |
| 5 | Inosineb | C10H12N4O5 | 267.0722 | [M − H]− | 5.16 | 0.60↓ | 6.77E-03** | 1.515E-02 | Purine metabolism |
| 6 | Cytidinea | C9H13N3O5 | 242.0768 | [M − H]− | 6.25 | 0.31↓ | 6.09E-09*** | 1.963E-07 | Pyrimidine metabolism |
| Cytidinea | C9H13N3O5 | 266.0750 | [M + Na] + | 6.27 | 0.36↓ | 5.44E-09*** | 9.595E-05 | Pyrimidine metabolism | |
| 7 | L-Phenylalanineb | C9H11NO2 | 166.0862 | [M + H]+ | 7.20 | 0.27↓ | 5.73E-09*** | 7.061E-07 | Phenylalanine metabolism |
| 8 | L-Leucineb | C6H13NO2 | 132.1019 | [M+H]+ | 7.21 | 0.29↓ | 6.00E-09*** | 9.846E-05 | Leucine and isoleucine metabolism |
| 9 | L-Carnitinea | C7H15NO3 | 162.1126 | [M + H]+ | 7.31 | 0.35↓ | 5.31E-09*** | 1.385E-04 | Carnitine metabolism |
| 10 | L-Prolineb | C5H9NO2 | 116.0707 | [M + H]+ | 9.35 | 0.35↓ | 2.04E-08*** | 2.927E-03 | Arginine and proline metabolism |
| 11 | L-Arginineb | C6H14N4O2 | 175.1191 | [M + H]+ | 16.71 | 0.41↓ | 1.40E-05*** | 1.333E-03 | Arginine and proline metabolism |
aMetabolites analyzed based on MS/MS chromatograms.
bMetabolites validated with standards.
cMetabolites putatively annotated.
(↓): down-regulated. **p < 0.01, ***p < 0.001 versus Sham.
Figure 6.
Heat map based on the relative levels of polar metabolites in femur of mouse in OVX. Class 0: OVX group, Class 1: Sham. Color key indicates metabolite expression value, red: up-regulated, blue: down-regulated.
Biomarker identification and pathways influenced by OVX in the mouse femur
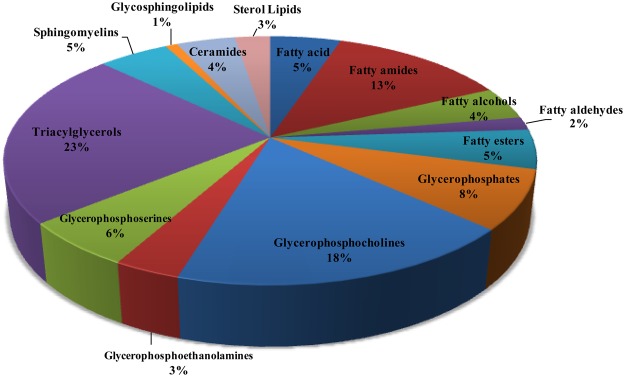
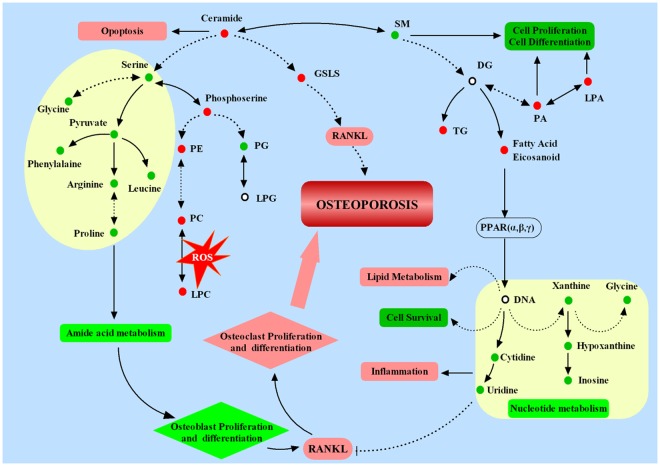
Potential biomarkers were identified using the method mentioned above. We categorized the potential biomarkers based on KEGG (http://www.kegg.jp/) and found that the identified biomarkers are mainly in the amino acid, purine, and pyrimidine classes. Lipids were categorized into 14 subclasses, including fatty acyls, glycerophospholipids (PG, PA, PC, PE, PS), triacylglycerols (TG), sphingolipids (SM, Cer) and sterol lipids. The proportion of different lipid categories is shown in Fig. 7. The classification indicated that in established osteoporosis, the femur has multiple changes in several metabolic pathways and function (Fig. 8).
Figure 7.
The proportion of different lipid categories.
Figure 8.
Molecular profiling showing the proposed mechanisms underlying OVX mouse model.  : Increased in OVX group compared with shame group;
  : Decreased in OVX group compared with shame group. Solid line: direct connection, Dotted line: indirect connection. →: transform or promote, ⊥: Inhibit.
Discussion
The OVX mouse model is a classical model of PMOP25. In this study, lipidomics in combination with polar metabolomics were performed to construct a comprehensive metabolic profile of the femur in OVX-induced osteoporotic mice and showed comprehensive changes in lipid metabolites to polar metabolites. The results suggested that some endogenous metabolites of the bone change significantly during the initiation and progression of PMOP in this mouse model. The polar metabolites included amino acids, purines and pyrimidine nucleotides. The lipid metabolites included fatty acyls, glycerolipids, glycerophospholipids, sphingolipids and sterols. These lipid metabolites and polar metabolites are involved in multiple metabolic pathways, and interact with each other to form a complex network. As is shown in Fig. 8, amino acid and nucleotide metabolism were down-regulated, while lipid metabolism was up-regulated. These disorders not only reduced osteoblast but also increased osteoclast proliferation and differentiation, and increased ROS, as well as inflammation, leading to the development of osteoporosis eventually. This complex network help to explain the mechanism and metabolisms underlying the metabolic disorders associated with PMOP.
Amino acids play an important role in the process of bone metabolism. Arginine, leucine, proline and phenylalanine are all able to promote insulin secretion and enhance the effects of insulin-like growth factor 1 (IGF-1)29,30. IGF-1 is capable of promoting the proliferation and differentiation of osteoblasts31. Furthermore, amino acids, such as proline, phenylalanine and its analogues, were reported to inhibit osteoclastogenesis and decrease bone resorption in osteoporosis32,33. Thus, concentration changes of these amino acids are likely to cause an imbalance of bone metabolism. Meanwhile, post-menopausal osteoporosis does exist in the lack of some amino acids, and increasing the intake of some amino acids could increase BMD and decrease the risk of incidence of osteoporosis34. Chevalley et al. reported that arginine is able to increase growth hormone secretion and insulin-like growth factor-I production35. Fujita et al. discovered that leucine has a direct effect on the initiation of mRNA translation, participates in the synthesis of proteins, and maintains sufficient bone strength and bone density36. Phenylalanine is reported closely associated with body growth and normal physiological function37. In our study, we found that the above amino acids were significantly reduced in bone tissue of PMOP, suggesting that metabolism of amino acids is nonnegligible in the occurrence and development of osteoporosis. In addition, among the nucleotide substances, xanthine, hypoxanthine and inosine are present in purine metabolic pathways. Uridine and cytidine are present in pyrimidine metabolism pathway. According to precious studies, pyrimidine and its derivatives and analogs not only have anti-inflammatory and anti-oxidation effects38,39, but also can inhibit osteoclast genesis and bone resorption by inhibiting RANKL40. The abnormalities of these pathways found in our study are consistent with these early studies and suggests that the dysfunction of nucleotide occurrs in osteoporosis as well.
Through lipidomics analysis, we found that the occurrence of osteoporosis in the femur of mice was associated with many changes in lipids, including fatty acyls, glycerolipids, glycerophospholipids, sphingolipids and sterols. Fatty acids are a very important subclass of fatty acyls. Among the altered metabolites in our study, we found many fatty acids with a consistent uptrend in the bone tissue of the OVX group compared with sham animals. A previous study revealed that the concentration of cholesterol and fatty acids were increased in PMOP41. Zhu et al. also found that fatty acids increased in ovariectomy-induced group using metabolomics based on UPLC-Q-TOF-MS13. Moreover, fatty amines, fatty alcohols and fatty esters all belong to the fatty acyl group, and they all increase in the bone tissue of osteoporosis mice. We therefore concluded that osteoporosis indeed induces fatty acyl metabolic disorders.
In addition to fatty acyls, glycerolipids (primarily TG), sterols, some glycerophospholipids, and ceramides (Cer) also increased in the PMOP mice. Conversely, another part of glycerophosphocholines (PC) and sphingolipids showed a downward trend. Triglycerides belong to the glycerolipids group. Qi et al. reported that TG increased in postmenopausal women obviously18, and Xue et al. also found that TG significantly increased in PMOP mice42. Additional studies reported that lipid metabolism is regulated by peroxisome proliferator activated receptor γ (PPARγ), and the accumulation of lipids increases its oxidation, resulting in the activation of PPARγ. The activation of PPARγ could not only inhibit the differentiation of osteoblasts but also promote bone marrow stromal cell differentiation into adipogenic cells43,44. Lysophosphatidylcholines (LPC) and phosphatidylcholines (PC) belong to the glycerophosphate group. These phospholipids are an integral component of the animal cell membrane structure and can mutually transform one into another. The increase of LPC and PC is suggestive of an oxidative stress response. LPC is reportedly significantly up-regulated in the plasma of osteoporosis mice, and increased ROS leads to oxidative stress damage45. The existence of oxidative stress may lead to increased bone mass loss and bone friability, thereby aggravating the process of osteoporosis46. In our study, TG together with glycerophospholipids (e.g., PC, PA, PE, and PS) were found to be disordered in osteoporosis mice, suggesting that the abnormal metabolism of glycerolipids and glycerophospholipids is related to osteoporosis.
Sphingolipids, including sphingomyelin (SM), glycosphingolipid and ceramide, were also found to be altered in our study. Among these sphingolipids, sphingomyelins regulate cell growth and differentiation and function as second messengers47. Glycosphingolipids, components of the cell membrane, play an important role in tissue development and function and can regulate trans membrane signals and mediate the interaction between cells and cells or cells and the matrix48. Glycosphingolipids are considered to be essential for the formation of osteoblasts induced by RANKL49. Increased glycosphingolipids can accelerate the differentiation and formation of osteoblasts, destroying the original balance in the bone tissue. Under the continuous action of acidic hydrolase, glycosphingolipid can be degraded into ceramide, which is an inhibitor of protein transport, secretion, and inhibit proliferation and promote apoptosis50. In our study, sphingomyelins are obviously decreased in the bone tissue of PMOP mice, while glycosphingolipids and ceramides are increased, suggesting the dysregulated sphingolipid metabolism is inseparable from osteoporosis. In addition, increased steroids are able to promote bone resorption, especially vitamin D3 and its products and sterol ester analogues, which can induce the formation of osteoclasts and destroy bone tissue, resulting in osteoporosis51.
This study has several limitations. First, the sample size used in the metabolomics and lipidomics analyses only meet the statistical power requirements. Additional studies with larger sample sizes will bolster our initial results. Secondly, we did not perform a systematic study on metabolites in vertebrae, which are another representative sample of osteoporosis; however, we believe that further experiments are warranted to elucidate the differentially expressed metabolites in vertebrae to more completely explain the mechanisms and metabolism disorders associated with PMOP.
Materials and Methods
Chemicals and reagents
Acetonitrile (ACN) (LC–MS optimum grade) and methanol (HPLC grade) were purchased from Merck (Darmstadt, Germany); Formic acid was obtained from Fluka (Buchs, Switzerland). Deionized water from a Millipore Milli-Q water purification system (Millipore Corp., Billerica, MA, USA) were used to prepare the chromatographic mobile phases. The reference standards of L-Leucine, L-Phenylalanine, L-Tryptophan, L-Arginine, Xanthine, and Hypoxanthine were supplied by Sigma Corporation (St. Louis, MO, USA). All other chemicals were of analytical grade.
OVX model construction
Eighteen wild-type female C57B/L6 mice aged 8-week-old were purchased from Shanghai SLAC laboratory Animal Co. Ltd. After conditional housing for one week under controlled temperature (22–24 °C), humidity(50–60%), a 12 h light/dark cycle and free water and food. Mice were randomly divided into sham group (Sham) and ovariectomy group (OVX). The ovariectomized mouse model were performed in the specific pathogen free animal laboratoryas described previously52 in OVX group to induce osteoporosis under chloral hydrate anesthesia, and the rest mice receive a sham procedure. After being housed for 8 weeks, all animals’ femur samples were collected by removing tissue. 3 of each group were randomly selected and fixed in 4% paraformaldehyde 48 h for Micro CT and histological study, the rest were quickly placed in liquid nitrogen and stored at −80 °C after the bone marrow was completely flushed out. All animal studies were performed in accordance with the National Institutes of Health (NIH) guide for the Care and Use of Laboratory Animals and approved by the Ethical Committee for the Experimental Use of Animals at Second Military Medical University (Shanghai, China).
Histomorphometric analysis using micro-CT and HE staining
We analyzed 100 section planes from the growth plate in each femurs bone using a high-performance micro-CT (Skyscan1172, Antwerp, Belgium) and detected the metaphyseal region and trabecular bone by built-in software to obtain the following parameters within the region of interest: Bone mineral density (BMD), bone volume/total volume (BV/TV), bone surface area/total volume (BS/TV), Trabecular number (Tb, N). Femur samples were decalcified in 10% EDTA with continuous shaking for 3 weeks. Each distal femur was sliced for 4 μm sections and performed for H&E staining.
Metabolic and lipidomic analysis of femur samples
Sample preparation
Bone tissue was cleaned of soft tissue, bone marrow, cartilage, and periosteum, then flash frozen in liquid nitrogen. Every femur sample was crumbed and grounded into powder in liquid nitrogen. For metabolic analysis, 300 μl pre-cooling 80% methanol solution which contained 4 µg/ml 2-Chloro-L-phenylalanine as internal standard was added in each weighted sample (Weighing about 20 ± 2 mg, accurately) for protein precipitation and homogenate using a high-throughput tissue grinder (teice, 50 Hz, 2 min). Subsequently, the mixtures were centrifuged at 13,000rmp, 4 °C for 15 min, aliquots (10 µL) of each supernatant were mixed to generate a pooled quality control (QC) sample. For lipidomic analysis, the mice femurs powder were weighed(about 20 mg) and added with 190 ul methanol-chloroform-water (2:1:0.8, v/v/v), vortex for 1 minute and sonication for 10 minutes in 4 °C to extract the lipids. Then, 1 volume of chloroform and 1 volume of water were added, vortexed for 5 min and centrifuged at 13000 rpm with 4 °C for 10 minutes, and then 50 μl chloroform layer was dried with nitrogen. Finally, the residue was reconstituted with 100 μl isopropanol-acetonitrile-water (2:1:1, v/v/v), and the supernatant was prepared to be tested with 10 µL of each supernatant were mixed to generate a pooled quality control (QC) sample.
UPLC–MS/MS conditions
The UPLC–MS/MS analysis was carried out using an Agilent 1290 Infinity system together with an Agilent 6538 UHD Quadrupole Time-of-Flight mass spectrometer (Agilent, USA). For metabolic analysis, chromatographic separations were performed on an X Bridge® BEH Amide column (2.1 mm*100 mm* 2.5 µm, Waters) at a column oven temperature of 30 °C. The initial mobile phase was a mixture of 98% phase A (0.1% formic acid in water) and 2% phase B (0.1% formic acid in ACN). After injection, the mobile phase was according to the following gradient eluted condition: 0–2 min, 95% B; 2–4 min, 95–89% B; 4–13.5 min, 89% B; 13.5–15 min, 89–66% B; 15–17 min, 66% B then 7 min were required to re-establish the initial conditions. For lipidomic analysis, chromatographic separations were performed at 45 °C on a Waters X BridgeTM BEH C18 analytical column (2.1 mm × 100 mm, 2.5μm, Waters, Milford, MA). The mobile phase consisted of 40:60 water: ACN with 0.1% formic acid and 10 mM Ammonium formate (C) and 9:10:81 ACN: water: isopropanol with 0.1% formic acid and 10 mM Ammonium formate (D). The detailed gradient elution conditions were as follow: 0–3 min, 40–68%D; 3–5 min, 68–70%D; 5–7 min, 70%D; 7–12 min, 70–85%D; 12–15 min, 85–99%D; 15–19 min, 99%D; 19–19.5 min, 99–40%D; 19.5–20 min, 40%D. The flow rate was set to 0.4 ml/min and the auto-sampler was maintained at 4 °C. The injected volume was 3 μL and the samples were randomly run. QC samples were analyzed after every 4 injections to ascertain that the mass spectrometer performance was stable during the analysis of the samples set.
An electrospray ionization source (ESI) was used in both positive and negative ion mode with the ion spray voltage was set to 4000 V and −3500 V respectively. Other parameters were as follows: drying gas flow, 11 L/min; gas temperature, 350 °C; Nebulizer pressure, 45 psig; fragmentor voltage, 120 V; skimmer voltage, 60 V. Octopole RF Peak, 750 V; reference masses (m/z), 121.0509 Da and 922.0098 Da. The MS data were collected in the full scan mode ranging from 50 to 1100 m/z. The biomarker candidates were further analyzed by MS/MS with the collision energy 10, 20 and 40 eV.
Data analysis and statistical analysis
After the UPLC/Q-TOF-MS analysis, the raw data (·d) were converted into a common data format (.mz data) files using Agilent Mass Hunter workstation software version B.01.04 (Agilent, MA, USA) with the isotope interferences being excluded and the intensity threshold was set to 300 to exclude the noise. Then, the data from each polarity were processed using the open-free XCMS53 (http://metlin.scripps.edu/download/) for peak extraction, alignment and integration to generate a visual data matrix. There are 1232 and 370 features in positive and negative mode in metabolomics, while in lipidomics there are 3168 and 267 features in positive and negative mode. Then only molecular entities detected in at least 80% of the samples belonging to at least one of the groups under study (OVX and Sham individuals) were considered. After filtering, there are 633 and 162 features in positive and negative mode in metabolomics, while in lipidomics there are 1571 and 67 features in positive and negative mode. Normalization of all detected ions in each sample were carried out by the peak area of internal standard in each sample to obtain the relative intensity then further normalized by the weight of each sample in metabolomics analysis; while in lipidomics analysis, Normalization procedure was performed by the weight of each sample and then analyzed by peak area normalizing method. Finally, three three-dimensional data matrix, including the sample names, retention times, m/z pairs, and normalized ion intensities, were imported into the SIMCA-P program (version 11.0, Umetrics, Umea, Sweden) for multivariate statistical analysis including principal component analysis (PCA) and partial least squares-discriminant analysis (PLS-DA). The relevant parameters R2X, R2Y, and Q2 of PLS-DA model were monitored to evaluate the goodness of fit and prediction internally and permutation tests were implemented to evaluate the quality of models externally. VIP (variable importance) value, generated in PLS-DA processing, represents the contribution to the group discrimination of each metabolite54. In our study, VIP values of all potential biomarkers should be greater than 1.
All data were expressed by means ± SD. The statistical significance in of mean values was tested using students T-test through SPSS 17.0 program (IBM, New York, USA). Differences were considered to be significant when p values were less than 0.05.
Identification of potential biomarkers
Potential biomarkers were identified as the previous report54. The ions were confirmed based on the extracted ion chromatogram (EIC) and then compared MS and MS/MS information by searching in the METLIN MS and MS/MS database (http://metlin.scripps.edu) and the Human Metabolome Database (http://www.hmdb.ca/). An accuracy error of 10 ppm was set in MS searching and the fragments were verified by MS/MS data; furthermore, the retention times and the fragments of metabolites were compared with those of reference samples to confirm the identification of metabolites. Besides, a part of lipids were tentatively identified based on their characteristic molecular ion information and corresponding fragments of product ion. We take Supplementary Figs S4 and S5 which was validated based on metlin database and their fragment ions to illustrate the identification process.
Conclusions
In this study, bilateral ovariectomy was performed to establish a mouse model of osteoporosis, and UPLC/Q-TOF-MS based lipidomics in combination with polar metabolomics were used to build a comprehensive metabolic profile of the mouse femur, showing an overall change from lipid metabolites to polar metabolites. We found there were 11 polar metabolites and 93 lipid metabolites that were significantly changed. These metabolites are involved in amino acid metabolism, nucleotide metabolism and lipid metabolism. Among the lipids, fatty acyls, glycerolipids, glycerophospholipids, sphingolipids and sterols were altered. These dysregulated metabolic pathways, especially lipid metabolism, revealed a series of metabolic disorders caused by changes in the hormone levels after ovariectomy and are related to the imbalance between bone resorption and formation. The lipidomics in combination with polar metabolomics methods used in this study show good applicability and wide coverage in the metabolic profile of bone tissue, especially for the lipidomics profile, and fill the gap in the field of bone tissue metabolite analysis. Furthermore, the metabolite information of the OVX mouse bone tissue obtained in this study provides a foundation for understanding the differentially regulated pathways and mechanisms of PMOP.
Electronic supplementary material
Acknowledgements
This study was supported in part by Grants from the National Scientific Foundation of China (91749204) and National Scientific Foundation of China (81771491). The authors would like to thank the Student in incubator of Second Military University Shanghai 200120,R.P China.(FH2017084) for their support in this research.
Author Contributions
Hongxia Zhao wrote the main manuscript text and prepared Figs 2, 3, 8, S1, Tables 1, 2; Xiaoqun Li did the animal experiments and prepared Fig. 1; Dianying Zhang Haiyan prepared Figs S4, 5; Chen did the sample preparation, instrument analysis; Yufan Chao and Kaiwen Wu did the data analysis and prepared Figs 4–7, S2, 3, Table S1; Dianying Zhang, Xin Dong and Jiacan Su designed the research and experiment.
Competing Interests
The authors declare no competing interests.
Footnotes
Publisher’s note: Springer Nature remains neutral with regard to jurisdictional claims in published maps and institutional affiliations.
Hongxia Zhao, Xiaoqun Li and Dianying Zhang contributed equally.
Contributor Information
Xin Dong, Email: dongxinsmmu@126.com.
Jiacan Su, Email: drsujiacan@163.com.
Electronic supplementary material
Supplementary information accompanies this paper at 10.1038/s41598-018-34574-6.
References
- 1.Lock CA, Lecouturier J, Mason JM, Dickinson HO. Lifestyle interventions to prevent osteoporotic fractures: a systematic review. Osteoporosis international. 2006;17:20–28. doi: 10.1007/s00198-005-1942-0. [DOI] [PubMed] [Google Scholar]
- 2.Qin L, et al. Age-related vessel calcification at distal extremities is a risk factor of osteoporosis. Journal of Orthopaedic Translation. 2014;2:43–48. doi: 10.1016/j.jot.2013.12.001. [DOI] [Google Scholar]
- 3.Al-Anazi AF, Qureshi VF, Javaid K, Qureshi S. Preventive effects of phytoestrogens against postmenopausal osteoporosis as compared to the available therapeutic choices: An overview. Journal of natural science, biology, and medicine. 2011;2:154. doi: 10.4103/0976-9668.92322. [DOI] [PMC free article] [PubMed] [Google Scholar]
- 4.Harvey N, Dennison E, Cooper C. Osteoporosis: impact on health and economics. Nature Reviews Rheumatology. 2010;6:99–105. doi: 10.1038/nrrheum.2009.260. [DOI] [PubMed] [Google Scholar]
- 5.Feng X, McDonald JM. Disorders of bone remodeling. Annual Review of Pathology: Mechanisms of Disease. 2011;6:121–145. doi: 10.1146/annurev-pathol-011110-130203. [DOI] [PMC free article] [PubMed] [Google Scholar]
- 6.Sims SM, Panupinthu N, Lapierre DM, Pereverzev A, Dixon SJ. Lysophosphatidic acid: A potential mediator of osteoblast–osteoclast signaling in bone. Biochimica et Biophysica Acta (BBA)-Molecular and Cell Biology of Lipids. 2013;1831:109–116. doi: 10.1016/j.bbalip.2012.08.001. [DOI] [PubMed] [Google Scholar]
- 7.Nicholson JK, Lindon JC, Holmes E. ‘Metabonomics’: understanding the metabolic responses of living systems to pathophysiological stimuli via multivariate statistical analysis of biological NMR spectroscopic data. Xenobiotica. 1999;29:1181–1189. doi: 10.1080/004982599238047. [DOI] [PubMed] [Google Scholar]
- 8.Zhang A, Sun H, Wang X. Serum metabolomics as a novel diagnostic approach for disease: a systematic review. Analytical and bioanalytical chemistry. 2012;404:1239–1245. doi: 10.1007/s00216-012-6117-1. [DOI] [PubMed] [Google Scholar]
- 9.Kang J, Zhu L, Lu J, Zhang X. Application of metabolomics in autoimmune diseases: insight into biomarkers and pathology. Journal of neuroimmunology. 2015;279:25–32. doi: 10.1016/j.jneuroim.2015.01.001. [DOI] [PubMed] [Google Scholar]
- 10.Smilde A, et al. Dynamic metabolomic data analysis: a tutorial review. Metabolomics. 2010;6:3–17. doi: 10.1007/s11306-009-0191-1. [DOI] [PMC free article] [PubMed] [Google Scholar]
- 11.Wu C, et al. Disordered glycometabolism involved in pathogenesis of Kashin–Beck disease, an endemic osteoarthritis in China. Experimental cell research. 2014;326:240–250. doi: 10.1016/j.yexcr.2014.04.019. [DOI] [PubMed] [Google Scholar]
- 12.Zhu W, et al. Metabolomic study of the bone trabecula of osteonecrosis femoral head patients based on UPLC–MS/MS. Metabolomics. 2016;12:48. doi: 10.1007/s11306-016-0965-1. [DOI] [Google Scholar]
- 13.Zhu X, et al. Metabolomics in serum of ovariectomised rats and those exposed to 17β-oestradiol and genistein. Gynecological Endocrinology. 2010;26:760–767. doi: 10.3109/09513590.2010.487615. [DOI] [PubMed] [Google Scholar]
- 14.Wishart DS. Emerging applications of metabolomics in drug discovery and precision medicine. Nature Reviews Drug Discovery. 2016;15:473–484. doi: 10.1038/nrd.2016.32. [DOI] [PubMed] [Google Scholar]
- 15.Liu Y-R, et al. 1 H-NMR and HPLC–MS/MS-based global/targeted metabolomic evaluation of Hypericum perforatum L. intervention for menopause. Journal of Functional Foods. 2015;17:722–741. doi: 10.1016/j.jff.2015.06.023. [DOI] [Google Scholar]
- 16.Yang K, Han X. Lipidomics: techniques, applications, and outcomes related to biomedical sciences. Trends in biochemical sciences. 2016;41:954–969. doi: 10.1016/j.tibs.2016.08.010. [DOI] [PMC free article] [PubMed] [Google Scholar]
- 17.Qin L, et al. A 1HNMR-Based Metabonomics Study of Postmenopausal Osteoporosis and Intervention Effects of Er-Xian Decoction in Ovariectomized Rats. International journal of molecular sciences. 2011;12:7635–7651. doi: 10.3390/ijms12042275. [DOI] [PMC free article] [PubMed] [Google Scholar]
- 18.Qi H, et al. Association between the metabolome and bone mineral density in pre-and post-menopausal Chinese women using GC-MS. Molecular BioSystems. 2016;12:2265–2275. doi: 10.1039/C6MB00181E. [DOI] [PubMed] [Google Scholar]
- 19.Cabrera Diana, Kruger Marlena, Wolber Frances, Roy Nicole, Totman John, Henry Christiani, Cameron-Smith David, Fraser Karl. Association of Plasma Lipids and Polar Metabolites with Low Bone Mineral Density in Singaporean-Chinese Menopausal Women: A Pilot Study. International Journal of Environmental Research and Public Health. 2018;15(5):1045. doi: 10.3390/ijerph15051045. [DOI] [PMC free article] [PubMed] [Google Scholar]
- 20.Nordström A, O’Maille G, Qin C, Siuzdak G. Nonlinear data alignment for UPLC− MS and HPLC− MS based metabolomics: quantitative analysis of endogenous and exogenous metabolites in human serum. Analytical chemistry. 2006;78:3289–3295. doi: 10.1021/ac060245f. [DOI] [PMC free article] [PubMed] [Google Scholar]
- 21.Han X, Gross RW. Global analyses of cellular lipidomes directly from crude extracts of biological samples by ESI mass spectrometry a bridge to lipidomics. Journal of lipid research. 2003;44:1071–1079. doi: 10.1194/jlr.R300004-JLR200. [DOI] [PubMed] [Google Scholar]
- 22.Han X. Lipidomics: developments and applications. Journal of chromatography. B, Analytical technologies in the biomedical and life sciences. 2009;877:2663. doi: 10.1016/j.jchromb.2009.07.007. [DOI] [PMC free article] [PubMed] [Google Scholar]
- 23.Xu Lijun, Zhang Lixia, Wang Zhifang, Li Chong, Li Shan, Li Li, Fan Qianying, Zheng Lili. Melatonin Suppresses Estrogen Deficiency-Induced Osteoporosis and Promotes Osteoblastogenesis by Inactivating the NLRP3 Inflammasome. Calcified Tissue International. 2018;103(4):400–410. doi: 10.1007/s00223-018-0428-y. [DOI] [PubMed] [Google Scholar]
- 24.Liu Y, et al. Hydrogen sulfide maintains mesenchymal stem cell function and bone homeostasis via regulation of Ca(2+) channel sulfhydration. Cell stem cell. 2014;15:66–78. doi: 10.1016/j.stem.2014.03.005. [DOI] [PMC free article] [PubMed] [Google Scholar]
- 25.Kalu DN. The ovariectomized rat model of postmenopausal bone loss. Bone and mineral. 1991;15:175–191. doi: 10.1016/0169-6009(91)90124-I. [DOI] [PubMed] [Google Scholar]
- 26.Aa J. Data processing method for metabolomics—Principal component analysis. Chinese Journal of Clinical Pharmacology and Therapeutics. 2010;15:481–489. [Google Scholar]
- 27.Serviere C, Fabry P. Principal component analysis and blind source separation of modulated sources for electro-mechanical systems diagnostic. Mechanical systems and signal processing. 2005;19:1293–1311. doi: 10.1016/j.ymssp.2005.08.001. [DOI] [Google Scholar]
- 28.Psihogios NG, Gazi IF, Elisaf MS, Seferiadis KI, Bairaktari ET. Gender‐related and age‐related urinalysis of healthy subjects by NMR‐based metabonomics. NMR in Biomedicine. 2008;21:195–207. doi: 10.1002/nbm.1176. [DOI] [PubMed] [Google Scholar]
- 29.Liu Z, Jeppesen PB, Gregersen S, Chen X, Hermansen K. Dose-and glucose-dependent effects of amino acids on insulin secretion from isolated mouse islets and clonal INS-1E beta-cells. The review of diabetic studies: RDS. 2008;5:232. doi: 10.1900/RDS.2008.5.232. [DOI] [PMC free article] [PubMed] [Google Scholar]
- 30.Yang J, Zhang X, Wang W, Liu J. Insulin stimulates osteoblast proliferation and differentiation through ERK and PI3K in MG‐63 cells. Cell biochemistry and function. 2010;28:334–341. doi: 10.1002/cbf.1668. [DOI] [PubMed] [Google Scholar]
- 31.Zhang W, et al. Effects of insulin and insulin‐like growth factor 1 on osteoblast proliferation and differentiation: differential signalling via Akt and ERK. Cell biochemistry and function. 2012;30:297–302. doi: 10.1002/cbf.2801. [DOI] [PubMed] [Google Scholar]
- 32.Ma, T. et al. Simple 3,4-Dihydroxy-L-Phenylalanine Surface Modification Enhances Titanium Implant Osseointegration in Ovariectomized Rats. Scientific reports7, 10.1038/s41598-017-18173-5 (2017). [DOI] [PMC free article] [PubMed]
- 33.Yoshida M, Sato H, Ishida Y, Nakagawa H, Doi T. Scalable solution-phase synthesis of the biologically active cyclodepsipeptide destruxin E, a potent negative regulator of osteoclast morphology. The Journal of organic chemistry. 2014;79:296–306. doi: 10.1021/jo402437z. [DOI] [PubMed] [Google Scholar]
- 34.Jennings A, MacGregor A, Spector T, Cassidy A. Amino acid intakes are associated with bone mineral density and prevalence of low bone mass in women: evidence from discordant monozygotic twins. Journal of Bone and Mineral Research. 2016;31:326–335. doi: 10.1002/jbmr.2703. [DOI] [PMC free article] [PubMed] [Google Scholar]
- 35.Chevalley T, Rizzoli R, Manen D, Caverzasio J, Bonjour J-P. Arginine increases insulin-like growth factor-I production and collagen synthesis in osteoblast-like cells. Bone. 1998;23:103–109. doi: 10.1016/S8756-3282(98)00081-7. [DOI] [PubMed] [Google Scholar]
- 36.Fujita S, Volpi E. Amino acids and muscle loss with aging. The Journal of nutrition. 2006;136:277S–280S. doi: 10.1093/jn/136.1.277S. [DOI] [PMC free article] [PubMed] [Google Scholar]
- 37.Wang Q, Tang A. Phenylalanine metabolic disorders and diseases. Foreign Medical Sciences Section of Pathophysiology and Clinical Medicine. 2001;21:451–453. [Google Scholar]
- 38.Mitsuya H, et al. an antiviral agent that inhibits the infectivity and cytopathic effect of human T-lymphotropic virus type Ill/lymphadenopathy-associated virus in vitro. Proc. Nati. Acad. Sci. USA. 1985;82:7096–7100. doi: 10.1073/pnas.82.20.7096. [DOI] [PMC free article] [PubMed] [Google Scholar]
- 39.Xie F, Zhao H, Zhao L, Lou L, Hu Y. Synthesis and biological evaluation of novel 2, 4, 5-substituted pyrimidine derivatives for anticancer activity. Bioorganic & medicinal chemistry letters. 2009;19:275–278. doi: 10.1016/j.bmcl.2008.09.067. [DOI] [PubMed] [Google Scholar]
- 40.Ihn HJ, et al. OCLI-023, a Novel Pyrimidine Compound, Suppresses Osteoclastogenesis In Vitro and Alveolar Bone Resorption In Vivo. PLoS ONE. 2017;12:e0170159. doi: 10.1371/journal.pone.0170159. [DOI] [PMC free article] [PubMed] [Google Scholar]
- 41.Ma B, et al. GC-TOF/MS-based metabolomic profiling of estrogen deficiency-induced obesity in ovariectomized rats. Acta Pharmacologica Sinica. 2011;32:270–278. doi: 10.1038/aps.2010.196. [DOI] [PMC free article] [PubMed] [Google Scholar]
- 42.Xue L, et al. A 1HNMR-based metabonomics study of postmenopausal osteoporosis and intervention effects of er-xian decoction in ovariectomized rats. International journal of molecular sciences. 2011;12:7635–7651. doi: 10.3390/ijms12117635. [DOI] [PMC free article] [PubMed] [Google Scholar]
- 43.Lv H, et al. Metabolomics and Its Application in the Development of Discovering Biomarkers for Osteoporosis Research. International journal of molecular sciences. 2016;17:2018. doi: 10.3390/ijms17122018. [DOI] [PMC free article] [PubMed] [Google Scholar]
- 44.YAMAGUCHI T, et al. Plasma lipids and osteoporosis in postmenopausal women. Endocrine journal. 2002;49:211–217. doi: 10.1507/endocrj.49.211. [DOI] [PubMed] [Google Scholar]
- 45.Liu X, et al. Metabonomic study on the anti-osteoporosis effect of Rhizoma Drynariae and its action mechanism using ultra-performance liquid chromatography–tandem mass spectrometry. Journal of ethnopharmacology. 2012;139:311–317. doi: 10.1016/j.jep.2011.11.017. [DOI] [PubMed] [Google Scholar]
- 46.Sánchez-Rodríguez MA, Ruiz-Ramos M, Correa-Muñoz E, Mendoza-Núñez VM. Oxidative stress as a risk factor for osteoporosis in elderly Mexicans as characterized by antioxidant enzymes. BMC musculoskeletal disorders. 2007;8:124. doi: 10.1186/1471-2474-8-124. [DOI] [PMC free article] [PubMed] [Google Scholar]
- 47.Spiegel S, Merrill A. Sphingolipid metabolism and cell growth regulation. The FASEB Journal. 1996;10:1388–1397. doi: 10.1096/fasebj.10.12.8903509. [DOI] [PubMed] [Google Scholar]
- 48.Seito N, et al. Interruption of glycosphingolipid synthesis enhances osteoarthritis development in mice. Arthritis & Rheumatology. 2012;64:2579–2588. doi: 10.1002/art.34463. [DOI] [PMC free article] [PubMed] [Google Scholar]
- 49.Fukumoto S, et al. Current topics in pharmacological research on bone metabolism: osteoclast differentiation regulated by glycosphingolipids. Journal of pharmacological sciences. 2006;100:195–200. doi: 10.1254/jphs.FMJ05004X3. [DOI] [PubMed] [Google Scholar]
- 50.Hannun YA. The sphingomyelin cycle and the second messenger function of ceramide. Journal of Biological Chemistry-Paper Edition. 1994;269:3125–3128. [PubMed] [Google Scholar]
- 51.Suda T, Takahashi F, Takahashi N. Bone effects of vitamin D–Discrepancies between in vivo and in vitro studies. Archives of biochemistry and biophysics. 2012;523:22–29. doi: 10.1016/j.abb.2011.11.011. [DOI] [PubMed] [Google Scholar]
- 52.Wu X, et al. Caffeic acid 3, 4‐dihydroxy‐phenethyl ester suppresses receptor activator of NF‐κB ligand–induced osteoclastogenesis and prevents ovariectomy‐induced bone loss through inhibition of mitogen‐activated protein kinase/activator protein 1 and Ca2+ - nuclear factor of activated T‐cells cytoplasmic 1 signaling pathways. Journal of Bone and Mineral Research. 2012;27:1298–1308. doi: 10.1002/jbmr.1576. [DOI] [PubMed] [Google Scholar]
- 53.Smith CA, Want EJ, O’Maille G, Abagyan R, Siuzdak G. XCMS: processing mass spectrometry data for metabolite profiling using nonlinear peak alignment, matching, and identification. Analytical chemistry. 2006;78:779–787. doi: 10.1021/ac051437y. [DOI] [PubMed] [Google Scholar]
- 54.Su L, Zhao H, Zhang X, Lou Z, Dong X. UHPLC-Q-TOF-MS based serum metabonomics revealed the metabolic perturbations of ischemic stroke and the protective effect of RKIP in rat models. Molecular BioSystems. 2016;12:1831–1841. doi: 10.1039/C6MB00137H. [DOI] [PubMed] [Google Scholar]
Associated Data
This section collects any data citations, data availability statements, or supplementary materials included in this article.


