

Abstract
Background
Heart failure (HF) with reduced ejection fraction (rEF) is a widely regarded prognosticator after coronary artery bypass grafting. HF with preserved ejection fraction (pEF) accounts for up to half of all HF cases and is associated with considerable morbidity and mortality in hospitalized cohorts. However, HFpEF outcomes have not been elucidated in cardiac surgical patients. We investigated the prevalence and outcomes of HFpEF and HFrEF in women and men following coronary artery bypass grafting.
Methods and Results
We conducted a retrospective cohort study in Ontario, Canada, between October 1, 2008, and March 31, 2015, using Cardiac Care Network and Canadian Institute of Health Information data. HF is captured through a validated population‐based database of all Ontarians with physician‐diagnosed HF. We defined pEF as ejection fraction ≥50% and rEF as ejection fraction <50%. The primary outcome was all‐cause mortality. Analyses were stratified by sex. Mortality rates were calculated using Kaplan–Meier method. The relative hazard of death was assessed using multivariable Cox proportional hazard models. Of 40 083 patients (20.6% women), 55.5% had pEF without HF, 25.7% had rEF without HF, 6.9% had HFpEF, and 12.0% had HFrEF. Age‐standardized HFpEF mortality rates at 4±2 years of follow‐up were similar in women and men. HFrEF standardized HFpEF mortality rates were higher in women than men.
Conclusions
We found a higher prevalence and poorer prognosis of HFpEF in women. A history of HF was a more important prognosticator than ejection fraction. Preoperative screening and extended postoperative follow‐up should be focused on women and men with HF rather than on rEF alone.
Keywords: coronary artery bypass graft surgery, ejection fraction, heart failure, heart failure with preserved ejection fraction, heart failure with reduced ejection fraction, mortality, prognosis, sex
Subject Categories: Heart Failure, Revascularization, Women, Mortality/Survival
Clinical Perspective
What Is New?
In a population‐based retrospective cohort study of patients undergoing isolated primary coronary artery bypass grafting, we observed a higher prevalence of heart failure with preserved ejection fraction in women.
In addition, both the operative and long‐term mortality rates were higher in women with heart failure with preserved ejection fraction.
What Are the Clinical Implications?
Our findings highlight the need for a paradigm shift in Western countries to improve the preoperative screening of heart failure symptoms, regardless of ejection fraction.
Specifically, further studies are required to incorporate heart failure into cardiac surgical mortality prediction scores.
Women and men with heart failure with preserved ejection fraction should be the target of extended postoperative follow‐up and personally tailored interventions.
Introduction
Heart failure (HF) is a known complication of coronary artery disease (CAD) that is commonly treated with coronary artery bypass grafting (CABG). HF with reduced ejection fraction (HFrEF) is a widely accepted risk factor for operative and long‐term mortality1, 2 and has been the focus of perioperative screening and optimization.3, 4 HF with preserved ejection fraction (HFpEF) is nearly as prevalent and fatal as HFrEF5, 6 but is poorly recognized in the perioperative realm.
The diagnosis of HFpEF is based on the presence of signs and symptoms of HF and left ventricular ejection fraction (EF) of ≥50%.7 There is regional variability in the prevalence of CAD in patients with HFpEF.5, 8, 9 In addition, population‐based reports suggest that HFpEF can be associated with CAD and is more prevalent in elderly women with a history of hypertension or diabetes mellitus.10 Despite the importance of HFpEF,11, 12 its epidemiology has not been elucidated in the diverse ethnic mix of surgical patients in North America, nor have sex‐stratified analyses of long‐term outcomes of patients with HFpEF who have undergone CABG ever been performed. We investigated the prevalence and prognosis of HFpEF and HFrEF in men and women who underwent CABG in Ontario, Canada, from 2008 to 2015.
Methods
Design and Study Population
We conducted a population‐based, retrospective cohort study in Ontario, Canada, between October 1, 2008, and March 31, 2015. The research ethics board of Sunnybrook Health Sciences, Toronto, Canada, approved this study and waived the need for informed consent. The data, analytic methods, and study materials will not be made available to other researchers for purposes of reproducing the results or replicating the procedure.
Included were adult patients 40 years and older who underwent primary isolated CABG in Ontario. We excluded patients who were non‐Ontario residents, who had a history of cardiac surgery, or who had missing information regarding age, sex, and left ventricular EF (Figure 1). During the study period, Ontario was Canada's most populous province with a public‐funded universal healthcare system that reimbursed all healthcare providers and services.
Figure 1.
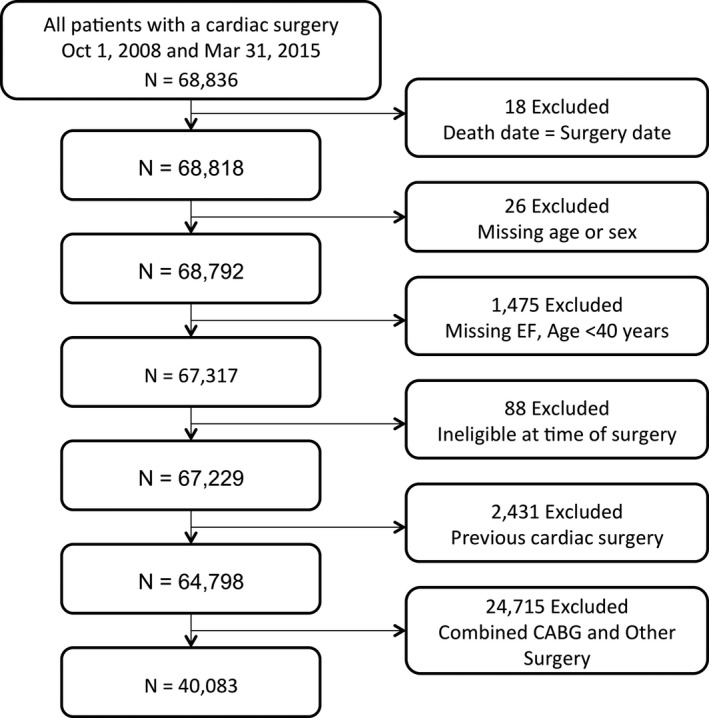
Cohort flowchart. CABG indicates coronary artery bypass grafting; EF, ejection fraction.
Data Sources
The authors used the registry data of the CorHealth Ontario and population‐level administrative healthcare databases with information on all Ontario residents available at the Institute for Clinical Evaluative Sciences (ICES). Individuals who underwent primary isolated CABG were identified from the CorHealth Ontario registry. The CorHealth Ontario registry is a network of 18 hospitals that maintains a detailed prospective clinical registry of all patients who undergo invasive cardiac procedures in Ontario. It captures demographic, comorbidity, and procedural‐related information and has been validated through selected chart audits. In addition, CorHealth Ontario registry EF and angiographic data undergo core laboratory validation.13
Administrative databases were linked deterministically using encrypted unique confidential codes that preserved patient confidentiality. The authors first linked the CorHealth Ontario registry (date and type of cardiac procedures, left ventricular function data) with the ICES Congestive Heart Failure database to classify patients with CABG by EF and HF status. The database is derived from physician billings based on either 1 documented admission for HF alone or 1 outpatient claim for HF that was followed by at least 1 additional outpatient HF claim within 1 year. This algorithm was validated in primary care patient records and shown to have 85% sensitivity and 97% specificity in identifying HF events.14 These data were then linked to the Canadian Institute for Health Information's Discharge Abstract Database (DAD; comorbidities and hospital admissions) and Same Day Surgery (SDS) database (comorbidities), Ontario Health Insurance Plan (OHIP) database (physician service claims), Registered Persons Database (RPDB; ascertainment of vital statistics), and Canadian census. While lacking physiologic and laboratory measures, these administrative databases have been validated for many outcomes, exposures, and comorbidities.15, 16, 17, 18
Classification of HF by Left Ventricular Function
Preoperative EF was obtained from the CorHealth Ontario registry and classified as preserved EF (pEF) if EF was ≥50% and reduced EF (rEF) if EF was <50%. The authors then categorized patients into 4 groups by EF and HF status: HFpEF, HFrEF, pEF without HF, and rEF without HF.
Covariates
Comorbidities were identified from the CorHealth Ontario registry and supplemented with data from DAD, SDS, and OHIP using International Classification of Diseases––10th Revision (ICD‐10) codes19 within 5 years before CABG and using validated algorithms (eg, chronic obstructive pulmonary disease [COPD], asthma, hypertension, diabetes mellitus).15, 17, 20, 21 We estimated socioeconomic status based on patients’ neighborhood median income in the Canadian census and determined their residence (rural versus urban) using Statistics Canada definitions.22 Emergent procedural status was ascertained from the CorHealth Ontario registry and supplemented with OHIP claims data, where the anesthesia provider identified the surgery as emergent under the American Society of Anesthesiologists physical status classification. Height, weight, and body mass index identified from the CorHealth Ontario registry were used to define morbid obesity (weight >159 kg or body mass index ≥40 kg/m2). Frailty status was identified using the Johns Hopkins Adjusted Clinical Groups frailty‐defining diagnoses indicator, which is an instrument designed and validated for research of frailty‐related outcomes and resource utilization using administrative data.23, 24, 25, 26, 27
Outcome
The primary outcome was death from any cause. We confirmed in‐hospital mortality using the DAD and post‐discharge mortality using RPDB.
Statistical Analysis
L.Y.S. and A.B.E. had full access to all of the data in the study and take responsibility for its integrity and for the data analysis. All analyses were performed in the overall cohort and then stratified by sex. Continuous variables were expressed as mean (SD) and categorical variables as number (proportions). Mortality was assessed at 30 days postoperatively and through March 31, 2016. Patients were censored at the front end when they lost possession of a valid Ontario health insurance card for 2 consecutive eligibility quarters (ie, have left the province of Ontario). Survival time was defined as date of index surgery until date of death or date of last follow‐up. Event rates in each group were calculated using the Kaplan–Meier method and presented graphically, with the significance of differences in mortality between groups assessed using the log‐rank test. Sex‐specific long‐term mortality rates were standardized by age, and pooled long‐term mortality rates were standardized by age and sex using the 2011 Canadian population as the reference. The risk of death was assessed using Cox proportional hazard models with multivariable adjustment. We explored the modifying effect of sex and identified sex‐specific risk factors for long‐term mortality using multiplicative interaction terms.
We performed 2 sensitivity analyses. First, we used generalized estimating equations to determine the adjusted association of patient‐level characteristics with 30‐day and long‐term mortality while accounting for clustering of patients within hospitals.28 Next, we added completeness of revascularization to this generalized estimating equations model to evaluate the impact of incomplete revascularization on early and long‐term mortality. Incomplete revascularization was defined as presence of ≥1 ungrafted vessels with ≥70% stenosis in the left anterior descending, circumflex, or right coronary artery territories.
The measure of association was hazard ratios (HRs) with 95% confidence intervals (CIs). Analyses were performed using SAS 9.3 (SAS Institute), with statistical significance defined by a 2‐sided P value of <0.05.
Results
Prevalence of pEF and rEF
A total of 40 083 consecutive patients who underwent CABG from 2008 to 2015 were included in the study. Of these patients, 8248 (20.6%) were women. Demographics and comorbidities of patients with pEF and rEF with and without HF are summarized in Table 1. Overall, 22 231 patients (55.5%) had pEF and no HF, 10 284 patients (25.7%) had rEF and no HF, 2752 patients (6.9%) had HFpEF, and 4816 patients (12.0%) had HFrEF. Patients with HF were older, were more likely to be female, were of lower income status, had hypertension, and had atrial fibrillation, cerebral and peripheral vascular disease, chronic pulmonary disease, diabetes mellitus, hypothyroidism, anemia, or renal and liver disease.
Table 1.
Baseline Characteristics by HF Status
| Variable | pEF, No HF (n=22 231) | rEF, No HF (n=10 284) | HFpEF (n=2752) | HFrEF (n=4816) | Total (N=40 083) | P Value |
|---|---|---|---|---|---|---|
| Age, mean±SD, y | 65.3±9.7 | 65.0±10.0 | 69.5±9.3 | 68.0±9.9 | 65.8±9.9 | <0.001 |
| 40 to 64 | 10 197 (45.9) | 4883 (47.5) | 815 (29.6) | 1730 (35.9) | 17 625 (44.0) | <0.001 |
| 65 to 74 | 7838 (35.3) | 3436 (33.4) | 1015 (36.9) | 1680 (34.9) | 13 969 (34.9) | |
| 75 to 84 | 3937 (17.7) | 1829 (17.8) | 843 (30.6) | 1264 (26.2) | 7873 (19.6) | |
| ≥85 | 259 (1.2) | 136 (1.3) | 79 (2.9) | 142 (2.9) | 616 (1.5) | |
| Women | 4695 (21.1) | 1590 (15.5) | 873 (31.7) | 1090 (22.6) | 8248 (20.6) | <0.001 |
| Rural | 3373 (15.2) | 1670 (16.2) | 403 (14.6) | 685 (14.2) | 6131 (15.3) | 0.036 |
| Income quintile | ||||||
| 1 (Lowest) | 4010 (18.0) | 1963 (19.1) | 584 (21.2) | 1061 (22.0) | 7618 (19.0) | <0.001 |
| 2 | 4473 (20.1) | 2036 (19.8) | 614 (22.3) | 1054 (21.9) | 8177 (20.4) | |
| 3 | 4485 (20.2) | 2096 (20.4) | 552 (20.1) | 942 (19.6) | 8075 (20.1) | |
| 4 | 4579 (20.6%) | 2179 (21.2%) | 532 (19.3%) | 877 (18.2%) | 8167 (20.4%) | |
| 5 (Highest) | 4578 (20.6) | 1947 (18.9) | 459 (16.7) | 848 (17.6) | 7832 (19.5) | |
| Missing | 106 (0.5) | 63 (0.6) | 11 (0.4) | 34 (0.7) | 214 (0.5) | |
| Remote MI | 3958 (17.8) | 3408 (33.1) | 917 (33.3) | 2072 (43.0) | 10 355 (25.8) | <0.001 |
| Recent MI | 7509 (33.8) | 6033 (58.7) | 1418 (51.5) | 3255 (67.6) | 18 215 (45.4) | <0.001 |
| Previous PCI | 3210 (14.4) | 1759 (17.1) | 542 (19.7) | 776 (16.1) | 6287 (15.7) | <0.001 |
| Hypertension | 19 275 (86.7) | 8717 (84.8) | 2610 (94.8) | 4427 (91.9) | 35 029 (87.4) | <0.001 |
| Atrial fibrillation | 968 (4.4) | 563 (5.5) | 433 (15.7) | 791 (16.4) | 2755 (6.9) | <0.001 |
| Cerebral vascular disease | 1999 (9.0) | 965 (9.4) | 413 (15.0) | 675 (14.0) | 4052 (10.1) | <0.001 |
| Peripheral vascular disease | 2306 (10.4) | 1197 (11.6) | 579 (21.0) | 1047 (21.7) | 5129 (12.8) | <0.001 |
| COPD/asthma | 5599 (25.2) | 2660 (25.9) | 1090 (39.6) | 1790 (37.2) | 11 139 (27.8) | <0.001 |
| Diabetes mellitus | 9636 (43.3) | 4624 (45.0) | 1626 (59.1) | 3022 (62.7) | 18 908 (47.2) | <0.001 |
| Morbid obesity | 6838 (30.8) | 2815 (27.4) | 954 (34.7) | 1538 (31.9) | 12 145 (30.3) | <0.001 |
| Hypothyroidism | 201 (0.9) | 78 (0.8) | 70 (2.5) | 78 (1.6) | 427 (1.1) | <0.001 |
| Anemia | 555 (2.5) | 280 (2.7) | 318 (11.6) | 492 (10.2) | 1645 (4.1) | <0.001 |
| Dialysis | 257 (1.2) | 141 (1.4) | 177 (6.4) | 268 (5.6) | 843 (2.1) | <0.001 |
| Chronic renal disease | 620 (2.8) | 308 (3.0) | 348 (12.6) | 607 (12.6) | 1883 (4.7) | <0.001 |
| Liver disease | 115 (0.5) | 65 (0.6) | 38 (1.4) | 70 (1.5) | 288 (0.7) | <0.001 |
| Primary tumor | 939 (4.2) | 444 (4.3) | 184 (6.7) | 298 (6.2) | 1865 (4.7) | <0.001 |
| Metastatic tumor | 88 (0.4) | 38 (0.4) | 16 (0.6) | 38 (0.8) | 180 (0.4) | <0.001 |
| Emergent surgery | 873 (3.9) | 959 (9.3) | 169 (6.1) | 590 (12.3) | 2591 (6.5) | <0.001 |
Values are expressed as number (percentage) unless otherwise indicated. COPD indicates chronic obstructive pulmonary disease; HF, heart failure; HFpEF, HF with preserved ejection fraction; HFrEF, HF with reduced ejection fraction; MI, myocardial infarction; PCI, percutaneous coronary intervention; pEF, preserved ejection fraction; rEF, reduced ejection fraction.
Of all patients with HFpEF, 873 (31.7%) were women. Women with HFpEF were more likely than men to be older, of lower income status, to undergo emergent surgery, and to have comorbidities such as recent myocardial infarction (MI), hypertension, COPD/asthma, diabetes mellitus, hypothyroidism, and anemia, but less likely to have undergone percutaneous coronary intervention (PCI) or to have remote MI, atrial fibrillation, morbid obesity, chronic renal disease, and dialysis (Table 2).
Table 2.
Baseline Characteristics of Men and Women With HFpEF and HFrEF
| Variable | HFpEF | HFrEF | P Valuea | ||
|---|---|---|---|---|---|
| Men (n=1879) | Women (n=873) | Men (n=3726) | Women (n=1090) | ||
| Age, mean±SD, y | 68.57±9.50 | 71.41±8.65 | 67.54±10.01 | 69.58±9.43 | <0.001 |
| 40 to 64 | 619 (32.9) | 196 (22.5) | 1406 (37.7) | 324 (29.7) | <0.001 |
| 65 to 74 | 698 (37.1) | 317 (36.3) | 1291 (34.6) | 389 (35.7) | |
| 75 to 84 | 518 (27.6) | 325 (37.2) | 930 (25.0) | 334 (30.6) | |
| ≥85 | 44 (2.3) | 35 (4.0) | 99 (2.7) | 43 (3.9) | |
| Rural residence | 282 (15.0) | 121 (13.9) | 532 (14.3) | 153 (14.0) | 0.64 |
| Income quintile | |||||
| 1 (Lowest) | 346 (18.4) | 238 (27.3) | 800 (21.5) | 261 (23.9) | <0.001 |
| 2 | 422 (22.5) | 192 (22.0) | 810 (21.7) | 244 (22.4) | |
| 3 | 387 (20.6) | 165 (18.9) | 738 (19.8) | 204 (18.7) | |
| 4 | 380 (20.2) | 152 (17.4) | 669 (18.0) | 208 (19.1) | |
| 5 (Highest) | 334 (17.8) | 125 (14.3) | 687 (18.4) | 161 (14.8) | |
| Missing | 10 (0.5) | ≤5 (0.1) | 22 (0.6) | 12 (1.1) | |
| Remote MI | 632 (33.6) | 285 (32.6) | 1618 (43.4) | 454 (41.7) | <0.001 |
| Recent MI | 920 (49.0) | 498 (57.0) | 2444 (65.6) | 811 (74.4) | <0.001 |
| Previous PCI | 387 (20.6) | 155 (17.8) | 599 (16.1) | 177 (16.2) | <0.001 |
| Hypertension | 1766 (94.0) | 844 (96.7) | 3395 (91.1) | 1032 (94.7) | <0.001 |
| Atrial fibrillation | 301 (16.0) | 132 (15.1) | 653 (17.5) | 138 (12.7) | 0.001 |
| Cerebrovascular disease | 283 (15.1) | 130 (14.9) | 514 (13.8) | 161 (14.8) | 0.56 |
| Peripheral vascular disease | 389 (20.7) | 190 (21.8) | 801 (21.5) | 246 (22.6) | 0.69 |
| COPD/asthma | 717 (38.2) | 373 (42.7) | 1345 (36.1) | 445 (40.8) | <0.001 |
| Diabetes mellitus | 1083 (57.6) | 543 (62.2) | 2261 (60.7) | 761 (69.8) | <0.001 |
| Morbid obesity | 710 (37.8) | 244 (27.9) | 1235 (33.1) | 303 (27.8) | <0.001 |
| Hypothyroidism | 29 (1.5) | 41 (4.7) | 47 (1.3) | 31 (2.8) | <0.001 |
| Anemia | 185 (9.8) | 133 (15.2) | 355 (9.5) | 137 (12.6) | <0.001 |
| Dialysis | 128 (6.8) | 49 (5.6) | 205 (5.5) | 63 (5.8) | 0.26 |
| Chronic renal disease | 242 (12.9) | 106 (12.1) | 478 (12.8) | 129 (11.8) | 0.79 |
| Liver disease | 26 (1.4) | 12 (1.4) | 55 (1.5) | 15 (1.4) | 0.99 |
| Primary tumor | 133 (7.1) | 51 (5.8) | 231 (6.2) | 67 (6.1) | 0.52 |
| Metastatic tumor | 14 (0.7) | ≤5 (0.2) | 24 (0.6) | 14 (1.3) | 0.04 |
| Emergent surgery | 107 (5.7) | 62 (7.1) | 431 (11.6) | 159 (14.6) | <0.001 |
Values are expressed as number (percentage) unless otherwise indicated. COPD indicates chronic obstructive pulmonary disease; HF, heart failure; HFpEF, HF with preserved ejection fraction; HFrEF, HF with reduced ejection fraction; MI, myocardial infarction; PCI, percutaneous coronary intervention; pEF, preserved ejection fraction; rEF, reduced ejection fraction.
P values were obtained by using the 1‐way ANOVA test for means and chi‐square test for categorical variables.
Of all patients with HFrEF, 1090 (22.6%) were women. Women with HFrEF were more likely than men to be older, to be of slightly lower income status, to undergo emergent surgery, and to have comorbidities such as recent MI, hypertension, COPD/asthma, diabetes mellitus, hypothyroidism, and anemia, but less likely to have had a remote MI, atrial fibrillation, and morbid obesity (Table 2). Rates of previous PCI were no different between women and men with HFrEF.
30‐Day Mortality
The proportion of deaths at 30 days was highest in patients with HF, especially in those with HFrEF (5.1%; 244 of 4816 patients). Kaplan–Meier survival estimates for each of these groups are illustrated in Figure 2. At 30 days, 90 patients (3.3%) with HFpEF died; this was nearly 5‐fold the proportion of deaths in the group with pEF but no HF (0.7%) and 2.5‐fold that of the group with rEF but no HF (1.3%; Table 3). Similarly, the adjusted risks of 30‐day mortality were higher in patients with HF. After multivariable adjustment of all variables listed in Table 4, the HRs for rEF without HF, HFpEF, and HFrEF were 1.56 (95% CI, 1.23–1.97), 2.60 (95% CI, 1.98–3.40), and 3.92 (95% CI, 3.15–4.90), respectively, compared with those with pEF and no HF. Female sex was associated with a higher risk of mortality at 30 days (adjusted HR, 1.50; 95% CI, 1.26–1.78). The association of sex and early mortality remained robust in the sensitivity analyses that accounted for clustering of patients within hospitals and completeness of revascularization. Of note, incomplete revascularization was associated with a higher risk of early mortality (adjusted HR, 1.24; 95% CI, 1.06–1.46).
Figure 2.
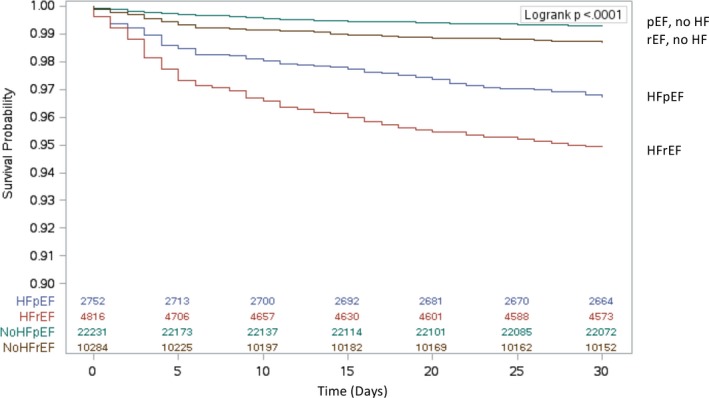
Estimated 30‐day survival after isolated coronary artery bypass grafting surgery by heart failure status (HF) and ejection fraction. HFpEF indicates HF with preserved ejection fraction; HFrEF, HF with reduced ejection fraction; pEF, preserved ejection fraction; rEF, reduced ejection fraction.
Table 3.
Pooled and Sex‐Stratified Event Rates for Death Within 30 Days and in Long‐Term Follow‐Up After Surgery
| Variable | Mortality | HR (95% CI) | ||||
|---|---|---|---|---|---|---|
| Men | Women | Total | Men | Women | Total | |
| 30‐d Mortality, No. (%) | ||||||
| pEF, No HF | 105 (0.6) | 53 (1.1) | 158 (0.7) | Reference | Reference | Reference |
| rEF, No HF | 99 (1.1) | 35 (2.2) | 134 (1.3) | 1.51 (1.14–2) | 1.55 (1–2.41) | 1.52 (1.20–1.93) |
| HFpEF | 45 (2.4) | 45 (5.2) | 90 (3.3) | 2.32 (1.62–3.34) | 2.89 (1.91–4.37) | 2.57 (1.96–3.36) |
| HFrEF | 172 (4.6) | 72 (6.6) | 244 (5.1) | 3.96 (3.03–5.18) | 3.51 (2.38–5.17) | 3.83 (3.07–4.78) |
| Long‐term mortality, per 1000 person‐ya | ||||||
| pEF, No HF | 14 (12–15) | 14 (12–17) | 14 (12–16) | Reference | Reference | Reference |
| rEF, No HF | 20 (18–23) | 23 (18–30) | 22 (18–25) | 1.38 (1.26–1.52) | 1.27 (1.06–1.52) | 1.36 (1.25–1.48) |
| HFpEF | 43 (34–54) | 42 (34–52) | 42 (36–50) | 2.06 (1.82–2.33) | 2.03 (1.7–2.41) | 2.06 (1.86–2.27) |
| HFrEF | 59 (53–66) | 77 (61–95) | 69 (59–80) | 2.87 (2.61–3.15) | 2.54 (2.16–2.98) | 2.78 (2.57–3.02) |
CI indicates confidence interval; HF, heart failure; HFpEF, HF with preserver ejection fraction; HFrEF, HF with reduced ejection fraction; HR, hazard ratio; pEF, preserved ejection fraction; rEF, reduced ejection fraction.
Male and female long‐term mortality rates are standardized by age. Pooled long‐term mortality rates are standardized by age and sex.
Table 4.
Multivariable Predictors of 30‐Day Mortality Post‐CABG in the Pooled Analysis
| Variable | Main Model | Cluster by Site | Completeness of Revascularization Added |
|---|---|---|---|
| HR (95% CI) | HR (95% CI) | HR (95% CI) | |
| HF group | |||
| pEF, No HF | Reference | Reference | Reference |
| rEF, No HF | 1.52 (1.20–1.93) | 1.54 (1.21–1.95) | 1.53 (1.21–1.94) |
| HFpEF | 2.57 (1.96–3.36) | 2.60 (1.99–3.41) | 2.59 (1.98–3.40) |
| HFrEF | 3.83 (3.07–4.78) | 3.87 (3.10–4.83) | 3.84 (3.08–4.79) |
| Age group, y | |||
| 40 to 64 | Reference | Reference | Reference |
| 65 to 74 | 1.54 (1.23–1.92) | 1.53 (1.23–1.91) | 1.52 (1.22–1.89) |
| 75 to 84 | 2.84 (2.28–3.52) | 2.82 (2.27–3.50) | 2.76 (2.22–3.44) |
| ≥85 | 3.86 (2.64–5.66) | 3.80 (2.59–5.57) | 3.62 (2.46–5.31) |
| Sex | 1.50 (1.26–1.78) | 1.49 (1.26–1.78) | 1.49 (1.26–1.78) |
| Rural residence | 0.85 (0.68–1.08) | 0.92 (0.72–1.17) | 0.93 (0.93–1.18) |
| Income quintile | |||
| 1 (Lowest) | 1.22 (0.95–1.56) | 1.20 (0.94–1.54) | 1.21 (0.94–1.54) |
| 2 | 1.04 (0.81–1.34) | 1.02 (0.79–1.31) | 1.02 (0.79–1.31) |
| 3 | 1.10 (0.86–1.42) | 1.09 (0.85–1.40) | 1.09 (0.85–1.40) |
| 4 | 0.90 (0.69–1.18) | 0.91 (0.69–1.19) | 0.91 (0.70–1.19) |
| 5 (Highest) | Reference | Reference | Reference |
| Missing | 0.46 (0.06–3.28) | 0.41 (0.06–2.96) | 0.41 (0.96–2.92) |
| Remote MI | 0.01 (0.76–1.08) | 0.88 (0.74–1.06) | 0.88 (0.74–1.05) |
| Recent MI | 1.73 (1.44–2.09) | 1.77 (1.47–2.13) | 1.75 (1.45–2.12) |
| Previous PCI | 1.16 (0.93–1.44) | 1.17 (0.94–1.45) | 1.18 (0.95–1.47) |
| Hypertension | 1.15 (0.83–1.58) | 1.15 (0.83–1.58) | 1.15 (0.84–1.59) |
| Atrial fibrillation | 1.15 (0.91–1.44) | 1.16 (0.92–1.46) | 1.17 (0.93–1.47) |
| Cerebrovascular disease | 1.35 (1.10–1.66) | 1.36 (1.11–1.67) | 1.36 (1.10–1.67) |
| Peripheral vascular disease | 1.59 (1.32–1.91) | 1.57 (1.30–1.89) | 1.56 (1.29–1.88) |
| COPD/asthma | 1.47 (1.25–1.73) | 1.46 (1.24–1.72) | 1.47 (1.25–1.72) |
| Diabetes mellitus | 0.91 (0.77–1.08) | 0.91 (0.77–1.07) | 0.90 (0.77–1.07) |
| Morbid obesity | 1.10 (0.93–1.31) | 1.09 (0.91–1.30) | 1.09 (0.91–1.29) |
| Hypothyroidism | 0.68 (0.35–1.33) | 0.69 (0.36–1.34) | 0.70 (0.36–1.35) |
| Anemia | 0.99 (0.74–1.31) | 0.99 (0.74–1.31) | 0.98 (0.74–1.31) |
| Chronic renal disease | 1.85 (1.48–2.32) | 1.83 (1.46–2.29) | 1.81 (1.45–2.27) |
| Liver disease | 2.60 (1.49–4.55) | 2.59 (1.48–4.53) | 2.61 (1.49–4.57) |
| Primary tumor | 0.93 (0.66–1.31) | 0.92 (0.65–1.29) | 0.92 (0.65–1.29) |
| Metastatic tumor | 1.48 (0.67–3.28) | 1.57 (0.71–3.49) | 1.58 (0.71–3.52) |
| Emergent surgery | 2.70 (2.22–3.29) | 2.76 (2.27–3.37) | 2.71 (2.22–3.31) |
| Incomplete revascularization (missing) | ··· | ··· | 1.82 (0.99–3.33) |
| Incomplete revascularization (yes) | ··· | ··· | 1.24 (1.06–1.46) |
CABG coronary artery bypass grafting; CI, confidence interval; COPD, chronic obstructive pulmonary disease; HF, heart failure; HFpEF, HF with preserved ejection fraction; HFrEF, HF with reduced ejection fraction; HR, hazard ratio; MI, myocardial infarction; PCI, percutaneous coronary intervention; pEF, preserved ejection fraction; rEF, reduced ejection fraction.
Table 3 and Figure 3 summarize the mortality statistics in men and women. Overall, there was a higher proportion of deaths in women than men in the early postoperative period. Women with HFpEF had double the mortality rate compared with their male counterparts, while women with HFrEF had a mortality rate that was 1.5‐fold that of men. After multivariable adjustment, the early mortality risk was 2.89 (95% CI, 1.91–4.37) in women with HFpEF and 2.32 (95% CI, 1.62–2.34) in men with HFpEF. In patients with HFrEF, the adjusted HR was 3.51 (95% CI, 2.38–5.17) in women and 3.96 (95% CI, 3.03–5.18) in men.
Figure 3.
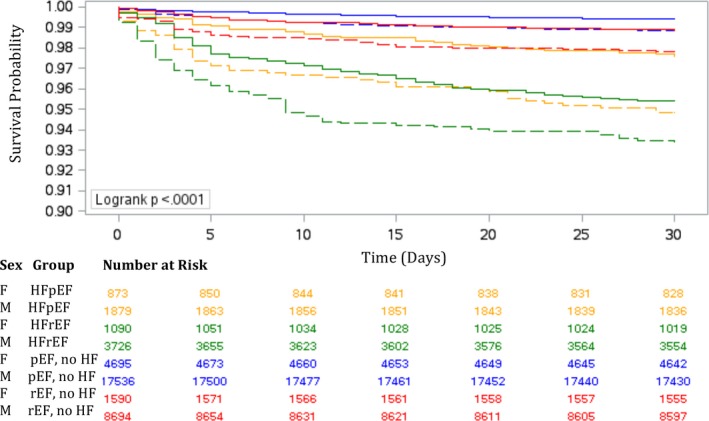
Estimated survival in men and women within 30 days of coronary artery bypass grafting surgery. Estimated survival in men (solid lines) and women (dotted lines) with heart failure (HF) with preserved ejection fraction (HFpEF; golden lines) and HF with reduced ejection fraction (HFrEF; green lines), preserved ejection fraction (pEF) without HF (blue lines), and reduced ejection fraction (rEF) without HF (red lines).
Sex modified the correlation between past PCI and 30‐day mortality (Table 5). Specifically, a history of PCI was correlated with an increased mortality risk in women (adjusted HR, 1.84; 95% CI, 1.30–2.61) but not in men (adjusted HR, 0.89; 95% CI, 0.67–1.18).
Table 5.
Sex‐Specific Risk Factors for 30‐Day and Long‐Term Mortality in Patients Undergoing CABG
| Sex‐Specific HR (95% CI) | Interaction P Value | ||
|---|---|---|---|
| Men | Women | ||
| 30‐d Mortality | |||
| Previous PCI | 0.89 (0.67–1.18) | 1.84 (1.30–2.61) | 0.004 |
| Long‐term mortality | |||
| Age group, y | |||
| 40 to 64 | Reference | Reference | 0.008 |
| 65 to 74 | 1.58 (1.44–1.73) | 1.56 (1.32–1.84) | |
| 75 to 84 | 2.88 (2.62–3.16) | 2.33 (1.97–2.75) | |
| ≥85 | 4.65 (3.87–5.59) | 3.44 (2.55–4.64) | |
| Recent MI | 1.16 (1.08–1.25) | 1.63 (1.42–1.86) | <0.001 |
| COPD/asthma | 1.52 (1.42–1.64) | 1.29 (1.14–1.45) | 0.016 |
| Anemia | 1.17 (1.03–1.34) | 1.48 (1.34–1.77) | 0.037 |
CABG, coronary artery bypass grafting; CI, confidence interval; COPD, chronic obstructive coronary disease; HR, hazard ratio; MI, myocardial infarction; PCI, percutaneous coronary intervention.
Long‐Term Mortality
The mean follow‐up period was 4.0±2.0 years. The median follow‐up time was 3.9 years (interquartile range, 2.3–5.6). The maximum follow‐up period was 7.5 years. The total follow‐up time was 58 081 087 person‐years. During the follow‐up period, a total of 4423 (11.0%) patients died. These deaths included 1440 (6.5%) of pEF without HF, 1037 (10.1%) of rEF without HF, 594 (21.6%) of HFpEF, and 1352 (28.1%) of HFrEF. The Kaplan–Meier survival estimates for each of these groups are illustrated in Figure 4. The age‐ and sex‐standardized long‐term mortality rate per 1000 person‐years was highest in the HFrEF group (69; 95% CI, 59–80). The standardized long‐term mortality rate in patients with HFpEF (42; 95% CI, 36–50) was 3‐fold that of patients with pEF without HF (14; 95% CI, 12–16) and nearly 2‐fold that of rEF without HF (22; 95% CI, 18–25). After multivariable adjustment of all risk factors listed in Table 6 and with pEF without HF as the reference group, the HRs were 1.36 (95% CI, 1.25–1.48) for rEF without HF, 2.06 (95% CI, 1.86–2.27) for HFpEF, and 2.78 (95% CI, 2.57–3.02) for HFrEF. Female sex was associated with a small increase in long‐term mortality risk as compared with men (adjusted HR, 1.07; 95% CI, 1.00–1.14). The association of sex and long‐term mortality remained robust in the sensitivity analyses that accounted for clustering of patients within hospitals and completeness of revascularization. Of note, incomplete revascularization was associated with a higher risk of long‐term mortality (adjusted HR, 1.19; 95% CI, 1.12–1.26).
Figure 4.
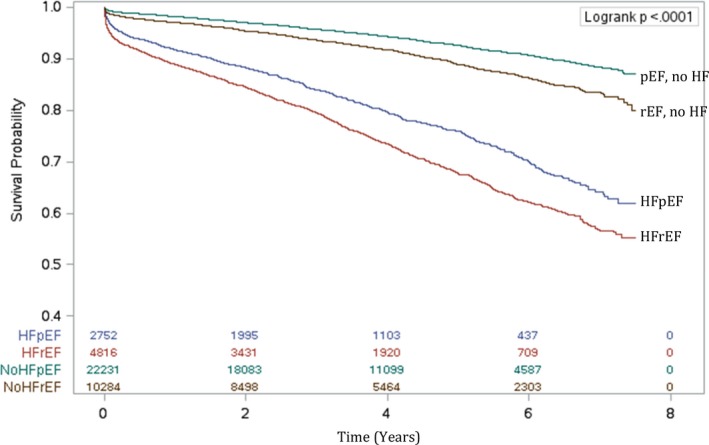
Estimated long‐term survival after isolated coronary artery bypass grafting surgery by heart failure (HF) status and ejection fraction. HFpEF indicates HF with preserved ejection fraction; HFrEF, HF with reduced ejection fraction; pEF, preserved ejection fraction; rEF, reduced ejection fraction.
Table 6.
Multivariable Predictors of Long‐Term Mortality Post‐CABG in the Pooled Analysis
| Variable | Main Model | Cluster by Site | Completeness of Revascularization Added |
|---|---|---|---|
| HR (95% CI) | HR (95% CI) | HR (95% CI) | |
| HF group | |||
| pEF, No HF | Reference | Reference | Reference |
| rEF, No HF | 1.36 (1.25–1.48) | 1.39 (1.28–1.51) | 1.38 (1.27–1.50) |
| HFpEF | 2.06 (1.86–2.27) | 2.05 (1.85–2.27) | 2.05 (1.85–2.26) |
| HFrEF | 2.78 (2.57–3.02) | 2.83 (2.60–3.07) | 2.80 (2.58–3.04) |
| Age group, y | |||
| 40 to 64 | Reference | Reference | Reference |
| 65 to 74 | 1.59 (1.46–1.72) | 1.58 (1.46–1.71) | 1.57 (1.45–1.70) |
| 75 to 84 | 2.75 (2.54–2.98) | 2.74 (2.53–2.97) | 2.70 (2.49–2.93) |
| ≥85 | 4.29 (3.67–5.01) | 4.23 (3.62–4.94) | 4.07 (3.48–4.76) |
| Sex | 1.07 (1.00–1.14) | 1.07 (1.00–1.15) | 1.07 (1.00–1.15) |
| Rural residence | 1.04 (0.96–1.13) | 1.01 (0.93–1.10) | 1.02 (0.93–1.11) |
| Income quintile | |||
| 1 (Lowest) | 1.25 (1.13–1.37) | 1.22 (1.11–1.35) | 1.22 (1.11–1.35) |
| 2 | 1.16 (1.06–1.28) | 1.15 (1.04–1.26) | 1.15 (1.04–1.26) |
| 3 | 1.07 (0.97–1.18) | 1.06 (0.96–1.17) | 1.06 (0.96–1.17) |
| 4 | 1.12 (1.01–1.23) | 1.11 (1.01–1.23) | 1.12 (1.01–1.23) |
| 5 (Highest) | Reference | Reference | Reference |
| Missing | 1.39 (0.89–2.78) | 1.30 (0.83–2.04) | 1.30 (0.83–2.03) |
| Remote MI | 1.13 (1.06–1.20) | 1.13 (1.05–1.20) | 1.13 (1.05–1.20) |
| Recent MI | 1.26 (1.18–1.35) | 1.25 (1.18–1.34) | 1.25 (1.17–1.33) |
| Previous PCI | 0.94 (0.86–1.03) | 0.94 (0.87–1.03) | 0.95 (0.87–1.04) |
| Hypertension | 1.24 (1.09–1.40) | 1.24 (1.09–1.40) | 1.24 (1.10–1.40) |
| Atrial fibrillation | 1.39 (1.28–1.52) | 1.39 (1.28–1.51) | 1.40 (1.29–1.52) |
| Cerebrovascular disease | 1.26 (1.16–1.36) | 1.26 (1.16–1.36) | 1.26 (1.16–1.36) |
| Peripheral vascular disease | 1.81 (1.69–1.94) | 1.78 (1.66–1.91) | 1.77 (1.65–1.90) |
| COPD/asthma | 1.47 (1.38–1.56) | 1.45 (1.37–1.54) | 1.45 (1.37–1.55) |
| Diabetes mellitus | 1.29 (1.21–1.37) | 1.29 (1.21–1.38) | 1.29 (1.21–1.37) |
| Morbid obesity | 1.07 (0.99–1.15) | 1.05 (0.97–1.14) | 1.05 (0.97–1.14) |
| Hypothyroidism | 0.96 (0.77–1.20) | 0.96 (0.76–1.20) | 0.97 (0.77–1.21) |
| Anemia | 1.26 (1.14–1.40) | 1.27 (1.14–1.41) | 1.27 (1.15–1.41) |
| Chronic renal disease | 1.82 (1.66–1.99) | 1.80 (1.65–1.97) | 1.79 (1.64–1.96) |
| Liver disease | 2.52 (2.04–3.13) | 2.54 (2.05–3.14) | 2.55 (2.06–3.16) |
| Primary tumor | 1.81 (1.63–(2.00) | 1.80 (1.62–1.99) | 1.81 (1.63–2.00) |
| Metastatic tumor | 1.79 (1.37–2.33) | 1.76 (1.35–2.30) | 1.77 (1.36–2.32) |
| Emergent surgery | 1.39 (1.26–1.53) | 1.40 (1.27–1.55) | 1.38 (1.25–1.53) |
| Incomplete revascularization (missing) | ··· | ··· | 1.50 (1.15–1.96) |
| Incomplete revascularization (yes) | ··· | ··· | 1.19 (1.12–1.26) |
CI indicates confidence interval; CABG, coronary bypass grafting; COPD, chronic obstructive pulmonary disease; HF, heart failure; HFpEF, HF with preserved ejection fraction; HFrEF with reduced ejection fraction; HR, hazard ratio; MI, myocardial infarction; PCI, percutaneous coronary intervention; pEF, preserved ejection fraction; rEF, reduced ejection fraction.
Table 3 summarizes the mortality rates and adjusted HRs in men and women, while Figure 5 demonstrates the estimated long‐term survival stratified by sex. Women with HFrEF had higher standardized long‐term mortality rates than men. While the adjusted HRs for long‐term mortality were similar between the sexes in the HFpEF subgroup, women with HFrEF had a slightly lower risk of death compared with men.
Figure 5.
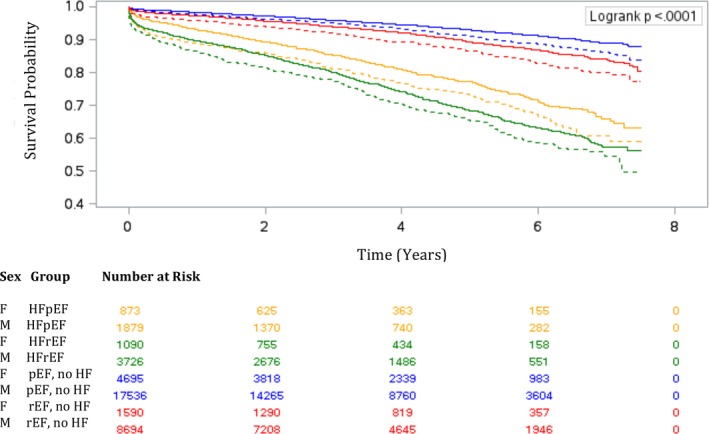
Estimated long‐term survival for men and women after coronary artery bypass grafting surgery. Estimated survival in men (solid lines) and women (dotted lines) with heart failure (HF) with preserved ejection fraction (HFpEF; golden lines) and HF with reduced ejection fraction (HFrEF; (green lines), preserved ejection fraction (pEF) without HF (blue lines), and reduced ejection fraction (rEF) without HF (red lines).
Sex modified the correlation between long‐term mortality and age, recent MI, COPD/asthma, and anemia (Table 5). There was no sex‐based difference in long‐term mortality in patients younger than 75 years. Although age older than 75 years was associated with a higher risk of death in both sexes, this risk was higher in men compared with women. In addition, COPD/asthma were associated with a higher mortality risk in men, while recent MI and anemia were associated with higher mortality risk in women.
As a post hoc analysis to investigate factors that contributed to poorer outcomes in women, we examined the sex differences in HF onset and severity before and following CABG (Table 7). We found that women had higher rates of HF admissions before CABG and experienced significantly longer intervals from onset of HF symptoms until CABG compared with men. In the year following CABG, women had significantly higher rates of MI, repeat revascularization, stroke, new‐onset dialysis, HF admission, and admission to long‐term care facilities compared with men.
Table 7.
Sex Differences in Pre‐ and Post‐CABG Events
| Variable | Men | Women | P Value |
|---|---|---|---|
| HF events before CABG | |||
| Mean time from HF onset to CABG (SD), ya | 2.1 (4.0) | 2.4 (4.4) | 0.02 |
| HF admission within 90 d before CABG, No. (%) | 417/31 835 (1.3) | 181/8248 (2.2) | <0.001 |
| HF admission within 1 y before CABG, No. (%) | 620/31 835 (2.0) | 262/8248 (3.2) | <0.001 |
| Post‐CABG events within 1 y of surgery | |||
| Myocardial infarction | 1438 (4.5) | 619 (7.5) | <0.001 |
| HF admission | 813 (2.6) | 342 (4.1) | <0.001 |
| Long‐term care admission | 148 (0.5) | 106 (1.3) | <0.001 |
| Repeat revascularization | 195 (0.6) | 81 (1.0) | <0.001 |
| Stroke | 903 (2.8) | 312 (3.8) | <0.001 |
| New postoperative dialysisb | 282 (0.9) | 100 (1.2) | 0.006 |
Among patients who had a diagnosis of heart failure (HF) before coronary artery bypass grafting (CABG; 5605 men and 1963 women).
Among patients who were free of dialysis before CABG (31 188 men and 8052 women).
Discussion
This population‐based study found that a history of HF was a more important prognosticator than EF in patients with CABG. Four main findings were derived from this study. (1) The prevalence and long‐term mortality rates of HF were higher in women than men. (2) Women had a higher adjusted risk of 30‐day and long‐term mortality compared with men. (3) A history of PCI was correlated with an increased risk of 30‐day mortality in women but not in men. For long‐term mortality, age 75 years and older and COPD/asthma were associated with increased risk in men, while recent MI and anemia were associated with increased risk in women. (4) Women had higher rates of HF admissions in the year leading up to CABG and experienced a longer delay from HF onset until revascularization when compared with men.
Sex Differences in HF Prevalence and Mortality
Our investigation is the first population‐based study to address the sex differences in HFpEF prevalence and outcomes in patients with CABG. Congruent with previous reports, we found a greater proportion of women in the HFpEF subgroup (31.7%) than the HFrEF subgroup (22.6%).5, 6, 11 Studies of hospitalized patients with HF found that HFpEF contributed to nearly half of the HF cases and was nearly as fatal as HFrEF.5, 6 In our study, the overall prevalence of HFpEF was only half that of HFrEF. Our finding possibly suggests the presence of a natural selection bias, whereby patients with CABG were more likely to present with HFrEF as a result of CAD being a stronger risk factor for HFrEF than HFpEF. However, we cannot rule out the possibility of under‐recognition of the HFpEF syndrome in the perioperative setting.
In addition, we found that in the HFpEF group, the 30‐day mortality rate was higher in women than men. This is an important observation as nearly 50% of all HF cases occur in women, but HF in women remains a poorly recognized and understood syndrome.29 Despite better outpatient survival from HF in women compared with men, we found this pattern to be reversed in the perioperative setting, especially in those with preserved EF. Our post hoc analysis further characterized HF by sex in surgical patients. We found that women had higher rates of acute HF admissions both within 90 days and 1 year before CABG. In addition, there was a longer delay from HF onset until CABG in women compared with men. These findings suggest that in addition to potential delay in definitive treatment of ischemic heart disease, women likely also present with more advanced stages of HF at the time of surgery, which would naturally have an impact on their post‐CABG survival. Our findings also suggest that regardless of HF status, there was a higher rate of complications in women that had not only led to poorer survival but also had implications on their quality of life. There is therefore an urgent need for improved recognition of the sex differences in HF presentation30 and research to inform tailored perioperative management and follow‐up.
CAD is a leading cause of HF for both sexes. The severity of CAD is often underestimated in women compared with men, possibly because of the likelihood for an atypical presentation to CAD for women.31 When diagnosed with CAD, women are less likely than men to undergo cardiac catheterization and revascularization.32 This is an important observation, especially since patients with HFpEF with incomplete revascularization displayed greater deterioration in EF and increased mortality.8 Notably, the better prognosis of HFpEF observed in the current study is likely in part caused by a higher proportion of the HFpEF group having previous PCIs than the HFrEF group. In a small study of patients with HFpEF with CAD, those who underwent CABG had similar short‐term mortality but better long‐term survival than those who underwent PCI.12 This study and ours support the importance of timely revascularization in women with HFpEF.
We found that the adjusted risk of mortality differed in HFpEF versus HFrEF, especially over the short term. These findings are congruent with the Swedish CABG study,11 with the observation that the risk of 30‐day mortality was higher in Swedish patients with rEF without HF (adjusted HR, 2.25 [95% CI, 1.86–2.73] compared with 1.56 [95% CI, 1.23–1.97] in our cohort). Conversely, the risk of 30‐day mortality in Swedish patients with HF (adjusted HR of 1.83 in HFpEF and 2.52 in HFrEF) was much lower than in our cohort (adjusted HR of 2.60 in HFpEF and 3.92 in HFrEF). These observations could reflect regional differences in management of chronic HF and HF risk factors, as well as perioperative management of patients with HF. The HFpEF comorbidities found in the present study (ie, older age, female sex, frailty, hypertension, absence of previous MI, diabetes mellitus, and obesity) were consistent with previous studies.5, 33
HFrEF is a well‐recognized risk factor for short‐ and long‐term mortality after CABG surgery,2, 3, 4, 11 although the prognostic role of sex is still poorly understood in this group. A post hoc analysis of the IMAGINE (Ischemia Management With Accupril Post Bypass Graft via Inhibition of Angiotensin Converting Enzyme) trial found female sex to be a nonsignificant predictor of death after multivariable adjustment and concluded that definitive answers regarding sex differences in long‐term outcomes after CABG should come from future pooling of studies comprising a larger number of women.34 Our study provides, so far, the largest cohort to evaluate the differences in CABG outcomes in men and women with rEF. We found that although the short‐ and long‐term mortality rates were higher in women, the adjusted risk of death was lower in women with HFrEF and similar between the sexes in rEF without HF. This possibly reflects the longer life expectancy in women, as well as the widespread recognition of the importance of HFrEF management in the perioperative period and in long‐term follow‐up.
EF and Perioperative Management
Perioperative risk stratification and management have been “EF‐centric,” with much attention being dedicated to the optimization of rEF. Nonetheless, HFpEF remains a deadly yet neglected syndrome. Similar to a recent Swedish population‐based study,11 our research found the adjusted mortality risk to be higher in HFpEF than in rEF without HF and higher in HFrEF than HFpEF. On the contrary, a small Japanese study found no difference in 5‐year survival post‐CABG in patients with HFpEF and HFrEF.12 This discrepancy is likely attributable to regional and ethnic differences in HF risk factors and outcomes, as well as possible increased awareness of the HFpEF syndrome in Japan. These findings highlight the need for a paradigm shift in Western countries to improve the preoperative screening of HF symptoms, regardless of EF. Specifically, a history of HF is not included in commonly used cardiac surgery mortality risk scores. The EuroScore II35 incorporates preoperative EF but does not account for HF in the calculation of early operative mortality. The Society of Thoracic Surgeons risk model36 includes preoperative EF and New York Heart Association functional status (a classification of physical activity limitations) but not a history of HF. Our study highlights the need to revise the current risk scoring systems and improve the recognition and management of HFpEF, especially in women.
Limitations
This study has several limitations. First, the sex differences in outcomes by HF status are representative of perioperative practice in Ontario. Similar research needs to be conducted in other settings to confirm the generalizability of our findings. Second, our data sources lacked some relevant detailed information such as smoking history. The inability to measure, and thereby adjust for, differences in such characteristics could have explained, in part, the differences in mortality rates observed in this study. Third, the lack of natriuretic peptides measurements precluded the use of this biomarker as a third diagnostic criterion for HFpEF7 and possibly contributed to misclassification of HFpEF as pEF without HF. However, biomarker measurements are not a routine practice in Ontario, and whether BNP would further improve risk stratification in patients with HF, above and beyond physician‐diagnosed HF, remains to be determined. Fourth, our reporting of sex‐specific risk factors is to be interpreted in the context of multiple testing. Finally, cohort studies are by nature subject to residual confounding.
Conclusions
In a large cohort of patients who underwent primary CABG, we found a higher prevalence of HFpEF in women and a higher risk of operative mortality in women compared with men with HFpEF. HFpEF is an important predictor of operative and long‐term mortality. Rather than being “EF‐centric,” efforts should be given to earlier recognition of HF symptoms in women and timely referral of these patients for revascularization. Similarly, perioperative risk stratification and extended postoperative follow‐up including tailored therapy and home monitoring should be focused on women and men with signs and symptoms of HF rather than on reduced EF alone.
Sources of Funding
We acknowledge support from an operating grant from the University of Ottawa Department of Anesthesiology and Pain Medicine (grant number 4566). Dr Tu is supported by a Canada Research Chair in Health Services Research and a Career Investigator Award from the Heart and Stroke Foundation of Ontario.
Disclosures
None.
Acknowledgments
This study was supported by the Institute for Clinical Evaluative Sciences, which is funded by an annual grant from the Ontario Ministry of Health and Long‐Term Care. The authors acknowledge that the clinical registry data used in this analysis are from participating hospitals through CorHealth Ontario, which serves as an advisory body to the Ontario Ministry of Health and Long‐Term Care, is funded by the Ontario Ministry of Health and Long‐Term Care, and is dedicated to improving the quality, efficiency, access, and equity in the delivery of the continuum of adult cardiac services in Ontario, Canada. The authors also acknowledge the usage of data compiled and provided by the Canadian Institute for Health Information. These data sets were linked using unique encoded identifiers and analyzed at the Institute for Clinical Evaluative Sciences. The analyses, conclusions, opinions, and statements expressed in the article are those of the authors and do not necessarily reflect those of the above agencies.
(J Am Heart Assoc. 2018;7:e008902 DOI: 10.1161/JAHA.118.008902.)
References
- 1. Velazquez EJ, Lee KL, Jones RH, Al‐Khalidi HR, Hill JA, Panza JA, Michler RE, Bonow RO, Doenst T, Petrie MC, Oh JK, She L, Moore VL, Desvigne‐Nickens P, Sopko G, Rouleau JL. Coronary‐artery bypass surgery in patients with ischemic cardiomyopathy. N Engl J Med. 2016;374:1511–1520. [DOI] [PMC free article] [PubMed] [Google Scholar]
- 2. Velazquez EJ, Williams JB, Yow E, Shaw LK, Lee KL, Phillips HR, O'Connor CM, Smith PK, Jones RH. Long‐term survival of patients with ischemic cardiomyopathy treated by coronary artery bypass grafting versus medical therapy. Ann Thorac Surg. 2012;93:523–530. [DOI] [PMC free article] [PubMed] [Google Scholar]
- 3. Wrobel K, Stevens SR, Jones RH, Selzman CH, Lamy A, Beaver TM, Djokovic LT, Wang N, Velazquez EJ, Sopko G, Kron IL, DiMaio JM, Michler RE, Lee KL, Yii M, Leng CY, Zembala M, Rouleau JL, Daly RC, Al‐Khalidi HR. Influence of baseline characteristics, operative conduct, and postoperative course on 30‐day outcomes of coronary artery bypass grafting among patients with left ventricular dysfunction: results from the surgical treatment for ischemic heart failure (STICH) trial. Circulation. 2015;132:720–730. [DOI] [PMC free article] [PubMed] [Google Scholar]
- 4. Hillis GS, Zehr KJ, Williams AW, Schaff HV, Orzulak TA, Daly RC, Mullany CJ, Rodeheffer RJ, Oh JK. Outcome of patients with low ejection fraction undergoing coronary artery bypass grafting: renal function and mortality after 3.8 years. Circulation. 2006;114:I414–I419. [DOI] [PubMed] [Google Scholar]
- 5. Bhatia RS, Tu JV, Lee DS, Austin PC, Fang J, Haouzi A, Gong Y, Liu PP. Outcome of heart failure with preserved ejection fraction in a population‐based study. N Engl J Med. 2006;355:260–269. [DOI] [PubMed] [Google Scholar]
- 6. Steinberg BA, Zhao X, Heidenreich PA, Peterson ED, Bhatt DL, Cannon CP, Hernandez AF, Fonarow GC; Get With the Guidelines Scientific Advisory Committee and Investigators . Trends in patients hospitalized with heart failure and preserved left ventricular ejection fraction: prevalence, therapies, and outcomes. Circulation. 2012;126:65–75. [DOI] [PubMed] [Google Scholar]
- 7. Ponikowski P, Voors AA, Anker SD, Bueno H, Cleland JG, Coats AJ, Falk V, Gonzalez‐Juanatey JR, Harjola VP, Jankowska EA, Jessup M, Linde C, Nihoyannopoulos P, Parissis JT, Pieske B, Riley JP, Rosano GM, Ruilope LM, Ruschitzka F, Rutten FH, van der Meer P; Authors/Task Force M . 2016 ESC guidelines for the diagnosis and treatment of acute and chronic heart failure: the Task Force for the diagnosis and treatment of acute and chronic heart failure of the European Society of Cardiology (ESC). Developed with the special contribution of the Heart Failure Association (HFA) of the ESC. Eur Heart J. 2016;37:2129–2200. [DOI] [PubMed] [Google Scholar]
- 8. Hwang SJ, Melenovsky V, Borlaug BA. Implications of coronary artery disease in heart failure with preserved ejection fraction. J Am Coll Cardiol. 2014;63:2817–2827. [DOI] [PubMed] [Google Scholar]
- 9. Lund LH, Donal E, Oger E, Hage C, Persson H, Haugen‐Lofman I, Ennezat PV, Sportouch‐Dukhan C, Drouet E, Daubert JC, Linde C, KaRen I. Association between cardiovascular vs. non‐cardiovascular co‐morbidities and outcomes in heart failure with preserved ejection fraction. Eur J Heart Fail. 2014;16:992–1001. [DOI] [PubMed] [Google Scholar]
- 10. Kitzman DW, Gardin JM, Gottdiener JS, Arnold A, Boineau R, Aurigemma G, Marino EK, Lyles M, Cushman M, Enright PL; Cardiovascular Health Study Research Group . Importance of heart failure with preserved systolic function in patients > or = 65 years of age. CHS Research Group. Cardiovascular Health Study. Am J Cardiol. 2001;87:413–419. [DOI] [PubMed] [Google Scholar]
- 11. Dalen M, Lund LH, Ivert T, Holzmann MJ, Sartipy U. Survival after coronary artery bypass grafting in patients with preoperative heart failure and preserved vs reduced ejection fraction. JAMA Cardiol. 2016;1:530–538. [DOI] [PubMed] [Google Scholar]
- 12. Marui A, Nishiwaki N, Komiya T, Hanyu M, Tanaka S, Kimura T, Sakata R; Investigators CR‐KCRC . Comparison of 5‐year outcomes after coronary artery bypass grafting in heart failure patients with versus without preserved left ventricular ejection fraction (from the CREDO‐Kyoto CABG Registry Cohort‐2). Am J Cardiol. 2015;116:580–586. [DOI] [PubMed] [Google Scholar]
- 13. Tu JV, Ko DT, Guo H, Richards JA, Walton N, Natarajan MK, Wijeysundera HC, So D, Latter DA, Feindel CM, Kingsbury K, Cohen EA; Cardiac Care Network of Ontario's Variations in Revascularization Practice in Ontario Working Group . Determinants of variations in coronary revascularization practices. CMAJ. 2012;184:179–186. [DOI] [PMC free article] [PubMed] [Google Scholar]
- 14. Schultz SE, Rothwell DM, Chen Z, Tu K. Identifying cases of congestive heart failure from administrative data: a validation study using primary care patient records. Chronic Dis Inj Can. 2013;33:160–166. [PubMed] [Google Scholar]
- 15. Tu K, Campbell NRC, Chen ZL, Cauch‐Dudek KJ, McAlister FA. Accuracy of administrative databases in identifying patients with hypertension. Open Med. 2007;1:e18–e26. [PMC free article] [PubMed] [Google Scholar]
- 16. Juurlink D, Preya C, Croxford R, Chong A, Austin P, Tu J, Laupacis A. Canadian Institute for Health Information Discharge Abstract Database: A Validation Study. ICES Investigative Report. Toronto, ON: Institute for Clinical Evaluative Sciences; 2006. [Google Scholar]
- 17. Hux JE, Ivis F, Flintoft V, Bica A. Diabetes in Ontario: determination of prevalence and incidence using a validated administrative data algorithm. Diabetes Care. 2002;25:512–516. [DOI] [PubMed] [Google Scholar]
- 18. Austin PC, Daly PA, Tu JV. A multicenter study of the coding accuracy of hospital discharge administrative data for patients admitted to cardiac care units in Ontario. Am Heart J. 2002;144:290–296. [DOI] [PubMed] [Google Scholar]
- 19. Quan H, Sundararajan V, Halfon P, Fong A, Burnand B, Luthi JC, Saunders LD, Beck CA, Feasby TE, Ghali WA. Coding algorithms for defining comorbidities in ICD‐9‐CM and ICD‐10 administrative data. Med Care. 2005;43:1130–1139. [DOI] [PubMed] [Google Scholar]
- 20. Gershon AS, Wang C, Guan J, Vasilevska‐Ristovska J, Cicutto L, To T. Identifying patients with physician‐diagnosed asthma in health administrative databases. Can Respir J. 2009;16:183–188. [DOI] [PMC free article] [PubMed] [Google Scholar]
- 21. Gershon AS, Wang C, Guan J, Vasilevska‐Ristovska J, Cicutto L, To T. Identifying individuals with physcian diagnosed COPD in health administrative databases. COPD. 2009;6:388–394. [DOI] [PubMed] [Google Scholar]
- 22. du Plessis V, Beshiri R, Bollman RD, Clemeson H. Definitions of “rural”. Agriculture and Rural Working Paper Series, No. 61. Ottawa, ON: Statistics Canada; 2002. [Google Scholar]
- 23. Abrams C, Lieberman R, Weiner JP. Development and evaluation of the Johns Hopkins University Risk Adjustment Models for Medicare+ Choice Plan Payment. Centers for Medicare and Medicaid Services, US Department of Health and Human Services. Baltimore, MD: Johns Hopkins University; 2003. [Google Scholar]
- 24. Sternberg SA, Bentur N, Abrams C, Spalter T, Karpati T, Lemberger J, Heymann AD. Identifying frail older people using predictive modeling. Am J Manag Care. 2012;18:e392–e397. [PubMed] [Google Scholar]
- 25. The Johns Hopkins Adjusted Clinical Groups Technical Reference Guide, version 9.0. 2009.
- 26. Bronskill SE, Carter MW, Costa AP, Esensoy AV, Gill SS, Gruneir A, Henry DA, Hirdes JP, Jaakkimainen RL, Poss JW, Wodchis WP. Aging in Ontario: An ICES Chartbook of Health Services Use by Older Adults—a Technical Report. Ontario, Canada: Institute for Clinical Evaluative Sciences; 2010. [Google Scholar]
- 27. Bronskill SE, Camacho X, Gruneir A, Ho M. Health System Use by Frail Ontario Seniors: An In‐Depth Examination of Four Vulnerable Cohorts. Toronto, ON: Institute for Clinical Evaluative. Sciences; 2011. [Google Scholar]
- 28. Zhang X. Generalized estimating equations for clustered survival data. Retrospective Theses and Dissertations. 2006. Available at: http://lib.dr.iastate.edu/rtd/3063. Accessed February 1, 2018.
- 29. Hsich EM, Pina IL. Heart failure in women: a need for prospective data. J Am Coll Cardiol. 2009;54:491–498. [DOI] [PubMed] [Google Scholar]
- 30. Rosamond W, Flegal K, Furie K, Go A, Greenlund K, Haase N, Hailpern SM, Ho M, Howard V, Kissela B, Kittner S, Lloyd‐Jones D, McDermott M, Meigs J, Moy C, Nichol G, O'Donnell C, Roger V, Sorlie P, Steinberger J, Thom T, Wilson M, Hong Y. Heart Disease and Stroke Statistics—2008 update: a report from the American Heart Association Statistics Committee and Stroke Statistics Subcommittee. Circulation. 2008;117:e25–e146. [DOI] [PubMed] [Google Scholar]
- 31. Jarvie JL, Foody JM. Recognizing and improving health care disparities in the prevention of cardiovascular disease in women. Curr Cardiol Rep. 2010;12:488–496. [DOI] [PubMed] [Google Scholar]
- 32. McSweeney J, Pettey C, Lefler LL, Heo S. Disparities in heart failure and other cardiovascular diseases among women. Womens Health (Lond). 2012;8:473–485. [DOI] [PMC free article] [PubMed] [Google Scholar]
- 33. Samson R, Jaiswal A, Ennezat PV, Cassidy M, Le Jemtel TH. Clinical phenotypes in heart failure with preserved ejection fraction. J Am Heart Assoc. 2016;5:e002477 DOI: 10.1161/JAHA.115.002477. [DOI] [PMC free article] [PubMed] [Google Scholar]
- 34. den Ruijter HM, Haitjema S, van der Meer MG, van der Harst P, Rouleau JL, Asselbergs FW, van Gilst WH. Long‐term outcome in men and women after CABG; results from the IMAGINE trial. Atherosclerosis. 2015;241:284–288. [DOI] [PubMed] [Google Scholar]
- 35. Nashef SA, Roques F, Sharples LD, Nilsson J, Smith C, Goldstone AR, Lockowandt U. EuroSCORE II. Eur J Cardiothorac Surg. 2012;41:734–744. [DOI] [PubMed] [Google Scholar]
- 36. Shahian DM, O'Brien SM, Filardo G, Ferraris VA, Haan CK, Rich JB, Normand SL, DeLong ER, Shewan CM, Dokholyan RS, Peterson ED, Edwards FH, Anderson RP; Society of Thoracic Surgeons Quality Measurement Task Force . The Society of Thoracic Surgeons 2008 cardiac surgery risk models: part 1–coronary artery bypass grafting surgery. Ann Thorac Surg. 2009;88:S2–S22. [DOI] [PubMed] [Google Scholar]