Figure 4.
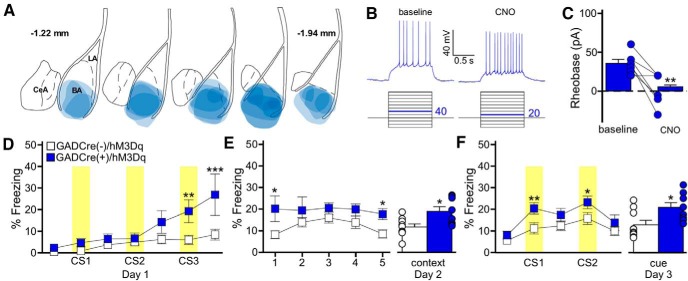
BA GABA neuron stimulation generates an association between a behavior and an auditory cue. A, Schematic summarizing the distribution of hM3Dq-mCherry fluorescence in the BA (coronal view, spanning –1.22mm to –1.94mm posterior from bregma) of the GADCre(+)/hM3Dq mice evaluated in D–F. B, CNO-induced stimulation of an hM3Dq-expressing BA GABA neuron. Rheobase was measured before (baseline) and after application of CNO (10 μm). The current-step protocol is depicted below the traces. The first step to elicit spiking is highlighted in blue; the trace shown is the response to the denoted current step. C, Rheobase summary for hM3Dq-expressing BA GABA neurons, before and after CNO application (t(6)=4.4, **p < 0.001). Each experiment is represented as connected circles (n = 7). D, Impact of BA GABA neuron stimulation during training. Freezing behavior during training (3 CS/0 US) for GADCre(+)/hM3Dq (blue) and GADCre(−)/hM3Dq (white) mice. CNO (2 mg/kg, i.p.) was given 30 min before training. Yellow bars represent CS presentations. There was a significant main effect of genotype (F(1,90)=6.5, p = 0.020; CS3: **p = 0.005, post-CS3: ***p < 0.001). E, Freezing during the context recall test. The plot on the left shows freezing for each 1 min bin of the 5 min context test. There was a significant main effect of genotype (F(1,60)=7.9, p = 0.013; bin 1: *p = 0.01, bin 5: *p = 0.04). The plot on the right shows the mean percentage freezing for the entire context test (t(15)= −2.8, *p = 0.013). F, Freezing during the cue recall test. The plot on the right shows freezing during each 3 min bin of the cue test, with CS presentations highlighted in yellow. There was a significant main effect of genotype (F(1,75)=13.6, p < 0.001; CS1: **p = 0.008, CS2: *p = 0.03). GADCre(+)/hM3Dq (t(14)= −2.6, p = 0.021), but not GADCre(−)/hM3Dq mice (t(16)=−1.5, p = 0.152) froze significantly more during the CS periods than the non-CS periods. The bars on the right represent mean percentage freezing during the combined CS presentations (t(15)=−2.5, *p = 0.023). Error bars in C, E, and F represent the mean ± SEM, with dots next to the bars denoting individual data points (n = 4/4–5/4 males/females per group).

